Determination of the Photoisomerization Quantum Yield of a Hydrazone Photoswitch
Summary
Photoisomerization quantum yield is a fundamental photophysical property that should be accurately determined in the investigation of newly developed photoswitches. Here, we describe a set of procedures to measure the photoisomerization quantum yield of a photochromic hydrazone as a model bistable photoswitch.
Abstract
Photoswitching organic molecules that undergo light-driven structural transformations are key components to construct adaptive molecular systems, and they are utilized in a wide variety of applications. In most studies employing photoswitches, several important photophysical properties such as maximum wavelengths of absorption and emission, molar attenuation coefficient, fluorescence lifetime, and photoisomerization quantum yield are carefully determined to investigate their electronic states and transition processes. However, measurement of the photoisomerization quantum yield, the efficiency of photoisomerization with respect to the absorbed photons, in a typical laboratory setting is often complicated and prone to error because it requires the implementation of rigorous spectroscopic measurements and calculations based on an appropriate integration method. This article introduces a set of procedures to measure the photoisomerization quantum yield of a bistable photoswitch using a photochromic hydrazone. We anticipate that this article will be a useful guide for the investigation of bistable photoswitches that are being increasingly developed.
Introduction
Photochromic organic molecules have attracted considerable attention in a wide range of scientific disciplines as light is a unique stimulus that can drive a system away from its thermodynamic equilibrium non-invasively1. Irradiation of light with appropriate energies allows structural modulation of photoswitches with high spatiotemporal precision2,3,4. Thanks to these advantages, various types of photoswitches based on configurational isomerization of the double bonds (e.g., stilbenes, azobenzenes, imines, fumaramides, thioindigos) and ring opening/closure (e.g., spiropyrans, dithienylethenes, fulgides, donor-acceptor Stenhouse adducts) have been developed and utilized as the core components of adaptive materials at various length scales. Representative applications of photoswitches involve photochromic materials, drug delivery, switchable receptors and channels, information or energy storage, and molecular machines5,6,7,8,9,10,11,12. In most studies presenting newly designed photoswitches, their photophysical properties such as λmax of absorption and emission, molar attenuation coefficient (ε), fluorescence lifetime, and photoisomerization quantum yield are characterized thoroughly. The investigation of such properties provides key information on the electronic states and transitions that are crucial for understanding the optical properties and isomerization mechanism.
However, accurate measurement of photoisomerization quantum yield-the number of photoisomerization events that occurred divided by the number of photons at the irradiation wavelength absorbed by the reactant-is often complicated in a typical laboratory setting due to several reasons. Determination of the photoisomerization quantum yield is generally achieved by monitoring the advancement of reaction and measuring the number of absorbed photons during irradiation. The primary concern is that the amount of photon absorption per unit time changes progressively because the total absorption by the solution changes over time as the photochemical reaction proceeds. Therefore, the number of consumed reactants per unit time depends on the time section in which it is measured during the irradiation. Thus, one is obliged to estimate the photoisomerization quantum yield that is defined differentially.
A more troublesome problem arises when both the reactant and photoproduct absorb light at the irradiation wavelength. In this case, the photochemical isomerization occurs in both directions (i.e., a photoreversible reaction). The two independent quantum yields for the forward and backward reactions cannot be obtained directly from the observed reaction rate. Inaccurate light intensity is also a common cause of error. For example, the aging of the bulb gradually changes its intensity; irradiance of the Xenon arc lamp at 400 nm decreases by 30% after 1000 h of operation14. The spreading of non-collimated light makes the actual incident irradiance significantly smaller than the nominal power of the source. Thus, it is crucial to accurately quantify the effective photon flux. Of note, thermal relaxation of the metastable form at room temperature should be sufficiently small to be ignored.
This paper introduces a set of procedures to determine the photoisomerization quantum yield of a bistable photoswitch. A number of hydrazone photoswitches developed by the group of Aprahamian, the pioneering research team in the field, have been in the spotlight thanks to their selective photoisomerization and remarkable stability of their metastable isomers15,16,17. Their hydrazone photoswitches comprise two aromatic rings joined by a hydrazone group, and the C=N bond undergoes selective E/Z isomerization upon irradiation at appropriate wavelengths (Figure 1). They have been successfully incorporated as the motile components of dynamic molecular systems18,19,20,21. In this work, we prepared a new hydrazone derivative bearing amide groups and investigated its photoswitching properties for the determination of the photoisomerization quantum yield.
Protocol
1. 1H NMR spectrum acquisition at photostationary state (PSS)
- In a natural quartz NMR tube containing 4.2 mg (0.01 mmol) of hydrazone switch 1, add 1.0 mL of deuterated dimethyl sulfoxide (DMSO-d6). Transfer half of the solution to another NMR tube.
- Place one of the NMR tubes 1 cm in front of a Xenon arc lamp equipped with a 436 nm bandpass filter. Start irradiation to the NMR sample and record a 1H NMR spectrum every day until there is no change in the spectra as switch 1 reaches PSS. After reaching PSS, keep the NMR tube in the dark at room temperature and record the 1H NMR spectrum after 12 h to monitor the progress of thermal relaxation.
NOTE: Switch 1 does not show any appreciable change in the 1H NMR spectrum at room temperature due to its bistable nature. - For the other NMR tube, repeat step 1.2 with a 340 nm bandpass filter to obtain a 1H NMR spectrum at the PSS under 340 nm irradiation.
- Open fid files of the NMR spectra at the PSSs with NMR processing software. Integrate a distinctive set of peaks (H1: C2 proton of quinoline, H2: proton in para-position to the hydrazone group, H3: CH3 of ethyl ester) of the distinct isomers and calculate the isomeric ratio (Figure 2).
NOTE: Compositions ([1–Z]:[1–E] ratio) under 436 nm and 340 nm irradiation are 8:92 and 82:18, respectively.
2. UV-Vis absorption spectroscopy at PSS
- In a glass vial containing 12.6 mg (0.03 mmol) of 1, add 2 mL of spectroscopy grade DMSO. Take 100 µL of the solution and dilute with 1400 µL of DMSO to make 1 mM solution of 1. Transfer 20 µL of 1 mM solution of 1 to a quartz cuvette with 1.0 cm optical path length and dilute with 1980 µL of DMSO to make a 10 µM solution of 1. Seal the cuvette with a PTFE stopper and keep the sample in the dark.
- Prepare another quartz cuvette containing 2 mL of DMSO as a blank sample. Measure the UV-Vis spectrum of the blank sample for baseline correction.
- Place the sample from step 2.1 1 cm in front of a Xenon arc lamp equipped with a 436 nm bandpass filter. Start irradiation to the sample and measure the UV-Vis spectrum every 2 h until there is no change in the spectra as 1 reaches PSS (Figure 3).
NOTE: The time taken to reach PSS for the UV-Vis spectroscopy sample is much shorter than for the NMR sample with a higher concentration. - Repeat step 2.3 with a 340 nm bandpass filter to obtain the UV-Vis spectrum at the PSS under 340 nm irradiation.
- Deduce absorbance spectra of the pure 1–Z and 1–E using Eq (1) and Eq (2) (Figure 4).
 (1)
(1)
 (2)
(2)
Where R436 = the ratio of 1–Z at the PSS under 436 nm irradiation; R340 = the ratio of 1–Z at the PSS under 340 nm irradiation; A436 = the absorbance of 1 in DMSO at the PSS under 436 nm irradiation; A340 = the absorbance of 1 in DMSO at the PSS under 340 nm irradiation. - Calculate the molar attenuation coefficients of pure 1–Z and 1–E at all wavelengths by dividing the observed absorbance by the sample concentration (10 µM) and the optical path length (1 cm).
3. Kinetic studies on thermal relaxation
- Heat the silicon oil filled in a heating bath circulator to the desired temperature (131 °C) and check if the temperature of the bath is stabilized. Submerge two NMR samples from step 1.2 in the heating bath.
NOTE: The temperature and duration of heating are adjusted depending on the relaxation rate. - After 1 h of heating, transfer the NMR tubes quickly to a dry ice bath to pause the thermal relaxation caused by latent heat (Figure 5).
NOTE: Inaccurate heating temperature or time may lead to serious error in the estimation of the rate constant. - Thaw the NMR samples obtained from step 3.2 at room temperature and ensure DMSO is defrosted. Record the 1H NMR spectra of the samples.
- Repeat steps 3.1-3.3 until there is no change in the 1H NMR spectra as 1 reaches thermodynamic equilibrium.
- Repeat steps 3.1-3.4 at different temperatures (134, 137, 140, and 143 °C).
- Open fid files of the NMR spectra obtained in the course of heating at 131 °C. Calculate the averaged isomeric ratios as described in step 1.4. Calculate the concentration of 1–E (metastable isomer) based on the total sample concentration (10 mM) and the isomeric ratio.
- Plot the averaged concentration of 1–E (CE) as a function of the heating time. Perform an exponential fit to the data to obtain the rate constant of thermal relaxation using Eq (3)15,22 (Figure 6).
 (3)
(3)
Where (M) = the concentration of 1–E at the initial state;
  (M) = the concentration of 1–E at the thermodynamic equilibrium at a specific temperature; k (s-1) = the rate constant of thermal relaxation at a specific temperature; t (s) = the heating time.
 - Repeat steps 3.6 to 3.7 using the data obtained at different temperatures.
- Plot ln(k) versus
 and perform a linear fit according to the Arrhenius equation (Eq (4)) to extrapolate the rate constant at room temperature (Figure 7).
 (4)
(4)
Where A = the pre-exponential factor; Ea (J·mol-1) = the activation energy for thermal relaxation; R = the ideal gas constant (8.3145 J·mol-1K-1); T (K) = the absolute temperature. - Calculate the thermal half-life of 1–E at room temperature using Eq (5).
 (5)
(5)
Where τ1/2 (s) = the thermal half-life of 1–E at room temperature; k (s-1) = the rate constant of thermal relaxation at room temperature obtained from step 3.9. - If the rate constant of thermal relaxation is estimated only at a single temperature, calculate the rate constant at room temperature using the following rearranged Eyring equation (Eq (6))18,23.
 (6)
(6)
 (7)
(7)
Where (J·mol-1) = the Gibbs energy of activation for thermal relaxation; k1 (s-1) = the rate constant of thermal relaxation estimated at the elevated temperature; k2 (s-1) = the rate constant of thermal relaxation at room temperature (298.15 K); T1 (K) = the absolute temperature at which k1 is obtained; (K) = room temperature (298.15 K).
4. Ferrioxalate actinometry
NOTE: All procedures for ferrioxalate actinometry must be performed in the dark or >600 nm light to prevent the influence of ambient light.
- In a 20 mL glass vial containing 29.48 mg (0.06 mmol) of potassium ferrioxalate trihydrate, add 8 mL of deionized water. Add 1 mL of 0.5 M aqueous H2SO4 to the ferrioxalate solution and dilute to 10 mL with deionized water to prepare a 0.006 M ferrioxalate in 0.05 M aqueous H2SO4 solution.
- In another 20 mL glass vial containing 10 mg of 1,10-phenanthroline and 1.356 g of anhydrous sodium acetate, add 10 mL of 0.5 M aqueous H2SO4 to make a buffered 0.1% (w/v) phenanthroline solution.
- Transfer 2 mL of the 0.006 M ferrioxalate solution from step 4.1 to a quartz cuvette with 1.0 cm optical path length. Seal the cuvette with a PTFE stopper and keep the sample in the dark.
- Prepare another quartz cuvette containing 2 mL of 0.05 M aqueous H2SO4 as a blank sample. Measure the UV-Vis absorbance of the blank sample for baseline correction.
- Measure the UV-Vis absorbance of the 0.006 M ferrioxalate solution. Determine the fraction of light absorbed using the absorbances of the 0.006 M ferrioxalate solution at 340 and 436 nm and Eq (8) (Figure 8).
 (8)
(8)
Where f = the fraction of light absorbed by 0.006 M ferrioxalate solution; Aλ = the absorbance of 0.006 M ferrioxalate solution at wavelength λ. - Prepare two quartz cuvettes with 1.0 cm optical path length and add 2 mL of the 0.006 M ferrioxalate solution.
- Place one of the samples from step 4.6 1 cm in front of the Xenon arc lamp equipped with a 436 nm bandpass filter. Keep the other sample in the dark. Start irradiation to the sample for 90 s. After irradiation, add 0.35 mL of the buffered 0.1% phenanthroline solution and a magnetic bar to both cuvettes followed by stirring for 1 h in the dark to form a [Fe(phen)3]2+ complex.
NOTE: Ferrioxalate is photochemically reduced to Fe2+, followed by the nearly quantitative formation of tris-1,10-phenanthroline iron (II) complex. - Measure the UV-Vis absorption spectrum of the non-irradiated sample from step 4.6 for baseline correction.
- Measure the UV-Vis absorption spectrum of the irradiated sample from step 4.7.
- Repeat steps 4.6-4.9 with a 340 nm bandpass filter (Figure 9).
NOTE: Once the ferrioxalate sample is exposed to light, the sample cannot be reused. - Calculate the molar photon flux arriving at the cuvette using Eq (9).
 (9)
(9)
Where I (mol·s-1) = the molar photon flux arriving at the cuvette; ΔA510 = the difference in absorbance at 510 nm between the non-irradiated and irradiated samples; V = the total volume of solution (2.35 mL); ε510 = the molar attenuation coefficient of [Fe(phen)3]2+ complex (11100 M-1cm-1)24; I = the optical path length of quartz cuvette (1.0 cm); t = irradiation time (90 s); f = the absorbed fraction of light obtained from step 4.5; ΦFe3+ = the quantum yield of the photoreduction of Fe3+ to Fe2+ (1.22 for 340 nm, 1.11 for 436 nm)25.
5. Determination of the photoisomerization quantum yield
- Prepare a quartz cuvette with 1.0 cm optical path length containing 2 mL of DMSO as the blank sample. Measure the UV-Vis absorbance of the blank sample for baseline correction.
- Prepare a quartz cuvette with 1.0 cm optical path length containing 2 mL of 10 µM solution of 1 in DMSO obtained from step 2.4 (Z-enriched). Seal the cuvettes with a PTFE stopper.
- Place the sample from step 5.2 1 cm in front of the Xenon arc lamp equipped with a 436 nm bandpass filter. Start irradiation at 436 nm to the sample and measure UV-Vis absorption spectrum with different intervals until there is no change in the spectra as 1 reaches PSS (Figure 10).
NOTE: The irradiation setup must be exactly the same as that used for the molar photon flux measurement. The irradiation interval should be adjusted based on the rate of photoisomerization. Generally, 15-20 data points before reaching PSS are suitable. - Prepare a quartz cuvette with 1.0 cm optical path length containing 2 mL of 10 µM solution of 1 in DMSO obtained from step 2.3 (E-enriched). Seal the cuvettes with a PTFE stopper.
- Replace the 436 nm bandpass filter with the 340 nm bandpass filter and repeat step 5.3 for the sample obtained from step 5.4.
- Calculate the photokinetic factor F(t) using the observed absorbances from step 5.3 and Eq (10)26.
 (10)
(10)
Where Airr,t = the absorbance at the irradiation wavelength at time t. - Calculate the pseudo quantum yield Q using the photokinetic factor values obtained from step 5.6 and Eq (11)27.
 (11)
(11)
Where Q (M-1cm-1) = the pseudo quantum yield defined as ; ; V(L) = the volume of sample; I (mol·s-1) = the molar photon flux arriving at the cuvette; l (cm) = the optical path length; t1, t2 (s) = the two consecutive time points of irradiation; F(t1), F(t2) = the photokinetic factors at time t1 and t2, respectively; Aobs,t1, Aobs,t2, Aobs,∞ = the absorbances at specific wavelength at time , t1, and t2 at PSS, respectively.
NOTE: Using absorbances at λmax of 1–Z is recommended for accuracy. - Calculate the averaged value of the pseudo quantum yield using the first ten data points.
- Calculate the unidirectional quantum yields for Z-to-E and E-to-Z photoisomerizations using Eq (12) and Eq (13).
 (12)
(12)
 (13)
(13)
Where ΦZ→E, ΦE→Z = the unidirectional quantum yields for Z-to-E and E-to-Z photoisomerization processes, respectively; ,
,  (M-1cm-1) = the molar attenuation coefficients of 1–Z and 1–E at the irradiation wavelength;
  ,
,  (M) = the concentrations of 1–Z and 1–E at PSS, respectively; Ctot (M) = the total concentration of 1.
 - Repeat steps 5.6-5.9 using the data obtained from step 5.5 for calculation of the unidirectional photoisomerization quantum yields under irradiation at 340 nm.
Representative Results
Upon irradiation of 1 in an NMR tube with 436 nm light (Z:E = 54:46 in the initial state), the proportion of 1–E increases due to the dominant Z-to-E isomerization of the hydrazone C=N bond (Figure 1). The isomeric ratio can be readily obtained from the relative signal intensities of distinct isomers in the 1H NMR spectrum (Figure 2). After 5 days of irradiation at 436 nm, the sample reaches PSS containing 92% of 1–E. Prolonged irradiation is required to reach PSS due to the high sample concentration (10 mM) and weak intensity of the light source. Subsequent irradiation at 340 nm induces E-to-Z isomerization, reaching PSS containing 82% of 1–Z after 3 days of irradiation.
A shorter irradiation time is required to reach PSS in the UV-Vis spectroscopy experiment (10 h and 4 h for irradiation at 436 and 340 nm, respectively) due to the lower sample concentration (10 µM). As it is difficult to isolate the pure isomers by chromatography or obtain them by photoisomerization, UV-Vis absorption spectra of 1 in the PSSs are used to deduce the absorption spectra of the pure 1–Z and 1–E (Figure 4). The wavelength of the absorption maximum (λmax, 398 nm for 1–Z and 375 nm for 1–E) and molar attenuation coefficient (ε) can be obtained from the deduced spectra. UV-Vis spectra of the pure isomers suggest that the incomplete photoisomerization is attributed to the reverse photochemical process, i.e., absorption band overlap at the irradiation wavelengths.
For determining the photoisomerization quantum yield, the rate of thermal relaxation and the effective molar photon flux are first investigated. Because the metastable isomer 1–E is highly stable at room temperature, thermally driven E-to-Z isomerization is monitored at elevated temperatures (from 131 to 143 °C) using 1H NMR spectroscopy, and the first-order rate constants of relaxation are estimated (Figure 6). The obtained rate constants at different temperatures are then plotted versus reciprocal temperature and linearly fitted using the Arrhenius equation (Eq (4)) (Figure 7). The rate of thermal relaxation ((2.2 ± 0.5) × 10-10 s-1) and the half-life of 1–E (101 ± 24 years) at room temperature can then be extrapolated. Thus, it is safe to ignore the effect of thermal relaxation in the photoisomerization process at room temperature. One can also use the rearranged Eyring equation (Eq (6)) shown in step 3.11 to estimate the half-life if only one rate constant is available.
For the determination of the effective molar photon flux in the irradiation setup, the fraction of light absorbed by ferrioxalate solution (f) should be measured precisely (Figure 8). Although a 0.006 M ferrioxalate solution is used in this protocol, a 0.15 M solution is recommended if using >440 nm light for irradiation due to the low absorbance25. Once the f is measured, the ferrioxalate solution is subjected to the photoreduction experiment. Upon irradiation, the ferrioxalate is reduced to a ferrous ion (Fe2+) that is subsequently coordinated by three phenanthroline ligands to form the [Fe(phen)3]2+ complex. The degree of photoreduction can then be obtained by measuring the absorption of [Fe(phen)3]2+ complex (Figure 9). The effective molar photon flux can be calculated from the known molar attenuation coefficient of [Fe(phen)3]2+ complex and quantum yield of the photoreduction at the irradiation wavelength. The irradiation power of the light source used in this experiment is enough to calculate the molar photon flux without dilution of the irradiated sample. If the absorbance of the irradiated sample is higher than 1, the ferrioxalate sample should be diluted after irradiation.
Once the effective molar photon flux and molar attenuation coefficients of the pure isomers are obtained, it is now possible to determine the photoisomerization quantum yield. Photoisomerization of 1 is carried out using the same irradiation setup as the actinometry experiment and monitored by UV-Vis spectroscopy. As the photochemical isomerization is reversible at the irradiation wavelengths, individual quantum yields for the forward and backward reactions are entangled in the overall reaction rate and cannot be determined directly. It is thus necessary to first calculate the pseudo quantum yield (Q) at the irradiation wavelength from which the individual quantum yields are extracted afterward. The pseudo quantum yield is defined by Eq (14), which allows the expression of the two linear dependent steps with a linear independent Eq (15) (Supplemental Information).
 (14)
(14)
 (15)
(15)
By using Eq (15), the pseudo quantum yield can be obtained from the observed total absorbance and irradiation time at which it is measured (Eq. (15) in the Supplemental Information). F(t), the so-called photokinetic factor, is a time-dependent variable that cannot be integrated directly when both 1–Z and 1–E absorb light at the irradiation wavelength. When the irradiation interval between time t1 and t2 is short, the integration of F(t) from time t1 to t2 is approximated to (t2 – t1) {F(t1) + F(t2)}/2 to give Eq (11) (step 5.7 and Eq. (27) in the Supplemental Information). The averaged values of the pseudo quantum yield calculated are 43.0 ± 4.6 M-1cm-1 at 436 nm and 405.6 ± 20.3 M-1cm-1 at 340 nm (Table 1).
 (11)
(11)
The numerical relation between ΦZ→E and ΦE→Z is obtained based on the isomeric ratio at PSS (Eq. (23) in the Supplemental Information) and, finally, the individual quantum yields can be determined by using Eq (12) and Eq (13) (step 5.9).
 (12)
(12)
 (13)
(13)
The estimated unidirectional photoisomerization quantum yields are ΦZ→E = 1.3 ± 0.1%, ΦE→Z = 0.6 ± 0.1% under 436 nm irradiation and ΦZ→E = 2.0 ± 0.1%, ΦE→Z = 4.6 ± 0.2% under 340 nm irradiation.
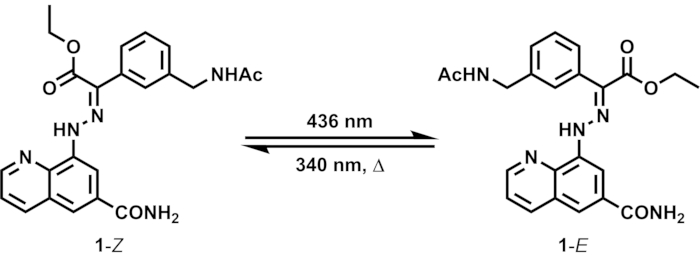
Figure 1: E/Z isomerization of hydrazone switch 1 induced by light and heat. The two isomers 1–Z and 1–E interconvert by photoirradiation at different wavelengths. Metastable 1–E can thermally relax to 1–Z. Please click here to view a larger version of this figure.
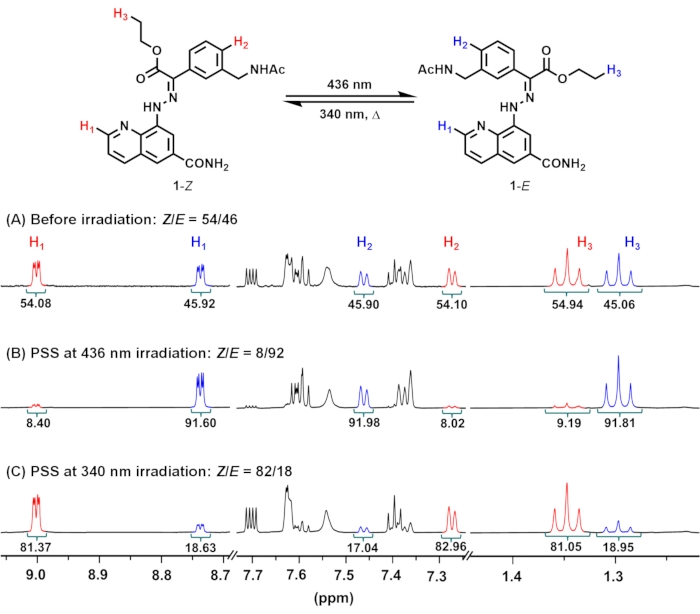
Figure 2: 1H NMR spectra of 1 (A) before and after irradiation at (B) 436 nm or (C) 340 nm to reach PSSs in DMSO-d6 at 298.15 K. PSS compositions at 436 and 340 nm consist of 8 and 82% of 1–Z, respectively. Abbreviation: PSSs = photostationary states. Please click here to view a larger version of this figure.
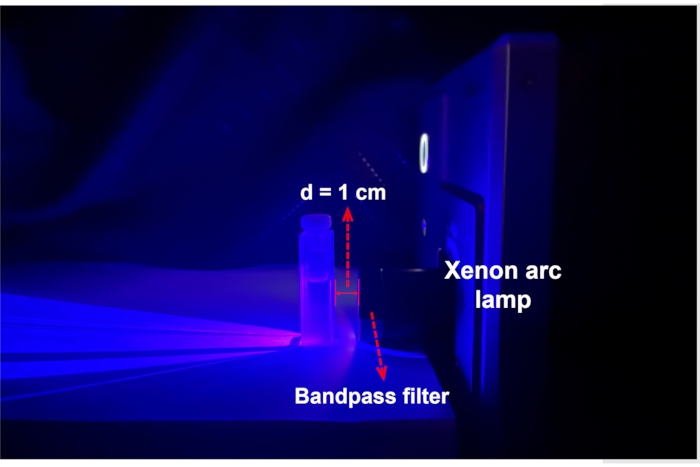
Figure 3: An experimental setup for photoisomerization and ferrioxalate actinometry. The sample solution in a cuvette is placed 1 cm in front of the Xe arc lamp equipped with a bandpass filter. Abbreviation: d = distance. Please click here to view a larger version of this figure.
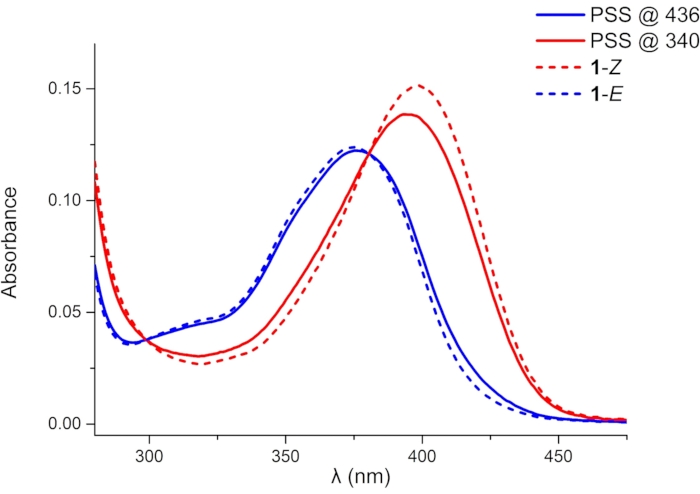
Figure 4: UV-Vis absorption spectra of 1 (1 × 10⁻⁵ M in DMSO). Blue and red solid lines indicate absorption spectra of 1 in PSSs under 436 and 340 nm irradiation, respectively. Blue and red dashed lines indicate deduced absorption spectra of pure 1–E and 1–Z, respectively. Abbreviation: PSSs = photostationary states. Please click here to view a larger version of this figure.
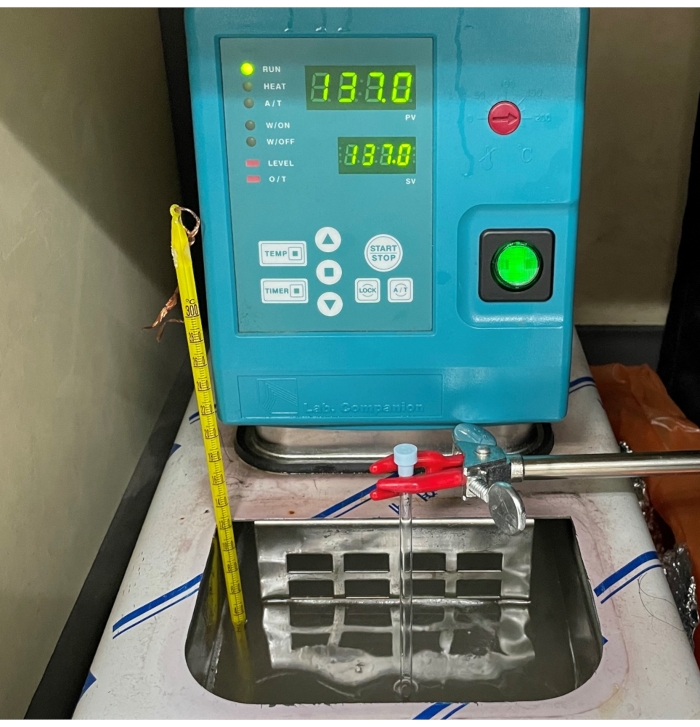
Figure 5: An experimental setup for monitoring the thermal relaxation process. A heating bath circulator is used to maintain the temperature constant during heating of the sample. Please click here to view a larger version of this figure.
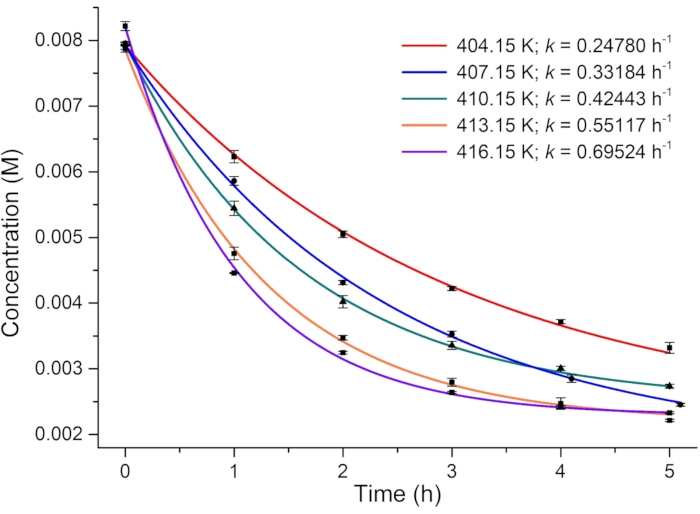
Figure 6: Plot of the concentration of 1-E versus heating time in DMSO-d6 at different temperatures. The rate constants of thermal relaxation at different temperatures are obtained from the plots. Please click here to view a larger version of this figure.
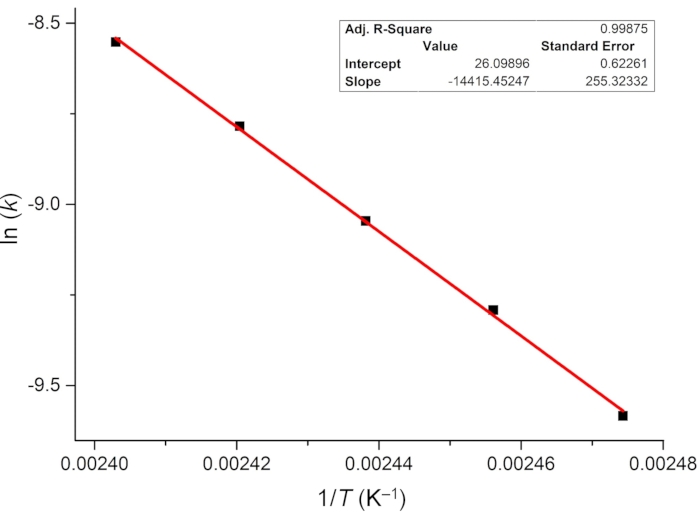
Figure 7: Arrhenius plot of the thermal E-to-Z isomerization of 1 in DMSO-d6. Extrapolation of the linear fit suggests that the thermal half-life of 1–E at room temperature is 101 ± 24 years. Abbreviations: k = the rate constant of thermal relaxation; T = temperature. Please click here to view a larger version of this figure.
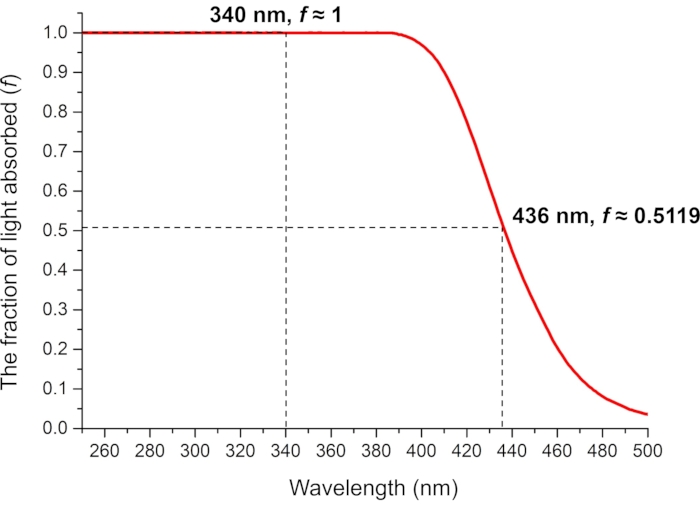
Figure 8: The fraction of absorbed light by 0.006 M ferrioxalate in 0.05 M aqueous H2SO4 solution. The measured fractions of absorbed light at the photoirradiation wavelengths are used in the ferrioxalate actinometry. Abbreviation: f = fraction of light absorbed. Please click here to view a larger version of this figure.
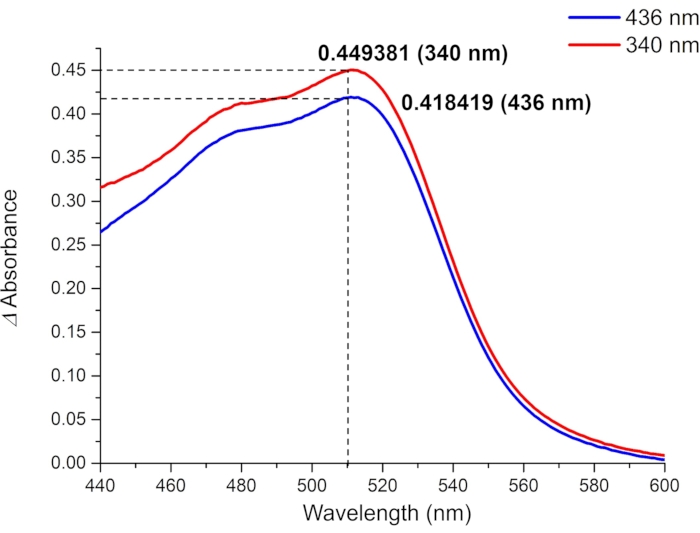
Figure 9: Absorbance differences between the irradiated (blue line: irradiated at 436 nm, red line: irradiated at 340 nm) and non-irradiated ferrioxalate samples. The absorbance difference at 510 nm (ΔA510) and the known value of molar attenuation coefficient of [Fe(phen)3]2+ complex (ε510 = 11100 M-1cm-1) are used to calculate the molar photon flux. Please click here to view a larger version of this figure.
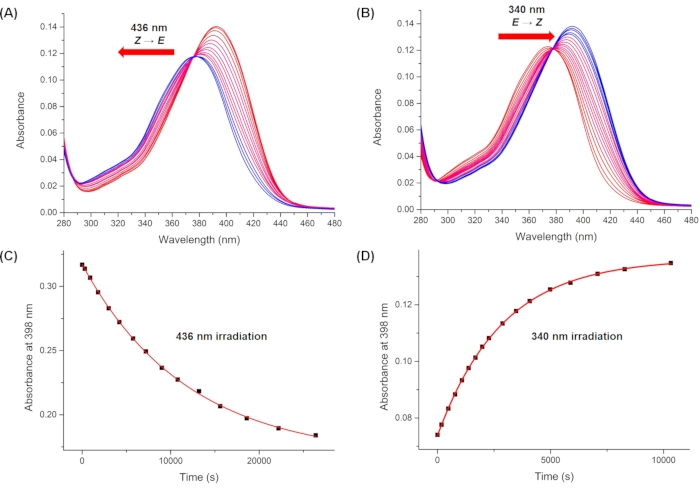
Figure 10: Monitored UV-Vis spectra upon irradiation. Irradiation with (A) 436 nm and (B) 340 nm irradiation. Plots of the absorbance at 398 nm (λmax of the pure 1-Z) during irradiation at (C) 436 nm and (D) 340 nm versus time. Averaged values of the pseudo quantum yield are obtained using the first ten data points in C and D. Please click here to view a larger version of this figure.
Table 1: Estimated pseudo quantum yields and unidirectional photoisomerization quantum yields under the irradiation wavelengths. Please click here to download this Table.
Supplemental Information: A user guide to choose an appropriate procedure for determining the photoisomerization quantum yield of a bistable switch and characterization of compound 1. Please click here to download this File.
Discussion
Various strategies to tune the spectral and switching properties of photoswitches have been developed, and the register of photoswitches is rapidly expanding28. It is thus crucial to correctly determine their photophysical properties, and we anticipate the methods summarized in this article will be a helpful guide to experimenters. Provided that the thermal relaxation rate is very slow at room temperature, measurement of PSS compositions at different irradiation wavelengths, molar attenuation coefficients of the pure isomers, effective molar photon flux, sand pseudo quantum yield allows the estimation of the unidirectional photoisomerization quantum yields. Experimental outcomes presented in this work revealed that photophysical properties of 1 are not significantly different from that of the unsubstituted parent molecule15. This result suggests that the amide linkage can be a useful tether to other molecules of interest for their structural modulation.
For the determination of the quantum yield, it is essential to use a proper integration method for the photokinetic factor (see Supplemental Information). Critical factors for choosing the integration method are: (1) whether both the isomers absorb light at the irradiation wavelength (photoreversibility)26, (2) whether the photoirradiation started with a pure isomer29,30, and (3) whether the absorption at the irradiation wavelength is much smaller than 0.1 or bigger than 227. In this work, photochemical isomerization of 1 is reversible at the irradiation wavelengths, and its photoswitching experiments start with isomeric mixtures. Absorption at the irradiation wavelengths is not sufficiently small (0.02366 at 436 nm and 0.06638 at 340 nm) to make an approximation of the photokinetic factor. In this case, integration of the photokinetic factor for a short irradiation interval is approximated by linear interpolation (case 2 in Supplemental Information). For those trying to determine the photoisomerization quantum yield of bistable photoswitches, the derivation of relevant equations in different circumstances is presented in Supplemental Information.
Of note is that the methods described in this article cannot be used for photoswitches with non-uniform photochemical processes (e.g., formation of a long-lived intermediate or multiple photoproducts) or with fast thermal relaxation processes31. Photochemical isomerization of 1 is a uniform process and does not have to take into account the thermal relaxation owing to its bistability. To precisely determine the PSS composition and the rate of thermal process of photoswitches with fast thermal relaxation, a special experimental setup for in situ irradiation during spectroscopic analysis is required (e.g., a UV-Vis spectrophotometer equipped with an additional light source for perpendicular irradiation, optical fiber that can be inserted into the NMR sample)32. It is also important to use a light source with a narrow bandwidth by using a bandpass filter or a laser for uniform energy excitation.
Disclosures
The authors have nothing to disclose.
Acknowledgements
This work was supported by the Chung-Ang University Research Grants in 2019 and the National Research Foundation of Korea (NRF-2020R1C1C1011134).
Materials
| 1,10-phenanthroline | Sigma-Aldrich | 131377-2.5G | |
| 340 nm bandpass filter, 25 mm diameter, 10 nm FWHM | Edmund Optics | #65-129 | |
| 436 nm bandpass filter, 25 mm diameter, 10 nm FWHM | Edmund Optics | #65-138 | |
| Anhydrous sodium acetate | Alfa aesar | A13184.30 | |
| Dimethyl sulfoxide | Samchun | D1138 | HPLC grade |
| Dimethyl sulfoxide-d6 | Sigma-Aldrich | 151874-25g | |
| Gemini 2000; 300 MHz NMR spectrometer | Varian | ||
| H2SO4 | Duksan | 235 | |
| Heating bath | JeioTech | CW-05G | |
| MestReNova 14.1.1 | Mestrelab Research S.L., https://mestrelab.com/ | ||
| Natural quartz NMR tube | Norell | S-5-200-QTZ-7 | |
| Potassium ferrioxalate trihydrate | Alfa aesar | 31124.06 | |
| Quartz absorption cell | Hellma | HE.110.QS10 | |
| UV-VIS spectrophotometer | Scinco | S-3100 | |
| Xenon arc lamp | Thorlabs | SLS205 | Fiber adapter was removed |
References
- Kathan, M., Hecht, S. Photoswitchable molecules as key ingredients to drive systems away from the global thermodynamic minimum. Chemical Society Reviews. 46, 5536-5550 (2017).
- Feringa, B. L., Browne, W. R. . Molecular Switches. 2nd ed. , (2011).
- Baroncini, M., Silvi, S., Credi, A. Photo- and redox-driven artificial molecular motors. Chemical Reviews. 120 (1), 200-268 (2020).
- Goulet-Hanssens, A., Eisenreich, F., Hecht, S. Enlightening materials with photoswitches. Advanced Materials. 32 (20), 1905966 (2020).
- Basílio, N., Pischel, U. Drug delivery by controlling a supramolecular host-guest assembly with a reversible photoswitch. Chemistry-A European Journal. 22 (43), 15208-15211 (2016).
- Wegener, M., Hansen, M. J., Driessen, A. J. M., Szymanski, W., Feringa, B. L. Photocontrol of antibacterial activity: shifting from UV to red light activation. Journal of the American Chemical Society. 139 (49), 17979-17986 (2017).
- Izquierdo-Serra, M., et al. Optical control of endogenous receptors and cellular excitability using targeted covalent photoswitches. Nature Communications. 7 (1), 12221 (2016).
- Mourot, A., et al. Rapid optical control of nociception with an ion-channel photoswitch. Nature Methods. 9 (4), 396-402 (2012).
- Griffiths, K., Halcovitch, N. R., Griffin, J. M. Long-term solar energy storage under ambient conditions in a MOF-based solid-solid phase-change material. Chemistry of Materials. 32 (23), 9925-9936 (2020).
- Sun, C. -. L., Wang, C., Boulatov, R. Applications of photoswitches in the storage of solar energy. ChemPhotoChem. 3 (6), 268-283 (2019).
- Gu, M., Zhang, Q., Lamon, S. Nanomaterials for optical data storage. Nature Reviews Materials. 1 (12), 16070 (2016).
- Roke, D., Wezenberg, S. J., Feringa, B. L. Molecular rotary motors: Unidirectional motion around double bonds. Proceedings of the National Academy of Sciences of the United States of America. 115 (38), 9423-9431 (2018).
- Stranius, K., Börjesson, K. Determining the photoisomerization quantum yield of photoswitchable molecules in solution and in the solid state. Scientific Reports. 7 (1), 41145 (2017).
- Schneider, W. E. Long term spectral irradiance measurements of a 1000-watt xenon arc lamp. NASA-CR. , 132533 (1974).
- Qian, H., Pramanik, S., Aprahamian, I. Photochromic hydrazone switches with extremely long thermal half-lives. Journal of the American Chemical Society. 139 (27), 9140-9143 (2017).
- Shao, B., et al. Solution and solid-state emission toggling of a photochromic hydrazone. Journal of the American Chemical Society. 140 (39), 12323-12327 (2018).
- Shao, B., Qian, H., Li, Q., Aprahamian, I. Structure property analysis of the solution and solid-state properties of bistable photochromic hydrazones. Journal of the American Chemical Society. 141 (20), 8364-8371 (2019).
- Moran, M. J., Magrini, M., Walba, D. M., Aprahamian, I. Driving a liquid crystal phase transition using a photochromic hydrazone. Journal of the American Chemical Society. 140 (42), 13623-13627 (2018).
- Guo, X., Shao, B., Zhou, S., Aprahamian, I., Chen, Z. Visualizing intracellular particles and precise control of drug release using an emissive hydrazone photochrome. Chemical Science. 11 (11), 3016-3021 (2020).
- Yang, S., et al. Dynamic enzymatic synthesis of γ-cyclodextrin using a photoremovable hydrazone template. Chem. 7 (8), 2190-2200 (2021).
- Yang, S., et al. Multistage reversible Tg photomodulation and hardening of hydrazone-containing polymers. Journal of the American Chemical Society. 143 (40), 16348-16353 (2021).
- Connors, K. A. . Chemical kinetics : the study of reaction rates in solution. , (1990).
- Shao, B., Qian, H., Li, Q., Aprahamian, I. Structure property analysis of the solution and solid-state properties of bistable photochromic hydrazones. Journal of the American Chemical Society. 141 (20), 8364-8371 (2019).
- Kuhn, H., Braslavsky, S., Schmidt, R. Chemical actinometry (IUPAC technical report). Pure and Applied Chemistry. 76 (12), 2105-2146 (2004).
- Murov, S. L., Carmichael, I., Hug, G. L. . Handbook of hotochemistry 2nd ed. Rev. And expanded. , (1993).
- Dürr, H., Bouas-Laurent, H. . Photochromism: Molecules and Systems. , (2003).
- Klán, P., Wirz, J. . Photochemistry of Organic Compounds: From Concepts to Practice. , (2009).
- Harris, J. D., Moran, M. J., Aprahamian, I. New molecular switch architectures. Proceedings of the National Academy of Sciences of the United States of America. 115 (38), 9414-9422 (2018).
- Maafi, M., Brown, R. G. The kinetic model for AB(1ϕ) systems: A closed-form integration of the differential equation with a variable photokinetic factor. Journal of Photochemistry and Photobiology A: Chemistry. 187, 319-324 (2007).
- Lahikainen, M., et al. Tunable photomechanics in diarylethene-driven liquid crystal network actuators. ACS Applied Materials & Interfaces. 12 (42), 47939-47947 (2020).
- Mallo, N., et al. Photochromic switching behaviour of donor-acceptor Stenhouse adducts in organic solvents. Chemical Communications. 52, 13576-13579 (2016).
- Feldmeier, C., Bartling, H., Riedle, E., Gschwind, R. M. LED based NMR illumination device for mechanistic studies on photochemical reactions – Versatile and simple, yet surprisingly powerful. Journal of Magnetic Resonance. 232, 39-44 (2013).

