Derivation, Expansion, Cryopreservation and Characterization of Brain Microvascular Endothelial Cells from Human Induced Pluripotent Stem Cells
Summary
This protocol details an adapted method to derive, expand, and cryopreserve brain microvascular endothelial cells obtained by differentiating human induced pluripotent stem cells, and to study blood brain barrier properties in an ex vivo model.
Abstract
Brain microvascular endothelial cells (BMECs) can be differentiated from human induced pluripotent stem cells (iPSCs) to develop ex vivo cellular models for studying blood-brain barrier (BBB) function. This modified protocol provides detailed steps to derive, expand, and cryopreserve BMECs from human iPSCs using a different donor and reagents than those reported in previous protocols. iPSCs are treated with essential 6 medium for 4 days, followed by 2 days of human endothelial serum-free culture medium supplemented with basic fibroblast growth factor, retinoic acid, and B27 supplement. At day 6, cells are sub-cultured onto a collagen/fibronectin matrix for 2 days. Immunocytochemistry is performed at day 8 for BMEC marker analysis using CLDN5, OCLN, TJP1, PECAM1, and SLC2A1. Western blotting is performed to confirm BMEC marker expression, and absence of SOX17, an endodermal marker. Angiogenic potential is demonstrated with a sprouting assay. Trans-endothelial electrical resistance (TEER) is measured using chopstick electrodes and voltohmmeter starting at day 7. Efflux transporter activity for ATP binding cassette subfamily B member 1 and ATP binding cassette subfamily C member 1 is measured using a multi-plate reader at day 8. Successful derivation of BMECs is confirmed by the presence of relevant cell markers, low levels of SOX17, angiogenic potential, transporter activity, and TEER values ~2000 Ω x cm2. BMECs are expanded until day 10 before passaging onto freshly coated collagen/fibronectin plates or cryopreserved. This protocol demonstrates that iPSC-derived BMECs can be expanded and passaged at least once. However, lower TEER values and poorer localization of BMEC markers was observed after cryopreservation. BMECs can be utilized in co-culture experiments with other cell types (neurons, glia, pericytes), in three-dimensional brain models (organ-chip and hydrogel), for vascularization of brain organoids, and for studying BBB dysfunction in neuropsychiatric disorders.
Introduction
Blood-Brain Barrier Function
The blood-brain barrier (BBB) forms a boundary that limits movement of substances from the blood to the brain. The BBB is comprised of brain microvascular endothelial cells (BMECs) that form a monolayer lining the vasculature. BMECs, together with astrocytes, neurons, pericytes, microglia, and extracellular matrix, form the neurovascular unit. BMECs have a tightly regulated paracellular structure that allows the BBB to maintain high trans-endothelial electrical resistance (TEER), which limits passive diffusion and serves as an indicator of barrier integrity1,2. BMECs also have proteins that assist with transcellular movement such as endocytosis, transcytosis, and transmigration, as well as extravasation of leukocytes during an immune response3. BMECs rely on influx and efflux transporters for nourishment and removal of waste products, in order to maintain a homeostatic balance in the brain3. For example, solute carrier family 2 member 1 (SLC2A1) is an influx transporter responsible for the movement of glucose across the BBB4, while efflux transporters such as the ATP binding cassette subfamily B member 1 (ABCB1) and the ATP binding cassette subfamily C member 1 (ABCC1) are responsible for returning substrates back into the blood stream3,5,6,7. ABCB1 substrates include morphine, verapamil4, and antipsychotics such as olanzapine and risperidone8, while the ABCC1 transporter has a variety of substrates including sulfate conjugates, vincristine, and glucuronide conjugates4.
Application of BBB Models in Psychiatric Disorders
BBB dysfunction has been implicated in a number of neurological and psychiatric disorders, including schizophrenia and bipolar disorder9,10. Recently, iPSC-derived ex vivo cellular models are being utilized to interrogate the cellular and molecular underpinnings of psychiatric disorders, but these models currently do not take into account the potential role played by the neurovasculature11,12,13. It is hypothesized that peripheral inflammatory cytokines circulating in the blood can adversely impact the BBB14,15,16,17, but there is also evidence for paracellular18,19,20,21,22, transcellular23,24,25,26,27,28,29, and extracellular matrix20,29,30,31,32 abnormalities contributing to BBB dysfunction. Disruption of the BBB can result in the contents of the blood entering the brain parenchyma and activating astrocytes and/or microglia to release proinflammatory cytokines, which in turn initiate an inflammatory response33 that can have detrimental effects on the brain34. BMECs are the primary component of the BBB and examining the structure and function of these cells can enhance the understanding of BBB dysfunction in neurological and psychiatric disorders.
Alternative BMEC Models
Prior to the development of efficient protocols for deriving BMECs from iPSCs1,6,35,36, researchers had employed immortalized BMECs37 to study BBB function. However, many of these models failed to attain desirable BBB phenotypes, such a physiological range of TEER values38,39. Utilizing iPSCs has the advantage of retaining the genetic background of the individual from which the cells are derived. Scientists are actively working on establishing iPSC-derived ex vivo microenvironment models that recapitulate the structure and function of the human brain. Researchers have developed methods to derive BMECs that are structurally and physiologically similar to BMECs found in vivo. Methods for obtaining purified populations of iPSC-derived BMECs require a number of different steps with protocols being optimized in the last few years1,6,35,36. Generally, iPSC-derived BMECs are cultured in Essential 6 (E6) medium for 4 days, followed by 2 days in human endothelial serum-free medium (hESFM) supplemented with basic fibroblast growth factor (bFGF), retinoic acid (RA), and B27 supplement. The cells are then cultured on a collagen IV (COL4) and fibronectin (FN) matrix to obtain >90% homogeneous BMECs1.
The identity of BMECs are confirmed by immunofluorescence showing the co-expression of BMEC proteins including platelet-endothelial cell adhesion molecule-1 (PECAM1), SLC2A1, and tight junction proteins such as tight junction protein 1 (TJP1), occludin (OCLN), and claudin-5 (CLDN5)6. Sprouting assays have been used to confirm the angiogenic potential of iPSC-derived BMECs.6 The BBB integrity of BMECs is evaluated by the presence of physiologic in vitro TEER values (~2000Ω x cm2)37 and measurable activity for efflux transporters such as ABCB1 and ABCC11,6,36. Recent methodological advances by the Lippmann group have led to iPSC-derived BMEC protocols with reduced experimental variability and enhanced reproducibility1. However, it is not known whether they can be expanded and passaged beyond the sub-culturing stage. Our modified protocol aims to address this issue by passaging iPSC-derived BMECs beyond day 8 and assessing whether they can be further expanded to retain BBB properties after cryopreservation. While no studies have described passaging of iPSC-derived BMECs, a protocol exists for BMEC cryopreservation that retains physiologic BBB properties after undergoing a freeze-thaw cycle40. However, it is not known post-cryopreservation BMECs can be passaged and retain BBB properties.
BMECs derived from iPSCs using the Lippmann protocol have been utilized to model BBB disruption in neurological disorders such as Huntington’s disease7. Such iPSC-derived BMECs have also been used to investigate the effects of bacterial infection such as Neisseria meningitidis or Group B Streptococcus on disruption of blood-CSF barrier and BBB respectively41,42. Also, using iPSC-derived BMECs from 22q deletion syndrome patients with schizophrenia, researchers observed an increase in intercellular adhesion molecule-1 (ICAM-1), a major adhesion molecule in BMECs that assist with recruitment and extravasation of leukocytes into the brain43. Taken together, these studies demonstrate the utility of iPSC-derived BMECs for studying BBB disruption in complex neuropsychiatric disorders.
Protocol
Human iPSCs were reprogrammed from the fibroblasts of healthy donors using a protocol approved by the Institutional Review Boards of Massachusetts General Hospital and McLean Hospital, and characterized as described in previous studies44,45,46.
NOTE: Briefly, fibroblasts were reprogrammed to iPSC via mRNA-based genetic reprogramming47. The iPSCs were maintained in stem cell medium (SCM) (see material list) and stored at a density of ~1.2 x 10² cells/mL with 1 mL of SCM, 10 μM with rho-associated protein kinase inhibitor (ROCKi) Y-27632, and 10% (v/v) dimethyl sulfide (DMSO), in cryopreserved vials in liquid nitrogen at -160 °C. All of the following procedures below are carried out in a biosafety cabinet unless stated otherwise.
1. Basement membrane matrix dilution and plate coating
- Dilute (1:50) growth factor reduced basement membrane matrix purified from Engelbreth-Holm-Swarm tumor in Dulbecco's Modified Eagle Medium (DMEM) without phenol red.
- Coat cell culture plates with the appropriate amount of diluted basement membrane matrix (i.e., 6-well plate = 1mL, 12-well plate = 0.5 mL) and incubate these plates at 37 °C for at least 1 hour.
2. iPSC maintenance
NOTE: The maximum confluency per well in a 6-well flat-bottom plate is ~1.2 x 10⁶ cells.
- Thaw cryopreserved iPSCs into SCM with 10 μM Y-27632 and plate onto a 6-well plate coated with diluted growth factor reduced basement membrane matrix.
- Maintain iPSCs in SCM with 10 μM Y-27632 for the first 24 hours after thawing. Switch to fresh medium after 24 hours.
- Maintain iPSCs in SCM until cells reach 80-90% confluency before passaging.
- Calculate how many iPSCs will be needed for differentiation by multiplying desired density for differentiation (15,600 cells/cm2) by the surface area of the well. For a 6-well flat-bottom plate, multiply 15,600 cells/cm2 by 9.6 cm2 for a total of 149,760 cells/well.
- To passage, wash the cells with Hanks’ Balanced Salt Solution (HBBS). Then, incubate the cells with non-enzymatic ethylenediaminetetraacetic acid (EDTA) (see material list) for 5 minutes at 37 °C.
- Use a cell scraper to gently lift off the cells. Collect cells in fresh SCM.
- Plate cells onto cell culture plates coated with diluted SCM and maintain cells as described in step 2.3 or store them at ~1.2 x 10⁶ cells/mL in 1 mL of SCM, 10 μM Y-27632, and 10% DMSO (v/v) in cryopreserved vials in liquid nitrogen at temperature of -160 °C.
3. Differentiation of iPSCs to BMECs
NOTE: Non-enzymatic EDTA separates cells into clumps. Enzymatic EDTA (see Table of Materials) separates cells into single cell suspension. Retinoic acid (RA) should be protected from light.
- Wash iPSCs once with Dulbecco’s Phosphate Buffer Saline (DPBS). Incubate with enzymatic EDTA (1 mL for 6-well plate, 0.5 mL for 12-well plate, and 0.25 mL for 24-well plate) for approximately 5 minutes at 37 °C to yield a single cell suspension.
- Collect cells and centrifuge at 300 x g (relative centrifugal force) for 5 minutes at room temperature. Resuspend cell pellets in SCM containing 10 μM Y-27632.
- Determine cell density using Trypan Blue and automated cell counter or a hemocytometer device. Plate cells at a density of 15,600 cells/cm2 or 149,760 cells/well of a 6-well flat-bottom plate (with a surface area of 9.6 cm2/well) in SCM containing 10 μM Y-27632 for 24 hours.
- Initiate differentiation after 24 hours by changing SCM to E6 medium. Change E6 medium daily for the next 4 days.
- On day 4 of differentiation, replace E6 medium with hESFM supplemented with diluted (1:200) B27 supplement, 20 ng/mL bFGF, and 10 μM RA. Do not change this medium for the next 48 hours.
- Prepare 200 mL of hESFM with diluted (1:200) B27, mix 1 mL of 50x concentrated B27 supplement to 199 mL of hESFM.
- Prepare 20 ng/mL of bFGF by reconstituting 50 μg of bFGF in 250 μL of Tris buffer (5 mM Tris, pH 7.6, 150 mM NaCl) to make 200 μg/mL stock solution. Prepare 200 mL of hESFM containing 20 ng/mL bFGF by mixing 20 μL of 200 μg/mL bFGF with 200 mL of hESFM.
- Prepare 10 μM RA by first making a 40 mg/mL of RA stock solution by adding 2.5 mL of DMSO to 100 mg of RA powder. Dilute this concentration to 3 mg/mL to make 10 mM stock solution. Prepare 200 mL of hESFM containing 10 μM RA by mixing 200 μL of 10μM RA in 200 mL hESFM.
4. Coating collagen IV (COL4) and fibronectin (FN) Matrix for Purification of iPSC-Derived BMEC
- Add 2 mL of sterile water to 2 mg of FN to make 1 mg/mL FN stock solution. Add 5 mL of sterile water to 5 mg of COL4 to make a 1 mg/mL COL4 stock solution.
- Allow FN to dissolve for at least 30 minutes at 37 °C and the COL4 to dissolve at room temperature.
- Dilute FN stock solution in sterile water to a final concentration of 100 μg/mL and COL4 stock solution to a final concentration of 400 μg/mL.
- Coat the desired plates (6-well plate = 1 mL of COL4/FN solution, 12-well plate = 0.5 mL, 24-well plate= 0.25 mL, and 12-transwell filtered plate = 0.25 mL) with the mixture of 400 μg/mL COL4 and 100 μg/mL FN.
- Incubate plates for a minimum of 2 hours or overnight at 37 °C; for Transwell filtered plates, a minimum of 4 hours is recommended.
5. Sub-culture and purification of iPSC-Derived BMECs
NOTE: Incubation with enzymatic EDTA may take longer than 15 minutes depending on the confluency of the cells on day 6 of differentiation.
- On day 6 of differentiation, wash cells twice with DPBS. Incubate with 1 mL of enzymatic EDTA for at least 15 minutes at 37 °C until a single cell suspension is obtained.
- Collect cells via centrifugation at 300 x g for 5 minutes at room temperature. Resuspend cell pellets with fresh hESFM with diluted (1:200) B27 supplement, 20 ng/mL bFGF, and 10 μM RA.
- Seed cells onto plates coated with a mixture of 400 μg/mL COL4 and 100 μg/mL FN. Seed cells using a ratio of 1 well of a 6-well plate to 3 wells of a 12-well plate, 3 wells of a 12-transwell filtered plate, or 6 wells of a 24-well plate.
- Seed undifferentiated iPSCs from the same cell line onto COL4/FN coated 12-transwell filtered plate as negative control for TEER analysis.
- After 24 hours of sub-culturing, change medium to hESFM with B27 supplement only. No medium changes are needed after this step.
6. Sprouting assay
- Collect Day 8 iPSC-derived BMECs and seed them at 100,000 cells/well onto a 24-well flat-bottom plate freshly coated with 200 μL/cm2 of basement membrane matrix.
- Treat these cells with hESFM with diluted (1:200) B27 and 40 ng/mL of vascular endothelial growth factor A (VEGFA165).
- Observe cells every 24 hours and change the medium every two days.
7. Immunocytochemistry (ICC)
NOTE: ICC is carried out on 24-well flat-bottom plates.
- After 48 hours of sub-culturing (day 8), wash cells twice with DPBS. Fix cells with 4% paraformaldehyde (PFA) for 20 minutes.
- Wash cells three times with DPBS, 5 minutes per wash. Pre-block cells for 1 hour at room temperature in DPBS with 5% donkey serum and 0.3% Triton X-100 (v/v).
- Incubate with primary antibodies: mouse anti-human-PECAM1 (1:100, stock 0.5 mg/mL), rabbit anti-human-TJP1 (1:200, stock 0.53 mg/mL), mouse anti-human-CLDN5 (1:200, stock 0.5 mg/mL), mouse anti-human-OCLN (1:200, stock 0.5 mg/mL), and rabbit anti-human-SLC2A1(1:100, stock 0.2 mg/mL) in DPBS containing 5% donkey serum overnight at 4°C.
- Rinse cells once with DPBS and then wash five times for 5 minutes per wash with DPBS.
- Incubate cells with secondary antibodies: donkey-anti-rabbit Alexa Fluor 555 (1:200) and donkey-anti-mouse 488 (1:200) in DPBS containing 5% donkey serum for 1 hour.
- Following this incubation, add Hoechst 33342 trihydrochloride trihydrate diluted (1:1000) in DPBS for 10 minutes.
- Remove Hoechst 33342 solution and rinse once with DPBS and wash four times with DPBS for 5 minutes per wash.
- Visualize cells on fluorescence microscopes to look for expression and localization of cell makers.
8. TEER Measurement and Analysis
NOTE: Corning 12-Transwell filtered plates are equipped with filters consisting of 1.12 cm2 polyethylene terephthalate membranes and 0.4 micrometer pores. TEER measurements are obtained in technical (3 per well) and biological replicates (3 wells per cell line and/or condition).
- 24 hours after sub-culturing (day 7), measure TEER using chopstick electrodes and a voltohmmeter every 24 hours. Refer to voltohmmeter user manual for specific instructions on obtaining measurements.
- To measure TEER, charge the voltohmmeter instrument the night before. Lightly wipe the instrument and chopstick electrodes with 70% ethanol before placing them in the safety hood.
- Switch the power on and calibrate the ohm meter as recommended by the manufacturer.
- Plug in the chopstick electrodes and rinse electrodes with 70% ethanol followed by DPBS.
- Place the shorter end electrode into the trans-well insert (the apical chamber) and the longer end into the basolateral chamber.
- First measure a blank well that is coated with COL4/FN only. Then measure the other wells.
- Quickly rinse chopstick electrodes with 70% ethanol followed by DPBS when measuring different conditions (i.e. measuring different cell lines).
- After all measurements (in Ω) have been recorded, rinse chopstick electrodes with 70% ethanol and then sterile water. Gently wipe electrode and let it air dry in the safety hood.
- Average the triplicate TEER values (in Ω) from the blank well and subtract this average value from each raw TEER value by condition.
- Average the subtracted values and multiply them by 1.12 cm2 (the surface area of the 12-transwell insert).
- Use transformed values from step 6 to generate the graph showing TEER value and standard errors for each day of TEER measurement.
9. Efflux Transporter Activity and Analysis
NOTE: Efflux transporter activity assay is performed on a 24-well flat-bottom plate. Efflux transporters of interest include ABCB1 and ABCC1. It is recommended that each condition should be performed in triplicate with control wells (i.e. blank wells without the respective inhibitors).
- After 48 hours of sub-culturing (day 8), incubate cells with 10 μM Valspodar (ABCB1 inhibitor) or 10 μM MK571 (ABCC1 inhibitor) for 1 hour at 37 °C.
- Prepare 10 mM Valspodar stock by dissolving 5 mg of powder (1214.64 g/mol) in 412 μL of DMSO and dilute to working concentration of 10 μM. For example, to make 10 mL of hESFM with 10 μM Valspodar, mix 10 μL of 10 mM Valspodar stock with 10 mL of hESFM.
- Prepare 10 mM MK571 stock by dissolving 5 mg powder (537.07 g/mol) in 931 μL and dilute to working concentration of 10 μM. For example, to make 10 mL of hESFM with 10 μM MK571, mix 10 μL of 10 mM MK571 stock with 10 mL of hESFM.
- After 1 hour, incubate cells with 10 μM rhodamine 123 (ABCB1 substrate) or 10 μM 2',7'-dichlorodihydrofluorescein diacetate (H2DCFDA, ABCC1 substrate) with or without their respective inhibitors for 1 hour at 37 °C.
- Prepare 10 mM rhodamine 123 by dissolving 10 mg of powder (380.82 g/mol) in 875 μL of DMSO and dilute to working concentration of 10 μM. For example, to make 10 mL of hESFM with 10 μM rhodamine 123, mix 10 μL of 10 mM rhodamine 123 stock with 10 mL of hESFM.
- Prepare 10 mM H2DCFDA by dissolving 50 mg of powder (487.29 g/mol) in 10.26 mL of DMSO and dilute to working concentration of 10 μM. For example, to make 10 mL of hESFM with 10 μM rhodamine 123, mix 10 μL of 10 mM rhodamine 123 stock with 10 mL of hESFM.
- Wash cells twice with 0.5 mL of DPBS and lyse using DPBS containing 5% Triton-X (v/v).
- Measure fluorescence of the lysed cells using a multi-plate or microplate reader (see material list).
- Set fluorescent plate reader instrument to 485 nanometer excitation and 530 nanometer emission and measure fluorescence at these wavelengths.
- For wells not used in the transporter assay, wash cells twice with DPBS before fixing them with 4% PFA for cell nuclei quantification.
- Incubate cells with Hoechst 33342 trihydrochloride trihydrate diluted (1:1000) in DPBS for 10 minutes. Image multiple visual fields in each well to calculate average cell nuclei counts using fluorescence microscopes.
- Count nuclei using Fiji and normalize fluorescence values on a per-cell basis to these counts.
- Calculate average accumulation of fluorescence by subtracting raw fluorescence accumulation value for each condition from its respective blank value.
- Average subtracted values for each condition.
- Divide average values from step 9.6.1 by the average cell counts. Use these values to normalize fluorescence values on a per-cell basis.
- Use normalized values to generate a graphical representation for each inhibitor condition and perform any necessary statistical analysis.
10. Passaging, Expanding, and Cryopreserving BMECs
- Replenish day 8 BMEC cultures with fresh hESFM supplemented with diluted (1:200) B27 and allow cells to expand for two more days on the COL4/FN matrix.
- Coat a new 12-Transwell filtered plate and a 24-well flat-bottom plate with 400 μg/mL COL4 and 100 μg/mL FN and incubate for 4 hours.
- On day 10, wash cells with DPBS and incubate with 1 mL of enzymatic EDTA for at least 15 minutes at 37°C until a single cell suspension is obtained.
- Collect cells via centrifugation at 300 x g for 5 minutes at room temperature.
- To cryopreserve these cells, resuspend cell pellets with fresh hESFM with 30% Fetal Bovine Serum (FBS) and 10% DMSO.
- Store iPSC-derived BMECs in cryopreserved vials in an isopropanol container for the first 24 hours at -80 °C, then place in liquid nitrogen for long-term storage at -160 °C.
- To passage these cells, resuspend cell pellets with fresh hESFM supplemented with diluted (1:200) B27.
- Seed cells onto coated plates prepared in Step 10.2. Seed cells using a ratio of 1 well of a 6-well plate to 3 wells of a 12-transwell filtered plate and to 6 wells of a 24-well plate. Allow cells to grow and expand for 24 hours.
- On day 11, measure TEER by following steps listed in Step 8.
- On day 12, perform ICC by following steps listed in Step 9.
- To thaw cryopreserved BMECs, place the cryopreserved vials in a warm water or bead bath at 37oC. Then transfer the thawed BMECs to 5 mL of hESFM supplemented with diluted (1:200) B27.
- Collect cells via centrifugation at 300 x g for 5 minutes at room temperature. Resuspend the cells in hESFM supplemented with diluted (1:200) B27, 10 μM RA and 10 μM Y-27632.
- After 24 hours, switch medium to hESFM supplemented with diluted (1:200) B27 and 10 μM Y-27632 without RA.
Representative Results
BMEC Differentiation
A few critical steps in this protocol should be followed precisely (Figure 1). E6 medium use on day 1 is important, since it is often used for deriving neuroectoderm lineage from iPSCs within a relatively short period of time yielding reproducible results across multiple cell lines36. Another important step is on day 4 of differentiation, where E6 medium should be switched to hESFM with diluted (1:200) B27, 20 ng/mL bFGF and 10 μM RA to expand iPSC-derived BMECs. The addition of B27 supplement is used as an alternative to bovine serum to support serum-free cell culturing1, bFGF is added to facilitate growth of iPSC-derived BMECs6, and RA is used to facilitate the development of the BBB phenotype35. The last important step involves the purification stage, where day 6 iPSC-derived BMECs are sub-cultured onto a COL4/FN coated plate to select iPSC-derived BMECs1,6,35,36. Figure 2 demonstrates the morphological transition from iPSCs to BMECs. After one day of E6 medium (day 1), cellular morphology is similar to that of iPSCs. By day 4 of E6, cells begin to appear visibly distinct from iPSCs and cover most of the well (~90% confluency). By day 6, while cultured in hESFM with diluted (1:200) B27, 20 ng/mL bFGF and 10 μM RA, cellular morphology begins to have an elongated and cobblestone appearance. At day 8, each individual cell is distinct in a large cobblestone pattern. A sprouting assay was performed to demonstrate the angiogenic potential of iPSC-derived BMECs, which resulted in tube-like structures after 3 days of VEGFA165 treatment (Figure 3).
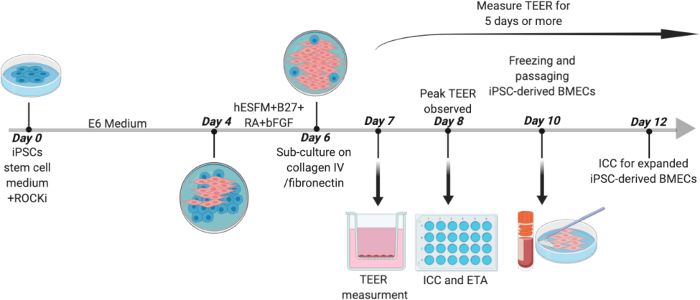
Figure 1: Outline for Differentiation of Human iPSCs to BMECs. Human iPSCs were initially cultured in stem cell medium containing 10 μM Y-27632 for 24 hours before changing medium to E6 for 4 days. On day 4, medium was changed to hESFM with (1:200) B27 supplement, 20 ng/mL bFGF, and 10 μM RA for 2 days. On day 6, cells were sub-cultured onto COL4/FN coated plates. On day 7, medium was changed to hESFM with B27 supplement without bFGF and RA and TEER was measured. On day 8, ICC and efflux transporter activity assays were performed. iPSC-derived BMECs were expanded until day 10 before being passaged to a trans well plate or a 24-well flat bottom plate for TEER measurement and ICC analysis, respectively. Day 8 BMECs were used for the sprouting assay (not depicted). 2 wells of a 6-well plate of iPSC-derived BMECs were collected and stored in hESFM with 10% DMSO and 30% FBS at -80 °C and then in liquid nitrogen for long-term storage at -160oC. On day 12, a peak in TEER value was observed in expanded iPSC-derived BMECs at which point ICC was performed. Please click here to view a larger version of this figure.
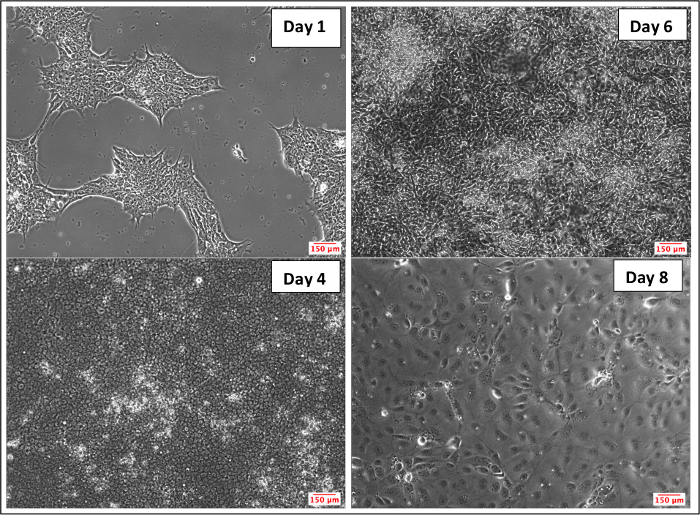
Figure 2: Bright-field Images Depicting Differentiation of iPSCs to BMECs. After one day of culture in E6 medium, iPSCs retain their characteristic morphology. On day 4 in E6 medium, cellular morphology appears distinctly different from iPSCs. On day 6, cellular morphology changes to an elongated and cobblestone appearance. By day 8, cells appear large and with a cobblestone pattern. Please click here to view a larger version of this figure.
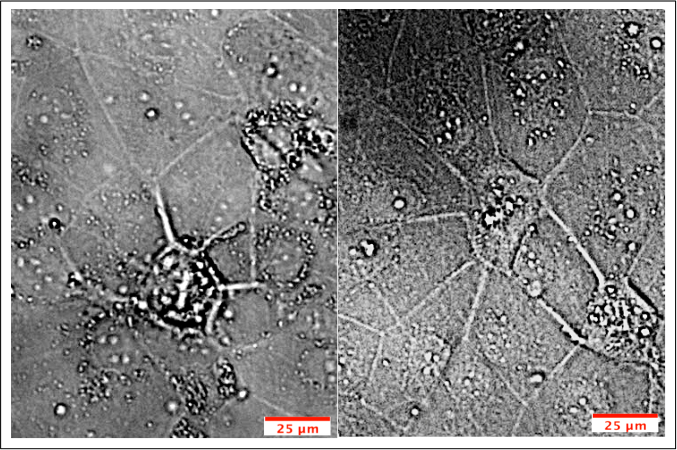
Figure 3: Angiogenic Potential of iPSC-derived BMECs. Purified iPSC-derived BMECs were seeded at 100,000 cell/cm2 onto basement membrane matrix in hESFM with (1:200) B27 supplement and 40ng/mL VEGFA165. Tube-like structures appeared after 3 days of VEGFA165 treatment. Please click here to view a larger version of this figure.
Purified iPSC-derived BMECs were seeded at 100,000 cell/cm2 onto basement membrane matrix in hESFM with (1:200) B27 supplement and 40ng/mL VEGFA165. Tube-like structures appeared after 3 days of VEGFA165 treatment.
BMEC characterization was performed using immunocytochemistry for cell-specific markers. iPSC-derived BMECs were assessed for the presence of tight junction proteins (OCLN, TJP1, and CLDN5), which are commonly expressed in the tight junctions of brain endothelial cells3 and endothelial cells in the lung, liver, and kidney18. Other markers such as PECAM1 and SLC2A1, have been previously used as markers for purified BMECs6. PECAM13 and SLC2A4 are both expressed in vascular endothelial cells of the BBB. The iPSC-derived BMECs generated using this protocol co-expressed all five of these markers (Figure 4).

Figure 4: Marker Analysis of iPSC-Derived BMECs. Human iPSC-derived BMECs were stained for tight junction (OCLN, TJP1, CLDN5), influx transporter (SLC2A1), and adherens junction (PECAM1) proteins. OCLN, TJP1, and CLDN5 proteins are primarily localized in the cell membrane. SLC2A1 and PECAM1 are localized in both the nuclei and cell membrane. Hoechst 33342 trihydrochloride trihydrate was used for nuclear staining. Please click here to view a larger version of this figure.
To characterize BBB function of BMECs, TEER was measured 24 hours (day 7) after sub-culturing and the medium was changed to hESFM with diluted (1:200) B27 without bFGF and RA. TEER measurements were obtained starting at day 7 of differentiation (day 0 of TEER measurement) and peaked at ~2000 Ω x cm2 on day 8 or 48 hours after sub-culturing BMECs (Figure 5). These TEER values are within the range described for co-cultured iPSC-derived BMECs with rat primary astrocytes37. The iPSC line did not have any discernable BBB function according to their low TEER values.
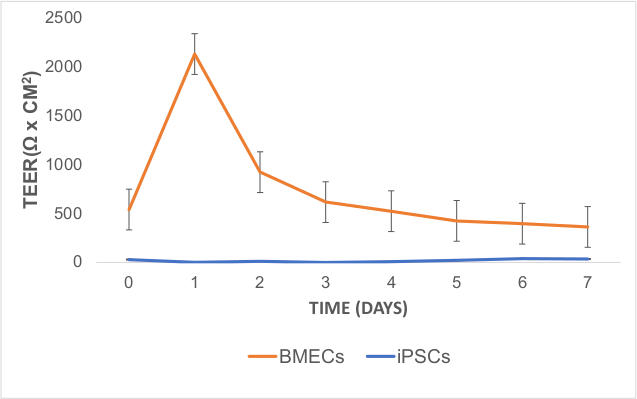
Figure 5: TEER Measurements in iPSC-Derived BMECs. TEER values peaked after one day of sub-culturing on COL4/FN matrix (on day 8 of differentiation). TEER measurements were obtained in technical (3 measures per well) and biological replicates (3 wells per cell line). The technical average value from a blank well was subtracted from raw TEER values. These values were averaged for each day and multiplied by 1.12 cm2 (surface area of the 12-transwell insert). Error bars represent standard error. Please click here to view a larger version of this figure.
To evaluate ABCB1 and ABCC1 efflux transporter activity, the amount of fluorescent substrate taken up for ABCB1 and ABCC1 were quantified following incubation with their respective inhibitors. As expected, inhibition of ABCB1 and ABCC1 efflux transporters with PSC833 (ABCB1 inhibitor) or MK-571 (ABCC1 inhibitor) led to an increase in rhodamine 123 (R123) or 2’,7’-dichlorodihydrofluorescein diacetate (H2DCFDA), respectively (Figure 6). This evidence suggests that BMECs derived using this protocol have efflux transporter activity.
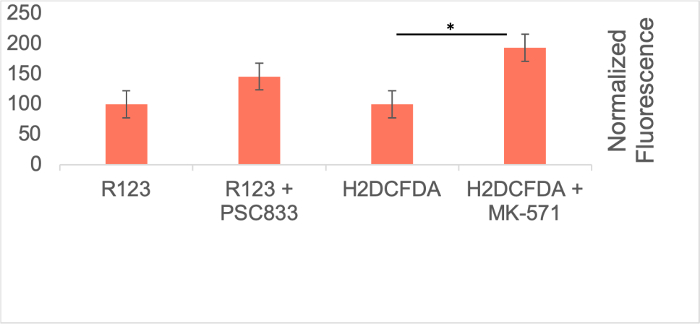
Figure 6: Efflux Transporter Activity in iPSC-Derived BMECs. Efflux transporter activity in BMECs was determined by quantifying the accumulation of rhodamine 123 (R123) or 2',7'-dichlorodihydrofluorescein diacetate (H2DCFDA) in the presence or absence of PSC833 (ATP binding cassette subfamily B member 1 (ABCB1) inhibitor) or MK-571 (ATP binding cassette subfamily C member 1 (ABCC1) inhibitor). Technical triplicates were performed for each condition (N=1). Fluorescence values from the control condition (i.e. without inhibitors) were deducted from raw fluorescence values. These fluorescence accumulation was normalized on a per-cell basis for each technical replicate. Statistical significance was determined using student t-test from the three technical replicates. No statistical significance was observed between the accumulation of R123 with and without ABCB1 inhibitor (t-stat= -1.66, p=0.11). Statistical significance was observed between the accumulation of H2DCFDA with and without ABCC1 inhibitor (t-stat=-7.23, p=0.04). *p<0.05. Error bars represent standard error. Please click here to view a larger version of this figure.
Passaging, Expanding and Cryopreserving iPSC-Derived BMECs
Another aim was to investigate whether iPSC-derived BMECs could be passaged and cryopreserved after sub-culturing. For this purpose, day 7 iPSC-derived BMECs were allowed to expand until day 10 before passaging them onto newly coated COL4/FN 12-transwell filtered plates for TEER measurement and 24-well flat-bottom plate for ICC analysis (Figure 7). Using this condition iPSC-derived BMECs continued to proliferate, maintained the expression of OCLN, TJP1, CLDN5, SCL2A1, and PECAM1 (Figure 8), and continued to sustain proper TEER values (peak at~2000 Ω x cm2) after passaging (Figure 9). Cryopreserved BMECs were later thawed, expanded, and then passaged (Figure 7). TEER measurements of BMECs were obtained 24 hours after thawing and several more days after that. TEER measurements of these post-thawed BMECs were reduced (peaking at only 800 Ω x cm2) when compared to freshly derived BMECs. A second passaging of post thawed BMECs exhibited even lower TEER values (peaking at only 200-300 Ω x cm2) (Figure 9) and showed frayed and/or freckled patterns of the tight junction formation (Figure 10). Western blot analysis48 revealed that iPSCs primarily expressed an endodermal marker (SOX17)49 and some tight junction markers (OCLN), but not other BMEC related markers (TJP1, CLDN5, and SLC2A1) (Figure 11). BMECs primarily expressed endothelial related markers (TJP1, CLDN5, OCLN and SLC2A1), with low levels of the endodermal marker, SOX17.
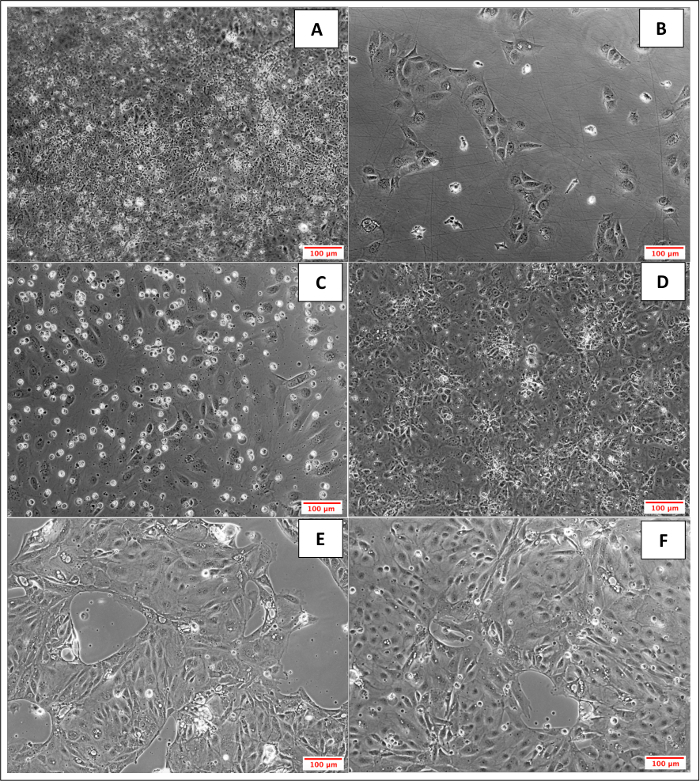
Figure 7: Bright Field Images of Expanded and Cryopreserved iPSC-derived BMECs. A) Day 10 (4 day after initial sub-culture) cells reached maximum confluency. B) Day 11, 24 hours after passaging onto COL4/FN coated 24-wells plate. C) Day12, 48 hours after passaging onto COL4/FN coated 24-wells plate; peak TEER values was observed and ICC was performed. D) 48 hours post-thawed iPSC-derived BMECs on COL4/FN coated 6-wells plate; cells were previously cryopreserved at 1.2 x 10² cells/mL. E) 24 hours after post-thawed iPSC-derived BMECs were passaged onto COL4/FN coated 6-wells plate. F) 48 hours after post-thawed iPSC-derived BMECs were passaged. Please click here to view a larger version of this figure.
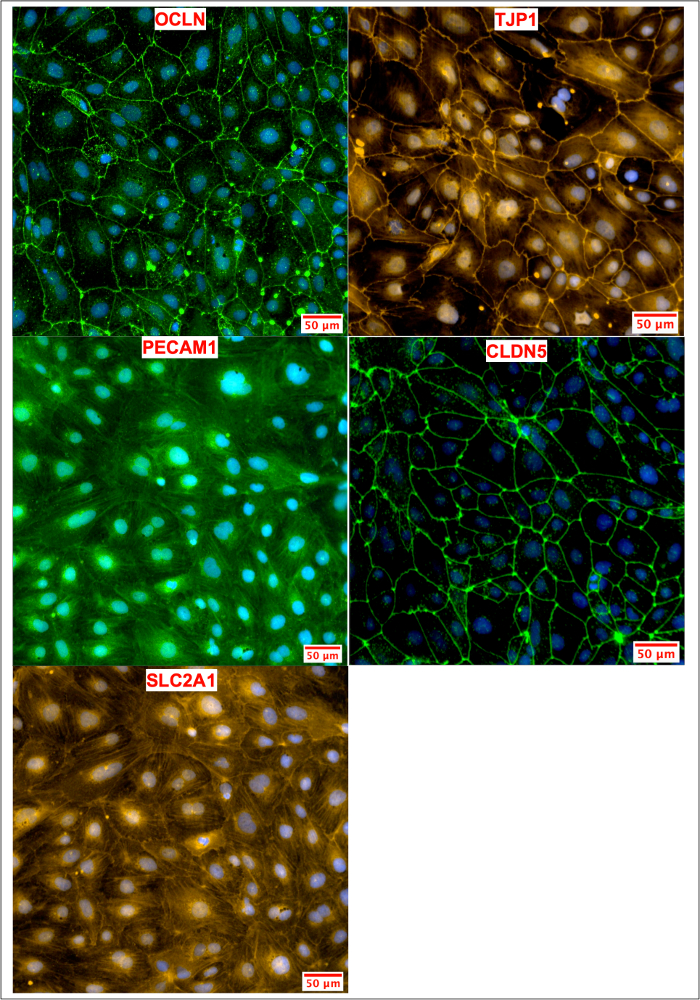
Figure 8: ICC of iPSC-Derived BMECs after Passaging. BMECs were passaged and maintained on COL4/FN matrix until day 12, when TEER values peaked. BMECs on day 12 were stained for tight junction (OCLN, TJP1, CLDN5), influx transporter (SLC2A1) and adherens junction (PECAM1) proteins. The expression pattern and localization resemble those observed in conditions where passaging was not performed, as shown in Figure 4. Please click here to view a larger version of this figure.
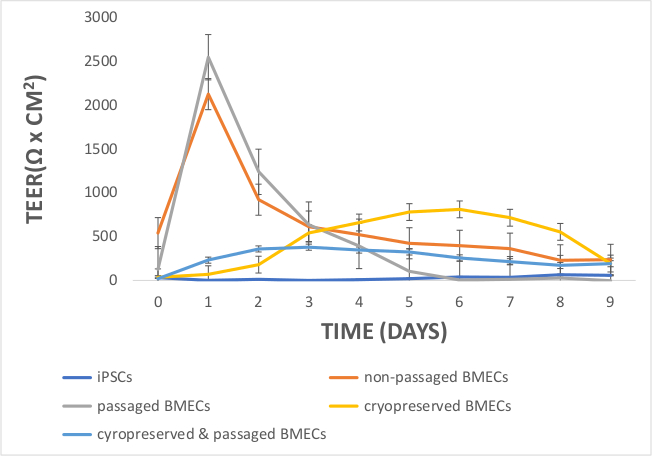
Figure 9: Comparing TEER Measurements in iPSCs, non-passaged BMECs, passaged BMECs, cryopreserved BMECs, and cryopreserved & passaged BMECs. On day 1, TEER values peaked for non-passaged and passaged BMECs, but not iPSCs or cryopreserved BMECs. Cryopreserved BMECs had moderate TEER values between day 3 and 7, with even lower TEER values for the cryopreserved & passaged BMECs. iPSCs did not demonstrate any measurable TEER values between day 0 and 9. TEER measurements were obtained in technical (3 measurements per well) and biological replicates (3 per cell line). The technical average value from a blank well was subtracted from the raw TEER values. These values were averaged for each day and multiplied by 1.12 cm2 (surface area of the 12-transwell insert). Error bars represent standard error. Please click here to view a larger version of this figure.
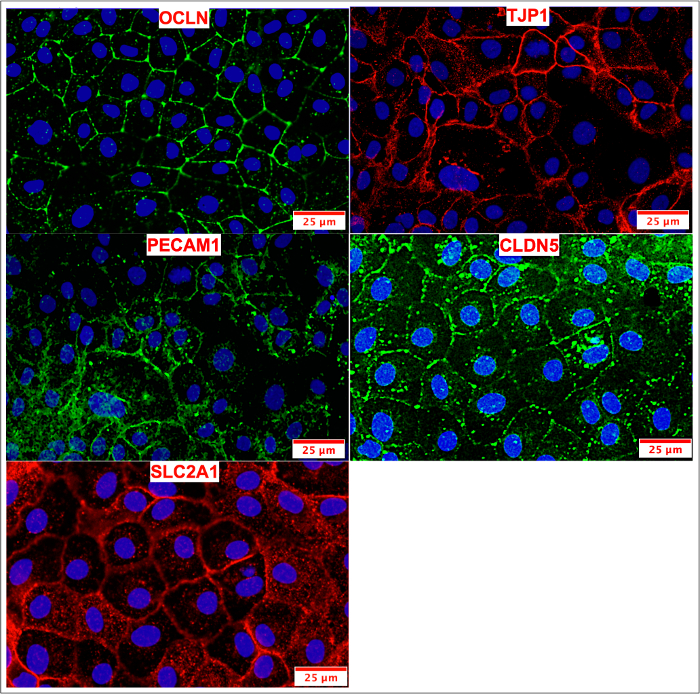
Figure 10: ICC of cryopreserved & passaged BMECs. BMECs were passaged and maintained on COL4/FN until peak TEER values were observed. BMECs were stained for tight junction (OCLN, TJP1, CLDN5), influx transporter (SLC2A1) and adherens junction (PECAM1) proteins. The expression pattern of tight junction markers appeared frayed and/or freckled when compared to non-passaged BMECs (Figure 4) and passaged BMECs (Figure 8). Please click here to view a larger version of this figure.
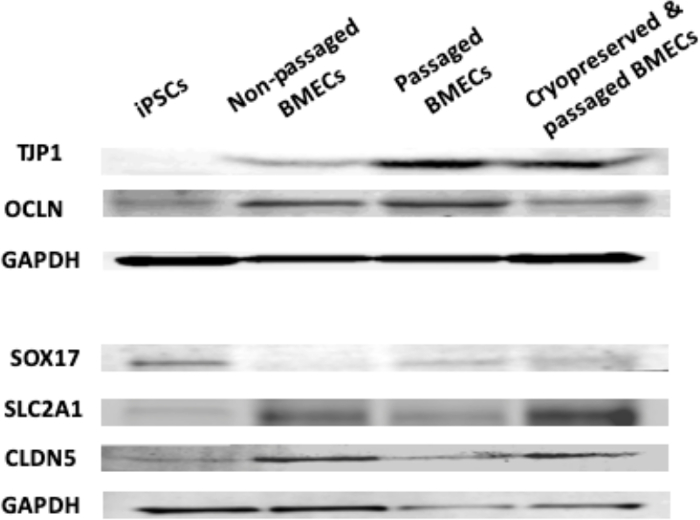
Figure 11: Western blot analysis of iPSCs, non-passaged BMECs, passaged BMECs, and cryopreserved & passaged BMECs. Western blots showing levels of TJP1, OCLN, SOX17, SLC2A1, CLDN5, and loading control (GAPDH). Please click here to view a larger version of this figure.
Discussion
Modifications and Troubleshooting
In this protocol, we made some modifications in using a commonly used extracellular matrix and cell culture media during iPSC culturing for derivation of BMECs (Figure 1). These changes did not impact the ability to derive BMECS from human iPSCs as described in the Lippmann protocol1. An iPSC line from a different healthy donor was used to demonstrate that this modified protocol shows results comparable to previous studies with other lines1. For cryopreservation, B27 supplement was used in lieu of 1% platelet poor plasma-derived serum (PDS)40, but this affected BMEC fidelity in subsequent culturing. In regards to troubleshooting, TEER values may fluctuate rapidly before stabilizing. This fluctuation may result from temperature changes occurring when the plates are moved from 37 °C to room temperature37. To overcome this issue, measurements should be taken rapidly, efficiently, and consistently. If necessary, temperature effects can be factored in by using a mathematical formula provided by Blume et al. 200949 to obtain temperature corrected TEER values.
Limitations of This Protocol
Despite obtaining BMECs with a robust BBB phenotype (i.e. high TEER value), maintaining this BBB property for an extended period of time continues to be a major challenge. As shown here, peak TEER values (~2000 Ω x cm2) using this protocol were much lower than previously reported peak TEER values (~8000 Ω x cm2)1. Despite this observation, TEER values fell within the usual range (2000-8000 Ω x cm2) of previously reported values1. A second limitation is the variability in peak TEER values that results from different iPSC lines used, which has been observed in other versions of this protocol36. The variation between different cell lines may be due to the growth and expansion rate of each iPSC line, which is impacted by environmental factors51. Another limitation is related to cryopreservation, as our protocol did not maintain BMEC fidelity. It is possible that 1% PDS40 provides greater stability of BMECs during cryopreservation.
Significance with Respect to Existing Methods
The iPSC-derived BMECs provide cells that have the genetic background of specific individuals, which is valuable in utilizing these cells for the study of disease biology. This is not the case when using animal models or primary BMEC cultures extracted from other animals37. Moreover, in vitro primary BMEC cultures show low TEER values (~100 Ω x cm2 37), much lower than those achieved with human iPSC-derived BMECs with the protocol described here. This modified protocol provides a detailed method for obtaining human BMECs from iPSCs, with the potential to expand and maintain them for longer use. The ability to passage and store differentiated BMECs can provide versatility and flexibility in experimental design, especially when studying multiple cell lines at once. Based on these results, iPSC-derived BMECs can be expanded and passaged after the initial sub-culturing step (Figure 7, Figure 8 and Figure 9), but cryopreservation needs further investigation. This protocol can also be used in conjunction with other stem cell-based cellular models to develop innovative approaches such as vascularization of brain organoids. Current methods to generate brain organoids result in an incomplete reconstitution of cell types of the human brain since they lack endothelial cells and critical elements of the neurovascular unit that comprise the BBB52,53. The protocol described here can provide a tractable and reproducible approach using two-dimensional Transwell/co-culturing systems that is less expensive and easier to implement than 3D models.
Future Applications of This Protocol
This protocol can be utilized to study the role of the neurovasculature and BBB in neuropsychiatric disorders such as schizophrenia and bipolar disorder, where deficits in the neurovasculature have been hypothesized to play a role9,10,20,54,55. Previous versions of this protocol36 had been used to derive BMECs from iPSC lines of patients with Huntington disease7 and 22q deletion syndrome patients with schizophrenia43. Both studies7,43 demonstrated successful utilization of this method to investigate paracellular and/or transcellular function related to the BBB. Some concerns have been raised about the potential confounding effects of animal serum in prior protocols1. The serum-free protocol used here removes this concern while producing similar results to prior protocols for deriving BMECs.
Critical Steps for Differentiating and Expanding BMECs
There are four critical steps when implementing this protocol. First, seeding iPSCs at an optimal density (i.e., seeding at ~15,600 cells/cm2) is important for efficient BMEC differentiation. If the cell density is too high or too low by day 4 of differentiation, cultures may display greater rates of cellular heterogeneity56. A second important step is the induction of differentiation between day 1 and day 4, where E6 medium is used to initiate differentiation. E6 is utilized in place of the “unconditioned medium” which was used in prior protocols6,35. Not only does E6 medium cut down the differentiation time from 13 days to 8 days, but it also promotes the expression of tight junction proteins (TJP1, OCLN, CLDN5) and BMEC markers (PECAM1 and SLC2A1)36. The use of E6 medium also resulted in proper TEER values (Figure 5) and ABCB1 and ABCC1 efflux transporter activity (Figure 6)6,35. Thirdly, the use of B27 in lieu of bovine serum allowed for serum-free condition, which improved the consistency and reliability of BMEC differentiation1. Lastly, in terms of expanding the iPSC-derived BMECs, cells should be passaged when they reach ~100% confluency. Based on this protocol, iPSC-derived BMECs can be further expanded and passaged after the initial sub-culturing stage (Figure 7, Figure 8 and Figure 9).
Disclosures
The authors have nothing to disclose.
Acknowledgements
This work was supported by a National Institute of Mental Health Biobehavioral Research Awards for Innovative New Scientists (BRAINS) Award R01MH113858 (to R.K.), a National Institutes of Health Award KL2 TR002542 (PL). a National Institute of Mental Health Clinical Scientist Development Award K08MH086846 (to R.K.), a Sydney R Baer Jr Foundation Grant (to P.L.) the Doris Duke Charitable Foundation Clinical Scientist Development Award (to R.K.), the Ryan Licht Sang Bipolar Foundation (to R.K.), the Phyllis & Jerome Lyle Rappaport Foundation (to R.K.), the Harvard Stem Cell Institute (to R.K.) and by Steve Willis and Elissa Freud (to R.K.). We thank Dr. Annie Kathuria for her critical reading and feedback on the manuscript.
Materials
| 2′,7′-dichlorodihydrofluorescein diacetate | Sigma Aldrich | D6883-50MG | |
| Accutase | Sigma Aldrich | A6964-100mL | |
| Alexa Fluor 488 Donkey anti-Mouse IgG | Life Technologies | A-21202 | |
| Alexa Fluor 555 Donkey anti-Rabbit IgG | Life Technologies | A-31572 | |
| B27 Supplement | Thermo Fisher Scientific | 17504044 | |
| CD31 (PECAM-1) (89C2) Mouse mAb | Cell Signaling | 3528S | |
| CLDN5 (Claudin-5) | Thermo Fisher Scientific | 35-2500 | |
| Collagen IV from human placenta | Sigma Aldrich | C5533-5mg | |
| Corning 2 mL Internal Threaded Polypropylene Cryogenic Vial | Corning | 8670 | |
| Corning Costar Flat Bottom Cell Culture Plates (6-wells) | Corning | 353046 | |
| Corning Falcon Flat Bottom Cell Culture Plates (24-wells) | Corning | 353047 | |
| Corning Transwell Multiple Well Plate with Permeable Polyester Membrane Inserts (12-wells) | Corning | 3460 | |
| Countess slides | Thermo Fisher Scientific | C10228 | |
| DMEM/F12 (without phenol red) | Thermo Fisher Scientific | A1413202 | |
| DMSO | Sigma Aldrich | D2438-50mL | |
| Donkey serum | Sigma Aldrich | D9663-10ML | |
| DPBS (+/+) | Gibco/Thermo Fisher Scientific | 14040-117 | |
| Epithelial Volt/Ohm (TEER) Meter (EVOM2) STX2 | World Precision Instruments | N/A | |
| Essential 6 Medium (Thermo Fisher) | Thermo Fisher Scientific | A1516401 | |
| Fetal Bovine Serum (FBS) | Sigma Aldrich | F2442 | |
| Fibronectin | Sigma Aldrich | F2006-2mg | |
| Geltrex LDEV-Free Reduced Growth Factor Basement Membrane Matrix | Thermo Fisher Scientific | A1413202 | |
| Hanks' Balance Salt Solution with calcium and magnesium | Thermo Fisher Scientific | 24020-117 | |
| Hoechst 33342, Trihydrochloride, Trihydrate | Thermo Fisher Scientific | H3570 | |
| Human endothelial serum-free medium | Thermo Fisher Scientific | 11111044 | |
| InCell Analyzer 6000 | General Electric | N/A | |
| Invitrogen Countess Automated Cell Counter | Thermo Fisher Scientific | N/A | |
| MK-571 | Sigma Aldrich | M7571-5MG | |
| NutriStem | Stemgent | 01-0005 | |
| Occludin | Thermo Fisher Scientific | 33-1500 | |
| Paraformaldehyde 16% | Electron Microscopy Services | 15710 | |
| Perkin Elmer Envision 2103 multi-plate Reader | Perkin Elmer | N/A | |
| Recombinant Human VEGF 165 | Peprotech | 100-20 | |
| Recombinant Human FGF-basic (154 a.a.) | Peprotech | 100-18B | |
| Retinoic acid | Sigma Aldrich | R2625-100MG | |
| Rhodamine 123 | Sigma Aldrich | 83702-10MG | |
| SLC2A1 (GLUT-1) | ThermoFisher | PA1-21041 | |
| SOX17 | Cell Signaling | 81778S | |
| TJP-1 (ZO-1) | ThermoFisher | PA5-28869 | |
| Triton X-100 | Sigma Aldrich | T8787-50ML | |
| Trypan Blue Stain (0.4%) for use with the Countess Automated Cell Counter | Thermo Fisher Scientific | T10282 | |
| Valspodar (Sigma) (cyclosporin A) | Sigma Aldrich | SML0572-5MG | |
| Versene solution | Thermo Fisher Scientific | 15040066 | |
| Y-27632 dihydrochloride (ROCK inhibitor) | Tocris/Thermo Fisher Scientific | 1254 |
References
- Neal, E. H., et al. A Simplified, Fully Defined Differentiation Scheme for Producing Blood-Brain Barrier Endothelial Cells from Human iPSCs. Stem Cell Reportsorts. 12, 1380-1388 (2019).
- Smith, Q. R., Rapoport, S. I. Cerebrovascular Permeability Coefficients to Sodium, Potassium, and Chloride. Journal of Neurochemistry. 46, 1732-1742 (2006).
- Liebner, S., et al. Functional morphology of the blood-brain barrier in health and disease. Acta Neuropathologica. 135, 311-336 (2018).
- Sanchez-Covarrubias, L., Slosky, L., Thompson, B., Davis, T., Ronaldson, P. Transporters at CNS Barrier Sites: Obstacles or Opportunities for Drug Delivery. Current Pharmaceutical Design. 20, 1422-1449 (2014).
- Stamatovic, S., Keep, R., Andjelkovic, A. Brain Endothelial Cell-Cell Junctions: How to “Open” the Blood Brain Barrier. Current Neuropharmacology. 6, 179-192 (2008).
- Lippmann, E. S., et al. Derivation of blood-brain barrier endothelial cells from human pluripotent stem cells. Nature Biotechnology. 30, 783-791 (2012).
- Lim, R. G., et al. Huntington’s Disease iPSC-Derived Brain Microvascular Endothelial Cells Reveal WNT-Mediated Angiogenic and Blood-Brain Barrier Deficits. Cell Reports. 19, 1365-1377 (2017).
- Eum, S., Lee, A. M., Bishop, J. R. Pharmacogenetic tests for antipsychotic medications: clinical implications and considerations. Dialogues in Clinical Neuroscience. 18, 323-337 (2016).
- Najjar, S., et al. Neurovascular Unit Dysfunction and Blood–Brain Barrier Hyperpermeability Contribute to Schizophrenia Neurobiology: A Theoretical Integration of Clinical and Experimental Evidence. Frontiers in Psychiatry. 8, 83 (2017).
- Pollak, T. A., et al. The blood-brain barrier in psychosis. Lancet Psychiatry. 5, 79-92 (2018).
- Watmuff, B., et al. Disease signatures for schizophrenia and bipolar disorder using patient-derived induced pluripotent stem cells. Molecular and Cellular Neuroscience. 73, 96-103 (2016).
- Watmuff, B., Liu, B., Karmacharya, R. Stem cell-derived neurons in the development of targeted treatment for schizophrenia and bipolar disorder. Pharmacogenomics. 18, 471-479 (2017).
- Karmacharya, R., Haggarty, S. J. Stem cell models of neuropsychiatric disorders. Molecular and Cellular Neuroscience. 73, 1-2 (2016).
- Hwang, Y., et al. Gene expression profiling by mRNA sequencing reveals increased expression of immune/inflammation-related genes in the hippocampus of individuals with schizophrenia. Translational Psychiatry. 3, 321 (2013).
- Kim, S. Transcriptome sequencing of the choroid plexus in schizophrenia. Translational Psychiatry. 11, (2016).
- Lizano, P., et al. Association of Choroid Plexus Enlargement With Cognitive, Inflammatory, and Structural Phenotypes Across the Psychosis Spectrum. American Journal of Psychiatry. 176, 564-572 (2019).
- Harris, L. W., et al. The Cerebral Microvasculature in Schizophrenia: A Laser Capture Microdissection Study. PLoS ONE. 3, 3964 (2008).
- Greene, C., Hanley, N., Campbell, M. Claudin-5: gatekeeper of neurological function. Fluids and Barriers of the CNS. 16, 3 (2019).
- Maes, M., Sirivichayakul, S., Kanchanatawan, B., Vodjani, A. Breakdown of the Paracellular Tight and Adherens Junctions in the Gut and Blood Brain Barrier and Damage to the Vascular Barrier in Patients with Deficit Schizophrenia. Neurotoxicity Research. 36, 306-322 (2019).
- Katsel, P., Roussos, P., Pletnikov, M., Haroutunian, V. Microvascular anomaly conditions in psychiatric disease. Schizophrenia – connection. Neuroscience & Biobehavioral Reviews. 77, 327-339 (2017).
- Pouget, J. G., et al. Genome-Wide Association Studies Suggest Limited Immune Gene Enrichment in Schizophrenia Compared to 5 Autoimmune Diseases. Schizophrenia Bulletin. 42, 1176-1184 (2016).
- Luo, X., et al. Systematic Prioritization and Integrative Analysis of Copy Number Variations in Schizophrenia Reveal Key Schizophrenia Susceptibility Genes. Schizophrenia Bulletin. , 15 (2014).
- Cai, H. Q., et al. Increased macrophages and changed brain endothelial cell gene expression in the frontal cortex of people with schizophrenia displaying inflammation. Molecular Psychiatry. , (2018).
- Katsel, P., Davis, K. L., Gorman, J. M., Haroutunian, V. Variations in differential gene expression patterns across multiple brain regions in schizophrenia. Schizophrenia Research. 77, 241-252 (2005).
- de Klerk, O. L., et al. Regional increase in P-glycoprotein function in the blood-brain barrier of patients with chronic schizophrenia. Psychiatry Research: Neuroimaging. 183, 151-156 (2010).
- Hoosain, F. G., et al. Bypassing P-Glycoprotein Drug Efflux Mechanisms: Possible Applications in Pharmacoresistant Schizophrenia Therapy. BioMed Research International. 2015, 1-21 (2015).
- Kimchi-Sarfaty, C., et al. A “Silent” Polymorphism in the MDR1 Gene Changes Substrate Specificity. Science. 315, 525-528 (2007).
- Martínez-Magaña, J. J., et al. Exploratory Analysis of Rare and Novel Variants in Mexican Patients Diagnosed with Schizophrenia and Dementia. Revista de Investigación Clínica. 71, 1879 (2019).
- Girard, S. L., et al. Increased exonic de novo mutation rate in individuals with schizophrenia. Nature Genetics. 43, 860-863 (2011).
- Xu, B., et al. De novo gene mutations highlight patterns of genetic and neural complexity in schizophrenia. Nature Genetics. 44, 1365-1369 (2012).
- Kurian, S. M. Identification of blood biomarkers for psychosis using convergent functional genomics. Molecular Psychiatry. 22, (2011).
- Prata, D. P., Costa-Neves, B., Cosme, G., Vassos, E. Unravelling the genetic basis of schizophrenia and bipolar disorder with GWAS: A systematic review. Journal of Psychiatric Research. 114, 178-207 (2019).
- Trépanier, M. O., Hopperton, K. E., Mizrahi, R., Mechawar, N., Bazinet, R. P. Postmortem evidence of cerebral inflammation in schizophrenia: a systematic review. Molecular Psychiatry. 21, 1009-1026 (2016).
- Busse, S., et al. Different distribution patterns of lymphocytes and microglia in the hippocampus of patients with residual versus paranoid schizophrenia: Further evidence for disease course-related immune alterations. Brain, Behavior, and Immunity. 26, 1273-1279 (2012).
- Lippmann, E. S., Al-Ahmad, A., Azarin, S. M., Palecek, S. P., Shusta, E. V. A retinoic acid-enhanced, multicellular human blood-brain barrier model derived from stem cell sources. Scientific Reports. 4, 4160 (2015).
- Hollmann, E. K., et al. Accelerated differentiation of human induced pluripotent stem cells to blood-brain barrier endothelial cells. Fluids and Barriers of the CNS. 14, 9 (2017).
- Srinivasan, B., Kolli, A. R., Barichello, T. Transepithelial/Transendothelial Electrical Resistance (TEER) to Measure the Integrity of Blood-Brain Barrier. Blood-Brain Barrier. 142, 99-114 (2019).
- Weksler, B. B., et al. Blood-brain barrier-specific properties of a human adult brain endothelial cell line. FASEB J. 19, 1872-1874 (2005).
- Eigenmann, D. E., et al. Comparative study of four immortalized human brain capillary endothelial cell lines, hCMEC/D3, hBMEC, TY10, and BB19, and optimization of culture conditions, for an in vitro blood-brain barrier model for drug permeability studies. Fluids and Barriers of the CNS. 10, 33 (2013).
- Wilson, H. K., Faubion, M. G., Hjortness, M. K., Palecek, S. P., Shusta, E. V. Cryopreservation of Brain Endothelial Cells Derived from Human Induced Pluripotent Stem Cells Is Enhanced by Rho-Associated Coiled Coil-Containing Kinase Inhibition. Tissue Engineering Part C: Methods. 22, 1085-1094 (2016).
- Martins Gomes, S. F., et al. Induced Pluripotent Stem Cell-Derived Brain Endothelial Cells as a Cellular Model to Study Neisseria meningitidis Infection. Frontiers in Microbiology. 10, 1181 (2019).
- Kim, B. J., et al. Modeling Group B Streptococcus and Blood-Brain Barrier Interaction by Using Induced Pluripotent Stem Cell-Derived Brain Endothelial Cells. mSphere. 2, 00398 (2017).
- Crockett, A. M., et al. Disruption of the Blood-Brain Barrier in 22q11.2 Deletion Syndrome. biorXiv. , (2019).
- Kathuria, A., et al. Synaptic deficits in iPSC-derived cortical interneurons in schizophrenia are mediated by NLGN2 and rescued by N-acetylcysteine. Translational Psychiatry. 9, 321 (2019).
- Kathuria, A., et al. Transcriptomic Landscape and Functional Characterization of Induced Pluripotent Stem Cell-Derived Cerebral Organoids in Schizophrenia. JAMA Psychiatry. , (2020).
- Kathuria, A., et al. Transcriptome analysis and functional characterization of cerebral organoids in bipolar disorder. Genome Medicine. 12, 34 (2020).
- Warren, L., Lin, C. mRNA-Based Genetic Reprogramming. Molecular Therapy. 27, 729-734 (2019).
- Eaton, S. L., et al. A Guide to Modern Quantitative Fluorescent Western Blotting with Troubleshooting Strategies. Journal of Visualized Experiments. , 52099 (2014).
- Wang, P., Rodriguez, R. T., Wang, J., Ghodasara, A., Kim, S. K. Targeting SOX17 in Human Embryonic Stem Cells Creates Unique Strategies for Isolating and Analyzing Developing Endoderm. Cell Stem Cell. 8, 335-346 (2011).
- Blume, L. F., Denker, M., Kunze, T., et al. Temperature corrected transepithelial electrical resistance (TEER) measurement to quantify rapid changes in paracellular permeability. Pharmazie. , 19-24 (2010).
- Chen, K. G., Mallon, B. S., McKay, R. D. G., Robey, P. G. Human Pluripotent Stem Cell Culture: Considerations for Maintenance, Expansion, and Therapeutics. Cell Stem Cell. 14, 13-26 (2014).
- Pham, M. T., et al. Generation of human vascularized brain organoids. NeuroReport. 29, 588-593 (2018).
- Mansour, A. A., et al. An in vivo model of functional and vascularized human brain organoids. Nature Biotechnology. 36, 432-441 (2018).
- Baruah, J., Vasudevan, A. The Vessels Shaping Mental Health or Illness. Open Neuroimaging Journal. 13, 1-9 (2019).
- Lopes, R., Soares, R., Coelho, R., Figueiredo-Braga, M. Angiogenesis in the pathophysiology of schizophrenia – comprehensive review and a conceptual hypothesis. Life Sciences. 128, 79-93 (2015).
- Wilson, H. K., Canfield, S. G., Hjortness, M. K., Palecek, S. P., Shusta, E. V. Exploring the effects of cell seeding density on the differentiation of human pluripotent stem cells to brain microvascular endothelial cells. Fluids and Barriers of the CNS. 12, 13 (2015).

