Visualization of Mitochondrial DNA Replication in Individual Cells by EdU Signal Amplification
Summary
We developed a sensitive technique to label newly synthesized mitochondrial DNA (mtDNA) in individual cells in order to study mtDNA biogenesis. The technique combines the incorporation of EdU together with a tyramide signal amplification (TSA) protocol to visualize mtDNA replication within subcellular compartments of neurons.
Abstract
Mitochondria are key regulators of cellular energy and mitochondrial biogenesis is an essential component of regulating mitochondria numbers in healthy cells1-3. One approach for monitoring mitochondrial biogenesis is to measure the rate of mitochondrial DNA (mtDNA) replication4. We developed a sensitive technique to label newly synthesized mtDNA in individual cells in order to study mtDNA biogenesis. The technique combines the incorporation of 5-ethynyl-2′-deoxyuridine (EdU)5-7 with a tyramide signal amplification (TSA)8 protocol to visualize mtDNA replication within subcellular compartments of neurons. EdU is superior to other thymidine analogs, such as 5-bromo-2-deoxyuridine (BrdU), because the initial click reaction to label EdU5-7 does not require the harsh acid treatments or enzyme digests that are required for exposing the BrdU epitope. The milder labeling of EdU allows for direct comparison of its incorporation with other cellular markers9-10. The ability to visualize and quantify mtDNA biogenesis provides an essential tool for investigating the mechanisms used to regulate mitochondrial biogenesis and would provide insight into the pathogenesis associated with drug toxicity, aging, cancer and neurodegenerative diseases. Our technique is applicable to sensory neurons as well as other cell types. The use of this technique to measure mtDNA biogenesis has significant implications in furthering the understanding of both normal cellular physiology as well as impaired disease states.
Protocol
1. Preparation of Neurons
- Dorsal root ganglion (DRG) neurons are grown on sterile (autoclaved) 12 mm glass coverslips in a 24-well culture plate.
- The 10 mM stock of EdU (in DMSO, Click-iT EdU Microplate Assay Kit) is typically diluted 1:100 in culture medium to make a 10X EdU solution (100 μM) and then diluted 1:10 into the culture wells (e.g. 30 μL of the 10X EdU solution into a total of 300 μL of culture medium). DRG neurons are incubated with a final concentration of 10 μM EdU at 37°C and 5% CO2 between 2-24 hours. The length of time depends on how treatments affect the rate of mtDNA synthesis.
- In a fume hood, DRG neurons are fixed in 2% paraformaldehyde for 10-15 min at room temperature, washed twice in 1X PBS 2-5 minutes each wash and stored in fresh 1X PBS for up to 1 month at 4°C.
- Coverslips are transferred with fine-tipped forceps to a prepared humid chamber (Corning BioAssay dish with black papered bottom for contrast, wrapped in aluminum foil to protect light sensitive components and humidified with water saturated Kimwipes) and placed on a sheet of Parafilm M that provides a hydrophobic surface to confine the solutions to the coverslip. The protocol below is designed for 28 coverslips and solutions are prepared for 32 coverslips (about 14% extra volume). Solutions with expensive or limited components are made so that 75-80 μL are used on each coverslip. Otherwise, 200-300 μL are used for wash and block solutions to thoroughly wash out previous solutions.
- Re-apply 1X PBS to cover the surface of each coverslip (200-300 μL). Prepare the Click-iT assay and tyramide signal amplification kits as described below and in the manufacturer’s instructions.
Preparation of Click-iT EdU Microplate Assay Kit
Most components from the Click-iT EdU Microplate Assay Kit come pre-made and are stored at 4°C [2x Click-iT Reaction Buffer (10x Component E), CuSO4 (100 mM, Component F), Click-iT EdU fixative (Component D) and Blocking Buffer (2x Component H)]. Click-iT EdU Buffer Additive (10x Component G) is stored at -20°C to prevent it from turning yellow-brown over time. This component tolerates repeated freeze-thaw cycles.
The Oregon Green 488 azide (Component B) should be divided into small aliquots (10-20 μL) to minimize freeze-thaw cycles and stored at -20°C.
To prepare a stock solution of the anti-Oregon Green HRP conjugate (Component I), add 75 μL of Milli Q dH2O to the vial. Mix by gentle pipetting or by inversion to avoid foaming and store at 4°C. Do not vortex.
Preparation of TSA Kit #12, with HRP Goat Anti-Rabbit IgG and Alexa Fluor 488 Tyramide Kit
To prepare the tyramide stock solution, dissolve the solid material (Alexa Fluor 488 tyramide, Component A) in 150 μL of DMSO (Component B). Invert the vial several times to dissolve any tyramide coating the sides of the vial. Store stock solution in small aliquots (10-20 μL) at ≤-20°C, desiccated and protected from light.
2. Click-iT 5-ethynyl-2-deoxyuridine (EdU) Labeling
NOTE: All solutions are removed with a bulb transfer pipette with a 200 μL tip affixed to the end to gently remove liquids without losing cells. Avoid using a vacuum line, which usually remove solutions too vigorously. A bulb pipette is used to gently flood coverslips with 200-300 μL of wash solutions to thoroughly wash out the previous solution.
- Cells are permeabilized with 0.1% Triton-X-100 in 1X PBS solution for 10 minutes at room temperature in a covered humid chamber. Use 1% Triton-X-100 stock solutions.
- Make 3000 μL of 0.1% Triton-X-100 by adding 300 μL 1% Triton-X-100 stock to 2700μL 1X PBS.
- Use 75-80 μL per coverslip.
- Remove the Triton X-100 solution and rinse twice with 1X PBS.
- Endogenous peroxidase activity is quenched by a 1% H2O2 in 1X PBS solution for 30 minutes at room temperature. Dilute 30% H2O2 solution with 1X PBS. This solution should be made fresh but can be made during the 10 minute permeabilization step above (step 3.1).
- Make 3000 μL of a 1% H2O2 by adding 100 μL 30% H2O2 to 2900 μL 1X PBS.
- Use 75-80 μL per coverslip.
- Remove the peroxidase solution and rinse twice with 1X PBS.
- Click-iT EdU Reaction
- For 32 coverslips (32 x 80 μL = 2560 μL) a total of 2560 μL is needed. The 2x reaction is made in 1280 μL, which is half of the total volume of the reaction.
- Freshly prepare the Click-iT Reaction Cocktail prior to starting the 5 minute post fix (step 3.5 below).
- Mix the cocktail by pipetting up and down. Do not vortex when making this reaction.
2 x Reaction Cocktail
Components are from Click-iT EdU Microplate Assay KitHalf Volume: 1280 μL Milli Q dH2O 1132.8 μL 2x Click-iT Reaction Buffer (10x Component E) 100.3 μL Click-iT EdU Buffer Additive (10x Component G) 25.6 μL CuSO4 (100 mM, Component F) 25.6 μL Oregon Green Azide (Component A) 6.4 μL Total 1290.7 μL
NOTE: The volumes used above are proportional to the volumes listed in the Click-iT EdU Microplate Assay kit directions. The final volume of Reaction Cocktail is slightly more than 1280 μL. - The 2X Click-iT reaction is diluted with equal volume of Click-iT EdU fixative (Component D) right before use. Mixing these together makes a uniform reaction solution for all coverslips.
- Add 1290.7 μL Click-iT EdU fixative (Component D) to the 1290.7 μL reaction cocktail. Use 75-80 μL per coverslip.
- Post-fix the neurons with Click-iT EdU fixative (Component D) for 5 minutes at room temperature.
- Remove fix and add reaction cocktail from above (step 3.4). Cover to protect from light and incubate for 25 minutes at room temperature. Gently remove the Reaction Cocktail. Wash twice with diluted 1X Blocking Buffer (2X Component H).
- Make 5200 μL of 1X Blocking Buffer by diluting 2600 μL Blocking Buffer (2x Component H) with an equal volume of MilliQ d H2O (2600 μL). Use 75-80 μL per coverslip.
- Under an epi-fluorescent microscope, check for Oregon Green staining in nuclei of mitotically active control cells.
3. Tyramide Signal Amplification (TSA) of EdU Signal
- Add 1% TSA block solution to each coverslip and incubate for 30 minutes at room temperature.
- Make 6000 μL of 1% TSA block solution by weighing 0.06 g of TSA Blocking Reagent (TSA kit #12, Component D) and adding it to 6000 μL 1X PBS. Vortex to mix. Addition of 5% goat serum in the 1% TSA block solution will often help to reduce non-specific binding.
- Briefly spin the anti-Oregon Green horseradish peroxidase conjugated antibody stock (Component I of the Click-iT EdU Microplate Assay), prepared 2-24 hours in advance of TSA. Dilute the primary antibody 1:300 in 1% TSA blocking solution and invert or pipette up and down gently to mix. Do not vortex to avoid disrupting the HRP-conjugated antibody. Remove 1% TSA block solution, add 75 μL to each coverslip and incubate overnight at 4°C.
- The antibody can be used more concentrated, such as 1:150, but it is supplied in limited amounts, so use it sparingly. Again, addition of 5% goat serum in the 1% TSA block solution will often help to reduce non-specific binding of the anti-Oregon Green horseradish peroxidase conjugated antibody.
- Make 2560 μL of a 1:300 antibody solution by adding 8.53 μL of the stock Rabbit anti-Oregon Green-HRP (Click-iT EdU Microplate Assay) to 2560 μL 1% TSA Blocking. Mix by gentle pipetting or inversion.
- The next day, remove the antibody solution and rinse three times with 1X PBS. Incubate the coverslips in the final wash for an additional 30-60 minutes at room temperature to ensure that unbound primary antibody is removed.
- Prepare Tyramide reaction for 2560 μL (32 coverslips x 80 μL).
- Make 400 μL of a 0.15% H2O2 solution (100X) by adding 2 μL of the 30 % H2O2 (TSA kit #12, Component F) to 398 μL Amplification Buffer (TSA kit #12, Component E). This should be made right before needed.
- For a final volume of 2560 μL combine:
- 25.6 μL Tyramide-488 (TSA kit Component A)
- 2508.8 μL Amplification Buffer (TSA kit Component E)
- 25.6 μL 0.15% H2O2 (from above for a final 0.0015% H2O2)
- Remove 1X PBS and incubate with the Tyramide reaction for 15 minutes at room temperature.
- Remove Tyramide reaction and rinse three times with 1X PBS, incubating in the final wash for 30-60 minutes at room temperature as before.
- Check for mtDNA labeling under an epi-fluorescent microscope.
- Mount coverslips on glass microscope slides with an antifade mounting medium, such as ProLong Gold with DAPI. Alternatively, the EdU labeling and amplification can be followed by standard fluorescent immunocytochemistry to label other cellular markers.
4. Representative Results: Visualization of Mitochondrial DNA Replication as a Marker for Mitochondrial Biogenesis
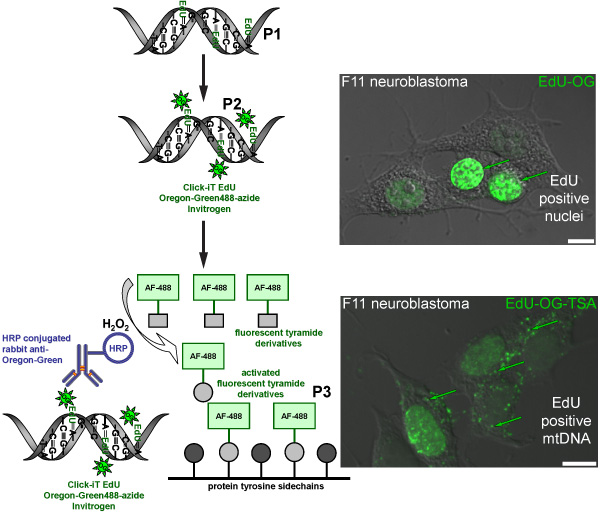
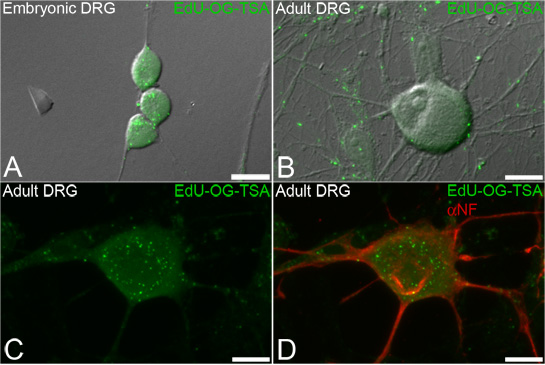
We are interested in how sensory neurons (Figure 1) regulate the number of mitochondria. This protocol will label newly synthesized mtDNA with a fluorescent marker as a way of measuring new mitochondria. The incorporation of the synthetic nucleotide EdU followed by the click chemistry of the Oregon Green-azide and subsequent amplification with the Alexa-Fluor 488 tyramide results in the labeling of mtDNA with a green fluorescent signal (Figure 2). If done correctly, the amplified green signal is sufficiently higher than background fluorescence (such as cellular autofluorescence or a side-effect of the HRP-TSA reaction).
This technique is designed to label newly replicated mtDNA in order to visualize and quantify mtDNA biogenesis within subcellular compartments of neurons (Figure 3). The EdU labeling allows for subsequent fluorescent immunocytochemistry to label other cellular markers such as neurofilament (Figure 3D).
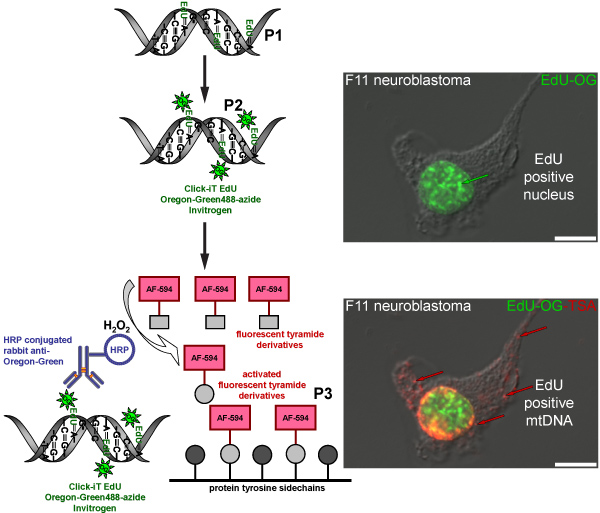
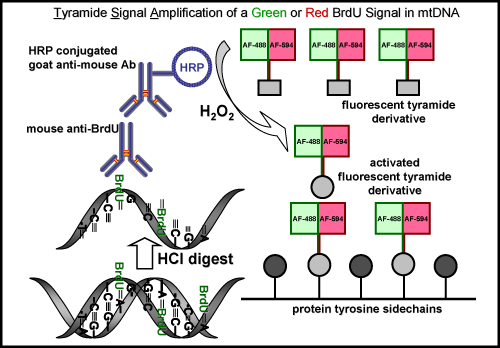
The TSA reaction can also be done with other fluorescent Alexa Fluor tyramides such as Alexa Fluor 594-tyramide. This results in a green fluorescent nuclear signal from the Oregon Green-azide click reaction in the nucleus but no green signal in mtDNA, which is undetectable prior to TSA. The amplification with Alexa Fluor 594-tyramide intensifies the nuclear label and reveals the incorporated EdU in mtDNA with a red fluorescent signal (Figure 4). A similar amplification procedure is used to visualize BrdU incorporation into newly synthesized mtDNA (Figure 5), however, this method requires an additional step to recover the BrdU epitope by either a harsh acid (HCl) or enzyme digest, which is not necessary for EdU labeling.

Figure 1. Representative differential interference contrast (DIC) images of embryonic (left) and adult (right) dorsal root ganglion (DRG) neurons that are typically used for analysis. Bars = 10 μm.

Figure 2. Schematic diagram representing the procedure for labeling EdU in mtDNA with a green fluorescent signal. The schematic represents the three-step protocol for labeling EdU in mtDNA with a green fluorescent signal. Mitotically active F11 neuroblastoma cells serve as a positive control and illustrate the labeling pattern of EdU that was incorporated in nuclear and mitochondrial DNA. The first step (P1) is to incorporate a thymidine analog into newly synthesized mtDNA by incubating cells in the presence of EdU. The second step (P2) is based on click chemistry to label incorporated EdU with an Oregon Green-azide. Green signal is visible in nuclei of cells that replicated their nuclear DNA. The final step (P3) is to amplify the Oregon Green-azide signal by incubating with a HRP-conjugated rabbit antibody against Oregon Green followed by incubation with Alexa Fluor 488 labeled tyramide in the presence of hydrogen peroxide (H2O2) to visualize green signal in mtDNA.

Figure 3. EdU labeling of mtDNA in dorsal root ganglion (DRG) neurons. Neurons are incubated with EdU and the signal is subsequently amplified to reveal mtDNA that incorporated EdU. Representative fluorescence images overlaid on transmitted light showing green punctate signals of amplified EdU (EdU-OG-TSA, green) incorporated into newly synthesized mtDNA of both embryonic (A) and adult (B-D) DRG neurons. The EdU labeling procedure allows for subsequent immunofluorescence staining of neuronal markers such as neurofilament (D, αNF, in red). Scale bars = 10 μm.

Figure 4. Schematic diagram representing the procedure for labeling EdU in mtDNA with a red fluorescent signal. The schematic represents the three-step protocol for labeling EdU in mtDNA with a red fluorescent signal. Mitotically active F11 neuroblastoma cells serve as a positive control and illustrate the labeling pattern of EdU that was incorporated in nuclear and mitochondrial DNA. The first step (P1) is to incorporate a thymidine analog into newly synthesized mtDNA by incubating cells in the presence of EdU. The second step (P2) is based on click chemistry to label incorporated EdU with an Oregon Green-azide. Green signal is visible in nuclei of cells that replicated their nuclear DNA. The final step (P3) is to amplify the Oregon Green-azide signal by incubating with a HRP-conjugated rabbit antibody against Oregon Green followed by incubation with Alexa Fluor 594 labeled tyramide in the presence of hydrogen peroxide (H2O2) to visualize red signal in mtDNA.

Figure 5. BrdU labeling and tyramide signal amplification with a green or red fluorescent signal in mtDNA. The schematic diagram represents the procedure for labeling BrdU in newly synthesized mtDNA with either a green or red fluorescent signal. An initial step is required to recover the BrdU epitope by either an acid (HCl) or enzyme digest, which is not necessary for EdU labeling. The next step is incubating with a mouse primary anti-BrdU antibody. This is followed by incubating with a horseradish peroxidase (HRP)-conjugated goat anti-mouse antibody. Finally, the signal is amplified with a green or red fluorescently labeled tyramide in the presence of hydrogen peroxide (H2O2) to visualize signal in mtDNA.
Discussion
We developed a sensitive assay to label newly synthesized mtDNA in individual cells using a tyramide signal amplification of EdU. One of the biggest issues during the optimization of this protocol was the inconsistent results between coverslips. Changes were made to the Invitrogen kit protocols to avoid mixing small volumes on individual coverslips and making master solutions to use for all coverslips. The 75-80 μL used for each 12 mm circular glass coverslip is an ideal volume to completely cover the surface area while providing enough solution to give consistent results between samples. Incubation times and reagent concentrations were optimized but improvements might be seen with adjustments to them.
The protocol is designed to run each process once. However, some of the steps have been repeated with new solutions to recover samples that failed after the first attempt. In particular, the EdU click reaction steps (3.4-3.6) have been repeated without a significant increase in background fluorescence. The anti-Oregon Green-HRP antibody incubation (4.1-4.3) and the tyramide amplification (4.4-4.5) steps have also been repeated, but more often results in a poor signal to noise ratio because of the increased background fluorescence.
The most sensitive reagents are the Click-iT EdU Buffer Additive (Component G) and the rabbit anti-Oregon Green-HRP antibody (Component I) from the Click-iT EdU Microplate Assay kit. The Click-iT EdU Buffer Additive gradually turns yellow over time when stored at 4°C and between 6-12 months darkens considerably. Storage of the Click-iT EdU Buffer Additive at -20°C will alleviate this issue. The labeling and tyramide amplification steps work best when the rabbit anti-Oregon Green-HRP antibody is used within 4-6 months of reconstituting it in MilliQ dH2O.
The mild labeling of EdU in mtDNA allows for direct comparisons with additional cellular markers9-11 and enhances the utility of this technique over other thymidine analogs, such as 5-bromo-2-deoxyuridine (BrdU), which requires a harsh treatment to recover its epitope within DNA. Our laboratory11-12 and others13-15 have successfully used BrdU to label mtDNA. The BrdU labeling technique is similar to the one used for EdU but has some important differences (Figure 5). After the permeabilization step listed above (3.1-3.2), the BrdU epitope is recovered with a denaturation step (2 N HCl for 30 min at 37°C followed by three washes in 1X PBS). The BrdU is then labeled with a primary antibody against BrdU (Vector Laboratories diluted 1:50 in 1% blocking solution from the TSA kit and incubated overnight at 4°C). A secondary antibody step is needed to amplify the BrdU signal (goat anti-mouse IgG conjugated to HRP from the TSA kits #2 and #5, diluted 1:100 in 1% blocking solution and incubated for 45 min at room temperature) prior to the TSA steps (4.3-4.5 above). Having two thymidine analogs, EdU and BrdU, to label mtDNA is advantageous for performing dual label experiments where mtDNA can be sequentially labeled in pulse-labeling paradigms11.
Our laboratory is using the EdU and BrdU labeling of mtDNA to examine the regulation of mitochondrial biogenesis in the context of diabetic neuropathy, a common complication of diabetes. We have successfully used the signal amplification to measure changes in mtDNA biogenesis in individual neurons11-12. This technique will be useful in other experiments designed to explore the mechanisms of mtDNA replication and turnover or for identifying drugs that inhibit mtDNA synthesis. In addition, the basic principles of amplifying EdU and BrdU signals may be applied to other studies that measure DNA replication or repair.
Disclosures
The authors have nothing to disclose.
Acknowledgements
This work was supported by National Institutes of Health Grants NS-38849 and DK-076160, the Juvenile Diabetes Research Foundation Center for the Study of Complications in Diabetes, the Program for Neurology Research and Discovery and The A. Alfred Taubman Medical Research Institute at the University of Michigan. This work used the Morphology and Image Analysis Core of the Michigan Diabetes Research and Training Center, funded by National Institutes of Health Grant 5P60 DK-20572 from the National Institute of Diabetes and Digestive and Kidney Diseases. The authors thank Scott T. Clarke from Molecular Probes/Invitrogen for his valuable advice on the various Click-iT EdU labeling kits and the generous donation of reagents to support the initial development of the EdU amplification technique.
Materials
| Material Name | Type | Company | Catalogue Number | Comment |
|---|---|---|---|---|
| 12 mm coverslips | Fisher Scientific | 12-545-82 | ||
| 245 mm x 245 mm BioAssay Dish | Corning | 431111 | ||
| Parafilm M | Fisher Scientific | PM-996 | ||
| paraformaldehye | Sigma-Aldrich | P6148 | ||
| Triton X-100 | Sigma-Aldrich | T-8532 | ||
| Phosphate buffered saline 10X solution | Fisher Scientific | BP399 | ||
| Transfer Pipet | Fisher Scientific | 13-711-7M | ||
| Hydrogen peroxide, 30% in water | Fisher Scientific | BP2633 | ||
| Click-iT EdU Microplate Assay Kit | Invitrogen | C10214 | ||
| TSA Kit #12, with HRP—goat anti-rabbit IgG and Alexa Fluor 488 tyramide | Invitrogen | T20922 | ||
| TSA Kit #15, with HRP–goat anti-rabbit IgG and Alexa Fluor 594 tyramide | Invitrogen | T20925 | ||
| ProLong Gold antifade reagent with DAPI | Invitrogen | P-36931 | ||
| Polyclonal rabbit Neurofilament antibody | Chemicon | AB1981 | ||
| Mouse monoclonal anti-BrdU antibody | Vector Laboratories | VP-B209 | ||
| TSA Kit #2, with HRP—goat anti-mouse IgG and Alexa Fluor 488 tyramide | Invitrogen | T20912 | ||
| TSA Kit #5, with HRP—goat anti-mouse IgG and Alexa Fluor 594 tyramide | Invitrogen | T20915 |
References
- Chan, D. C. Mitochondrial fusion and fission in mammals. Annu. Rev. Cell Dev. Biol. 22, 79-99 (2006).
- Dimmer, K. S., Scorrano, L. (De)constructing mitochondria: what for. Physiology (Bethesda). 21, 233-241 (2006).
- Suen, D. F., Norris, K. L., Youle, R. J. Mitochondrial dynamics and apoptosis. Genes Dev. 22, 1577-1590 (2008).
- Clay Montier, L. L., Deng, J. J., Bai, Y. Number matters: control of mammalian mitochondrial DNA copy number. J. Genet. Genomics. 36 (3), 125-131 (2009).
- Salic, A., Mitchison, T. J. A chemical method for fast and sensitive detection of DNA synthesis in vivo. Proc Natl Acad Sci U.S.A. 105, 2415-2420 (2008).
- Buck, S. B., Bradford, J., Gee, K. R., Agnew, B. J., Clarke, S. T., Salic, A. Detection of S-phase cell cycle progression using 5-ethynyl-2′-deoxyuridine incorporation with click chemistry, an alternative to using 5-bromo-2′-deoxyuridine antibodies. Biotechniques. 44, 927-929 (2008).
- Yu, Y., Arora, A., Min, W., Roifman, C. M., Grunebaum, E. EdU incorporation is an alternative non-radioactive assay to [(3)H]thymidine uptake for in vitro measurement of mice T-cell proliferations. J Immunol Methods. 350 (1-2), 29-35 (2009).
- Heusden, J. V. a. n., Jong, P. d. e., Ramaekers, F., Bruwiere, H., Borgers, M., Smets, G. Fluorescein-labeled tyramide strongly enhances the detection of low bromodeoxyuridine incorporation levels. J. Histochem. Cytochem. 45 (2), 315-319 (1997).
- Cappella, P., Gasparri, F., Pulici, M., Moll, J. A novel method based on click chemistry, which overcomes limitations of cell cycle analysis by classical determination of BrdU incorporation, allowing multiplex antibody staining. Cytometry A. 73, 626-636 (2008).
- Kaiser, C. L., Kamien, A. J., Shah, P. A., Chapman, B. J., Cotanche, D. A. 5-Ethynyl-2′-deoxyuridine labeling detects proliferating cells in the regenerating avian cochlea. Laryngoscope. 119, 1770-1775 (2009).
- Lentz, S. I., Edwards, J. L., Backus, C., McLean, L. L., Haines, K. M., Feldman, E. L. Mitochondrial DNA (mtDNA) Biogenesis: Visualization and Duel Incorporation of BrdU and EdU Into Newly Synthesized mtDNA In. Vitro. J Histochem Cytochem. 58 (2), 207-218 (2010).
- Edwards, J. L., Quattrini, A., Lentz, S. I., Figueroa-Romero, C., Cerri, F., Backus, C., Hong, Y., Feldman, E. L. Diabetes regulates mitochondrial biogenesis and fission in mouse neurons. Diabetologia. 53 (1), 160-169 (2010).
- Davis, A. F., Clayton, D. A. In situ localization of mitochondrial DNA replication in intact mammalian cells. J. Cell Biol. 135, 883-893 (1996).
- Magnusson, J., Orth, M., Lestienne, P., Taanman, J. W. Replication of mitochondrial DNA occurs throughout the mitochondria of cultured human cells. Exp. Cell. Res. 289, 133-142 (2003).
- Amiri, M., Hollenbeck, P. J. Mitochondrial biogenesis in the axons of vertebrate peripheral neurons. Dev. Neurobiol. 68, 1348-1361 (2008).

