Elemental-sensitive Detection of the Chemistry in Batteries through Soft X-ray Absorption Spectroscopy and Resonant Inelastic X-ray Scattering
Summary
Here, we present a protocol for typical experiments of soft X-ray absorption spectroscopy (sXAS) and resonant inelastic X-ray scattering (RIXS) with applications in battery material studies.
Abstract
Energy storage has become more and more a limiting factor of today’s sustainable energy applications, including electric vehicles and green electric grid based on volatile solar and wind sources. The pressing demand of developing high-performance electrochemical energy storage solutions, i.e., batteries, relies on both fundamental understanding and practical developments from both the academy and industry. The formidable challenge of developing successful battery technology stems from the different requirements for different energy-storage applications. Energy density, power, stability, safety, and cost parameters all have to be balanced in batteries to meet the requirements of different applications. Therefore, multiple battery technologies based on different materials and mechanisms need to be developed and optimized. Incisive tools that could directly probe the chemical reactions in various battery materials are becoming critical to advance the field beyond its conventional trial-and-error approach. Here, we present detailed protocols for soft X-ray absorption spectroscopy (sXAS), soft X-ray emission spectroscopy (sXES), and resonant inelastic X-ray scattering (RIXS) experiments, which are inherently elemental-sensitive probes of the transition-metal 3d and anion 2p states in battery compounds. We provide the details on the experimental techniques and demonstrations revealing the key chemical states in battery materials through these soft X-ray spectroscopy techniques.
Introduction
Developing high-performance batteries is one of the crucial requirements for realizing modern energy applications with environmentally benign resources and devices. Developing high-efficiency, low-cost, and sustainable energy storage devices has become critical for both electric vehicles (EVs) and the electric grid, with a projected energy storage market expansion of ten times in this decade. The ubiquitous Li-ion battery (LIB) technology remains a promising candidate for high energy-density and high power energy storage solutions1, while Na-ion batteries (SIBs) hold the promise of realizing low-cost and stable storage for green-grid applications2. However, the overall level of battery technology is well below what is required to meet the need of this new phase of mid-to-large scale energy storage1,3.
The pressing challenge of developing high-performance energy-storage system arises from the complex mechanical and electronic characteristics of the battery operations. Extensive efforts have focused on material synthesis and mechanical properties. However, the evolution of the chemical states of particular elements in battery electrodes is often under active debate for newly developed battery materials. In general, both LIBs and SIBs operate with evolving electronic states triggered by the transportation of the electrons and ions during the charge and discharge process, leading to the oxidation and reduction (redox) reactions of specific element(s). As the bottleneck for many performance parameters, battery cathodes have been paid much attention in research and developments4,5. A practical battery cathode material is often a 3d transition-metal (TM) oxide with particular structural channels for ion diffusion. Conventionally, the redox reaction is limited to the TM elements; however, recent results indicate that oxygen could possibly be utilized in reversible electrochemical cycling6. The redox mechanism is one of the most critical pieces of information for understanding an electrochemical operation, and a direct probe of the chemical states of battery electrodes with elemental sensitivity is thus highly desirable.
Synchrotron-based, soft X-ray spectroscopy is an advanced technique that detects the valence electron states in the vicinity of the Fermi level in battery materials7. Because of the high sensitivity of soft X-ray photons to the electrons of a specific element and orbital, soft X-ray spectroscopy could be utilized as a direct probe of the critical electron states in battery electrodes8, or at the interfaces in batteries9. Furthermore, compared with hard X-rays, soft X-rays are lower in energy and cover excitations of the low-Z elements, e.g., C, N, O, and of the 2p-to-3d excitation in the 3d TMs10.
The excitations of soft x-ray spectroscopy first involve electron transitions from a particular core state to an unoccupied state by absorbing energy from soft X-ray photons. The intensity of such soft X-ray absorption spectroscopy thus corresponds to the density of state (DOS) of the unoccupied (conduction-band) states with the existence of the excited core-holes. The X-ray absorption coefficient can be measured by detecting the total number of photons or electrons emitted during the decay process. The total electron yield (TEY) counts the total number of emitted electrons, and is thus a photon-in-electron-out (PIEO) detection mode. TEY has a shallow probe depth of several nanometers, and therefore is relatively surface sensitive, due to the shallow escape depth of electrons. However, as a photon-in-photon-out (PIPO) detection mode, the total fluorescence yield (TFY) measures the total number of emitted photons in the sXAS process. Its probe depth is about hundreds of nanometers, which is deeper than that of TEY. Due to the difference in probe depths, the contrast between TEY and TFY could provide important information for a comparison between the surface and bulk of the material.
sXES is a PIPO technique, corresponding to the decay of the exited state to fill the core hole, leading to the emission of X-ray photons at characteristic energies. If the core electron is excited to the continuum electron state far away from the sXAS threshold, it is a non-resonant X-ray fluorescence process corresponding to the decay of occupied (valence-band) electrons to the core holes, i.e., sXES reflects the DOS of the valence-band states. Otherwise, if the core electron is resonantly excited to exactly the absorption threshold, the resulting emission spectra feature strong excitation energy dependence. For this case, the spectroscopy experiments are denoted as resonant inelastic x-ray scattering (RIXS).
Because sXAS and sXES corresponds to the unoccupied (conduction-band) and occupied (valence-band) electron states, respectively, they provide complementary information on the electron states involved in the reduction and oxidation reactions in the battery electrodes upon electrochemical operation11. For low-Z elements, especially C12,13, N14, and O15,16,17, sXAS has been widely used for studying the critical electron states corresponding to both the electron transfer12,13 and chemical compositions15,16,17. For 3d TMs, sXAS of TM L-edges has been successfully demonstrated to be an effective probe of the TM redox reactions of V18, Mn19,20,21,22,23, Fe23,24,25,26, Co20,27, and Ni20,28. Because the TM-L sXAS features are dominated by the well-defined multiplet effect, which are sensitive to the different TM oxidation18,19,20,21,22,24,25,26,27,28 and spin states14,29, the TM sXAS data could enable even quantitative analysis of the TM redox couples in LIB and SIB electrodes27.
Compared with the popular employment of sXAS for battery material studies, RIXS is less often utilized due to the complexity of both the experiments and data interpretation for obtaining meaningful information related to battery performance10. However, due to the extremely high chemical-state selectivity of RIXS, RIXS is potentially a much more sensitive probe of the chemical state evolution in battery materials with inherent elemental sensitivity. Recent sXES and RIXS reports by Jeyachandran et al., have showcased the high sensitivity of RIXS to specific chemical configurations in the ion-solvation systems beyond sXAS30,31. With the recent rapid developments of high-efficiency RIXS systems32,33,34, RIXS has quickly shifted from a fundamental physics tool to a powerful technique for battery research, and occasionally becomes the tool-of-choice for specific studies of both the cation and anion evolution in battery compounds.
In this work, the detailed protocols for sXAS, sXES, and RIXS experiments are introduced. We cover the details of experimental planning, technical procedures for carrying out experiments, and more importantly, data processing for different spectroscopic techniques. Furthermore, three representative results in battery material studies are presented to demonstrate the applications of these three soft X-ray spectroscopy techniques. We note that the technical details of these experiments could be different at different end-stations and/or facilities. Additionally, ex-situ and in-situ experiments have very different setup procedures on sample handling due to the stringent requirements of ultra-high vacuum for soft X-ray spectroscopy35. But the protocol here represents the typical procedure and could serve as a common reference for soft X-ray spectroscopy experiments in various experimental systems at different facilities.
Protocol
1. Experimental Planning
Note: While sXES could be performed with lab-based equipment, sXAS and RIXS are synchrotron-based experiments, which requires access to the beamtime of a synchrotron facility. The procedure for applying for beamtime and running experiments could be different at different facilities, but they all follow a similar basic procedure.
- Check the facility website for the beamline directory (e.g., https://als.lbl.gov/beamlines/), or contact the scientists in charge of the interested beamline(s) to determine the proper beamline for the scientific need.
- Submit beamtime proposals to the facility and beamline(s) of Advanced Light Source (ALS) through online submission system at https://als.lbl.gov/users/user-guide/.
NOTE: The beamtime proposal will be reviewed based on the policy of the synchrotron facility, and authors of successful proposals will be notified by the facility for experimental scheduling. - For safety controls, complete any necessary safety trainings according to the facility's requirements. Report chemicals, samples, and special equipment required by experiments, and get inspections to guarantee safety.
- Arrive at the facility ahead of the beamtime to get basic ideas on the experimental setup and sample loading, especially as new users to a facility/beamline.
2. Sample Preparation
- Synthesize the samples of the LIB and SIB materials, and electrochemically cycle to different state-of-charge (SOC).
- Perform the following steps for air-sensitive samples:
- Handle the air-sensitive samples without air exposure, i.e. open the sample containers, and cut the samples with scissors and tweezers into a size fitting the experimental system under an inert gas environment.
- Mount the samples with an appropriate size onto sample holders by using double-sided conductive tape under an inert gas environment.
NOTE: If Carbon or Oxygen edges are to be measured, use soft metals such as Indium for sticking the powder samples on, to avoid background C and O signals from the organic compounds in conductive tape.
- Perform the following steps for non-air-sensitive samples:
- Cut the samples to match the specific sample holder for experimental systems.
- Mount the samples with the appropriate size onto sample holders by using double-sided conductive tape. Use indium foil if collecting Carbon and Oxygen signals of power samples.
- For in-situ samples, prepare In-situ samples with specific cells that typically implement soft X-ray membrane. Check electric connections and cell integrity before loading into the experimental system.
NOTE: Details about in-situ cells are out of the scope of this work, but can be found in previous publications35,36,37.
3. Loading and Positioning Samples
Note: Due to the requirement of ultra-high vacuum for soft X-ray spectroscopy experiments, sample loading typically takes multiple steps to go through a buffer vacuum chamber before entering the main experimental chamber.
- Stop vacuum pumps, close vacuum valve between the sample loadlock and main experimental chamber, and vent the sample loadlock, which is typically attached directly to the experimental system with N2 gas.
- Use home-made sample grabber or a big tweezer to grab the sample holder and load it into loadlock.
- Start pumping the loadlock. Wait until the vacuum pressure gauge shows low enough vacuum for opening the loadlock into main experimental chamber, typically around mid 10-7 Torr.
- Open the valve between the loadlock and the main chamber. Transfer the sample holder onto the main manipulator of the main chamber by using the transfer arm.
- Open the valve between the main experimental chamber and the beamline. Determine the beam spot by looking at a reference sample with visible-light fluorescence.
- Position the sample to the beam spot by changing the coordinates of the sample manipulator of the experimental endstation.
4. Set Up the X-ray Energy and Resolution
- Change the values of the slits of the beamline monochromator, through the computer program or a manual adjustment knob, to control the energy resolution of the incident X-ray beam.
- Set the incident beam energy to the desired value for accessing the absorption edge of the interested element(s), e.g., 290 eV for C-K, 530 eV for O-K edges38.
- Connect the signal cables of the X-ray beam flux (I-0) monitor, which is typically a clean Gold mesh in the beam route.
- Fix the beamline monochromator mechanism and collect the beam flux intensity upon the undulator gap. Determine a particular undulator gap value for the maximum possible beam flux.
NOTE: Because sXAS requires a large energy range for different edges, an optimization of the undulator gap to obtain the maximum possible beam flux is often necessary.
5. Collect sXAS Data
Note: Total yield sXAS data are collected by recording the intensity of signals from both the sample current (TEY) and the channeltron or photodiode (TFY). Partial yield signals are typically collected through a gated channeltron and solid-state detector. Because the RIXS system is introduced here, and RIXS covers all kinds of partial fluorescence yield (PFY) signals, including PFY and inverse-PFY (iPFY), only the typical protocol for TEY and TFY data collection is described in this session.
- Connect the sample to the current amplifier, and feed the sample current signal (TEY) to the computer counter.
- Turn on power supplies and controllers of the channeltron or photodiode, feed the TFY signal to the computer counter.
- Start the LabVIEW sXAS data acquisition grogram BL Control Main to arrive at the software interface (Figure 2), and then click the menu button Scanning | Single Motor Scan (Figure 2).
- Click the menu button Scan Setup (Figure 3) to setup the scan range of the incident (beamline) X-ray photons to match the interested sXAS edge, e.g., 280-300 eV for C-K edge.
- Click the button Start Scan (Figure 3) to record the intensity signals from (i) the TEY (ii) the TFY, and (iii) the I-0 channels simultaneously while scanning the incident X-ray photon energy.
NOTE: Usually there would be a little shift of several eV on the incident X-ray photon energy. For calibration, collect the sXAS data of one or more typical reference samples before collecting the battery material samples.
6. Collect sXES and RIXS Data
Note: Because sXES is technically one of the RIXS cut at the non-resonant (high) energy range, the data collection equipment and process are essentially the same.
- Collect sXAS first to define the excitation energy range and calibrate the energy values (refer to protocol step 5).
- Turn on the power supply of the spectrometer detector of the sXES/RiXS system, and cool down the soft X-ray detector to reduce the background noise, per manufacturer's recommendations.
- Start the LabVIEW sXES/RiXS data acquisition grogram BL Control Main to arrive at the software interface (Figure 4).
- Click the menu button Motors (Figure 4) to set the optical parameters of the spectrograph so the detector covers the energy range of the interested elements and edges (Figure 5).
- Click the menu button Scanning (Figure 4) | CCD Instrument Scan (Figure 6).
- Click the menu button Scan Setup (Figure 6) to setup the scan range of the incident (beamline) X-ray photon energy. If collecting sXES, set it to a single value that is about 20-30 eV above the sXAS absorption edge; else, if collecting RiXS, set the incident X-ray (beamline) energy to a range that covers the sXAS absorption edge.
- Select the icon Apply Cosmic Ray Filter (Figure 6) to remove the cosmic ray signals from the raw RIXS 2D images, once they are collected from the spectrograph detector.
- Click the button Start Scan (Figure 6) to collect the fluorescence signals, which were diffracted and energy-resolved by optical grating, in the form of a 2D image by the detector on the spectrograph for each excitation energy.
7. sXAS Data Process
NOTE: The experimental data, including sXAS as well as sXES and RiXS, is processed in Igor Pro program.
- Normalize sXAS TEY and TFY signals to the I-0 signals that are collected simultaneously.
- Calculate the energy error between the collected sXAS of the reference samples with the standard; calibrate sXAS signals by shifting the energies according to the calculated energy error.
8. sXES and RIXS Data Process
- Integrate the intensity of the raw 2D image by summing up the photon counts along the angle-adjusted emission-energy channels to generate a single sXES or RIXS spectrum.
- Normalize the integrated 1D RIXS spectrum to both the incident beam flux monitored in real-time during the data collection, and the collection time (in seconds).
- Plot the normalized 1D spectrum in color-scaled format.
- For RiXS data, repeat steps 8.1-8.3 for each excitation energy to obtain a series of 1D RIXS spectra upon emission-energy channels; then, stack all the color-scaled 1D RIXS spectra one-by-one into a 2D image map, with one axis along excitation energy, another axis showing the emission-energy channels.
- Calibrate the values of excitation energy of the sXES spectrum or RIXS maps by using sXAS calibration, typically through reference samples (refer to Protocol step 7.2).
- Select a set of points (x = channel number, y = energy value) along the elastic features on the RIXS map, where the excitation and emission energies are the same; conduct linear curve fitting with the set of points to attain the formal energy value per channel; according to the relation, rescale the x axis from channel to energy.
Representative Results
The sample holder and pasted samples are shown in Figure 1. Figure 7a is a typical RIXS image collected at a particular excitation energy with the spectrometer set to the interested edges. The image shown here was collected on a battery electrode material, LiNi0.33Co0.33Mn0.33O2, with an excitation energy of 858 eV and the detector set at about 500-900 eV range to cover the energy range of O-K, Mn-L, Co-L, and Ni-L, as indicated in Figure 7a. Each peak on the 1D spectrum corresponds with one feature on the 2D map, which represents the occupied state of one specific element in the material. With the ultra-high efficiency of the newly commissioned iRIXS endstation34, a full range sXES covering all these edges could be collected in 10 s with decent statistical results (Figure 7b). This enables a high throughput experiment for chemical analysis of battery materials.
Figure 8 displays an example of the technical process for generating a Ni L-edge RIXS map of LiNi0.33Co0.33Mn0.33O2. This example shows the procedure for how to process the raw RIXS image into one cut of the final RIXS map, and how the protocol described in this work is implemented. By using this new high efficiency iRIXS system, collecting RIXS maps of TM L-edges with fine excitation energy steps in a reasonably short time has become feasible. Additionally, the large energy window of the spectrograph makes possible a wide energy range RIXS mapping to include multiple emission features from different elements. Two types of absorption spectra could be attained through such RIXS maps: partial fluorescence yield (PFY) and inverse partial fluorescence yield (iPFY)39. Note that iPFY is a bulk PIPO probe with signals corresponding directly to the intrinsic absorption coefficient39. Such information is a by-product of the RIXS mapping with high energy resolution. Detailed analysis of the Ni RIXS results of LiNi0.33Co0.33Mn0.33O2 shows that the Ni-L RIXS features are dominated by the excitations between the 3d states, the so-called "d-d excitations". PFY, iPFY, and conventional TEY and TFY signals were simultaneously collected while RIXS maps were collected for detailed chemical state analysis34.
Figure 9 shows three select examples of quantitative analysis of the TM redox states based on sXAS of Mn, Fe, and Ni in various battery cathodes for LIBs and SIBs10,27. Figures 9a–b show the quantitative analysis of Mn L-edge soft XAS on a series of Na0.44MnO2 electrodes cycled to different SOCs21. The solid lines are experimental spectra, and the dotted lines are simulated ones. Simulations were done by linearly combining the three reference spectra of Mn2+, Mn3+, and Mn4+22,40, with two variables of the concentration percentage of the Mn states, i.e., total concentration equals to 100%. All the high-resolution features in the measured sXAS spectra were reproduced by this linear-combination simulation, and thus the surface Mn valence distribution at different SOCs could be quantitatively determined. Details on scientific discussions and the quantitative values of the fitted results are presented in the Figure 3b-d in 21. Figures 9c-d demonstrate another perfect quantitative combination of the sXAS data collected on LixFePO4 electrodes at different SOCs. The sXAS spectra of the two end states, i.e., variables: (x)LiFePO4 and (1-x)FePO4, were used as the benchmarks for the quantitative fitting of the experimental and possible spectra (solid lines). The intermediate SOCs were precisely attained, with fitting results marked directly in (d)24. Figures 9e–f show the comparison of the theoretically calculated Ni2+, Ni3+, and Ni4+ TFY spectra with experimental ones in TFY mode of the LiNi0.5Mn1.5O4 cathode material28.
By a linear combination of the calculated spectra (dotted spectra) of Ni2+, Ni3+, and Ni4+, the Ni L-edge sXAS measured on a series of different SOCs could be perfectly fitted (3 variables on concentration percentage with a sum of 100%)27. The theoretical multiplet calculation is consistent with the experimental result and proves the distinctive feature arising from the Ni3+ state, suggesting sequential redox reactions (Ni2+→Ni3+→Ni4+) determined by the single electron transfer mechanism. Because of the lack of experimental reference data of the Ni3+ XAS, theoretical calculations are used here for a quasi-quantitative fitting. Nonetheless, the scientific focus here was to experimentally reveal the single-charge-transfer redox reaction mechanism in LixNi0.5Mn1.5O4 electrodes, and the assignment of the Ni3+ peak thus provides unambiguous evidence28.
In general, these demonstrations showed the sensitivity of soft X-ray spectroscopy to the different oxidation (redox) states in SIB and LIB materials with inherent elemental sensitivities. Analysis based on soft X-ray spectroscopy could be carried out for different types of phase transformations and SOCs, with both surface and bulk sensitivities, and under in-situ/operando and ex-situ conditions. We also note that, although examples are not shown in this technical report, sXAS and RIXS results of low-Z elements, e.g., C, N, O, also provide critical information on the critical chemical states in battery compounds, as demonstrated in many previous publications 12,13,14,30,31.
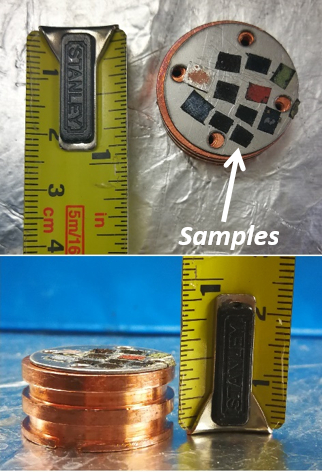
Figure 1: The sample holder and pasted samples. The sample holder is a copper cylinder with a height of 0.5 inches and a diameter of 1.0 inches. The samples are typically several mm in size. Please click here to view a larger version of this figure.
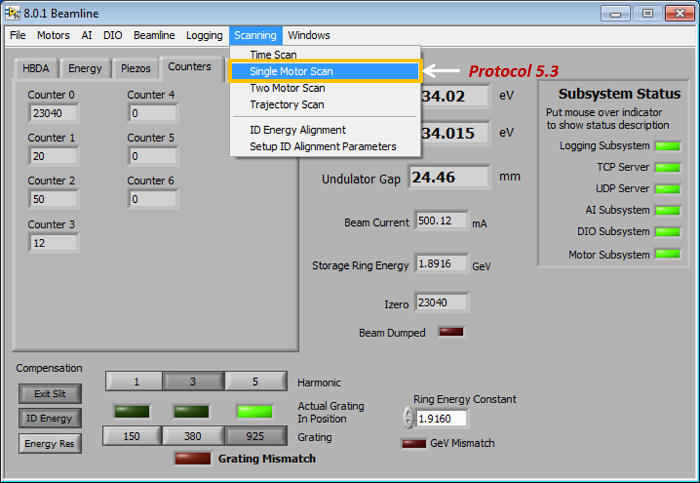
Figure 2: The main-interface for sXAS equipment control and data acquisition. Please click here to view a larger version of this figure.
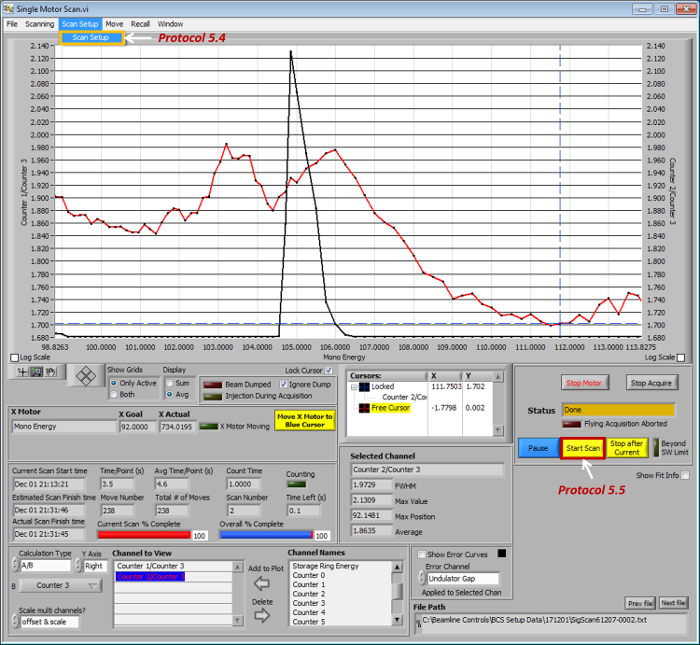
Figure 3: The sub-interface for sXAS data acquisition. Please click here to view a larger version of this figure.
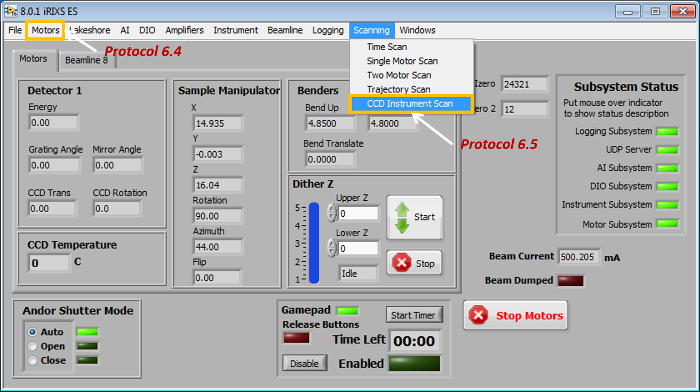
Figure 4: The main-interface for sXES/RiXS equipment control and data acquisition. Please click here to view a larger version of this figure.
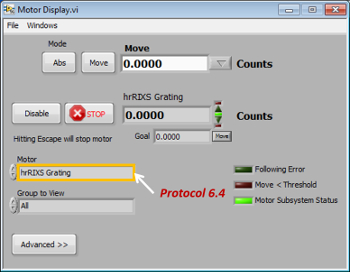
Figure 5: The sub-interface for sXES/RiXS equipment control. Please click here to view a larger version of this figure.
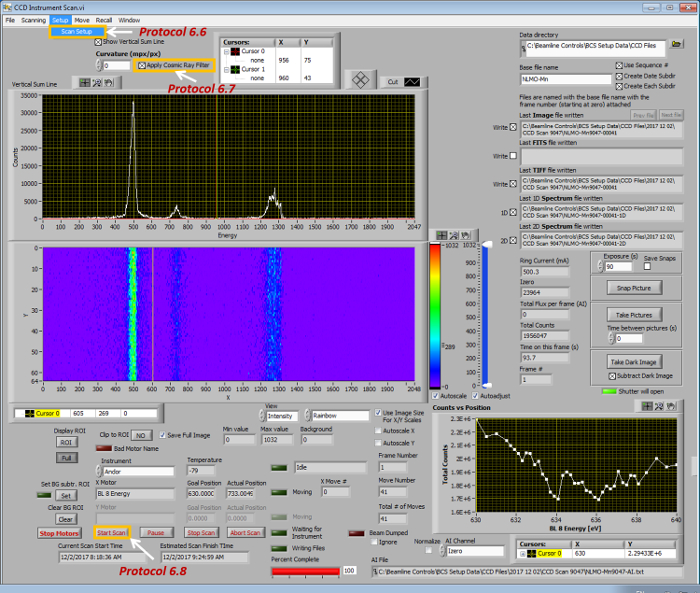
Figure 6: The sub-interface for sXES/RiXS data acquisition. Please click here to view a larger version of this figure.
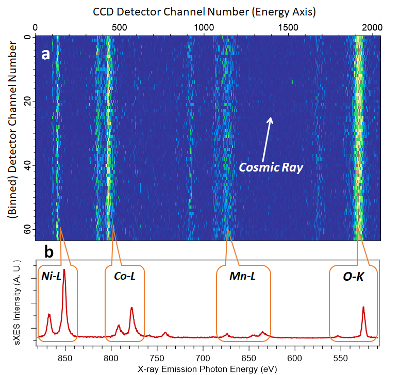
Figure 7: Ultra-high efficiency sXES spectrum of the O-K, Mn-L, Co-L and Ni-L edges of LIB electrode material LiNi0.33Co0.33Mn0.33O2. (a) This shows a typical 2D image collected through a RIXS spectrometer with a 858 eV excitation (beamline) energy. (b) This displays the sXES spectra of all the edges involved in LiNi0.33Co0.33Mn0.33O2 electrode materials. The spectrum shown here was taken in 10 s with 900 eV excitation energy with all the edges collected simultaneously. Please click here to view a larger version of this figure.
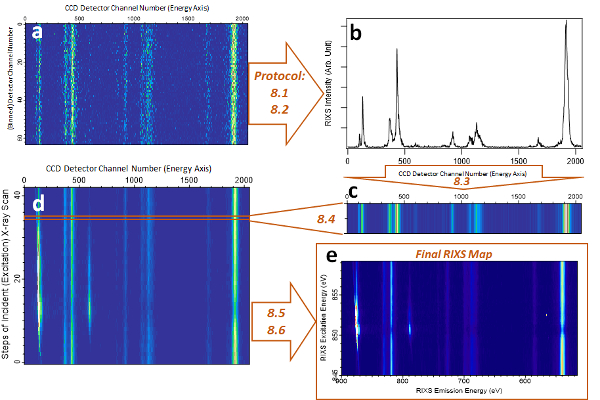
Figure 8: Schematic and demonstration of RIXS map @!!ping of Ni-L RIXS of LiNi0.33Co0.33Mn0.33O2 electrode material. (a) Raw RIXS image data collected at a particular excitation energy. (b) Integrated RIXS spectrum with one particular excitation energy after angle adjustment and intensity integration. (c) The spectral intensity is plotted in color scale as one of the cuts for the RIXS map in (d). (e) shows a typical RIXS map of Ni L-edge after all the data processing steps. Scientific analysis is typically done by zooming in on the particular emission energy range of such a map. Protocol numbers introduced in this work are marked in the figure. Please click here to view a larger version of this figure.
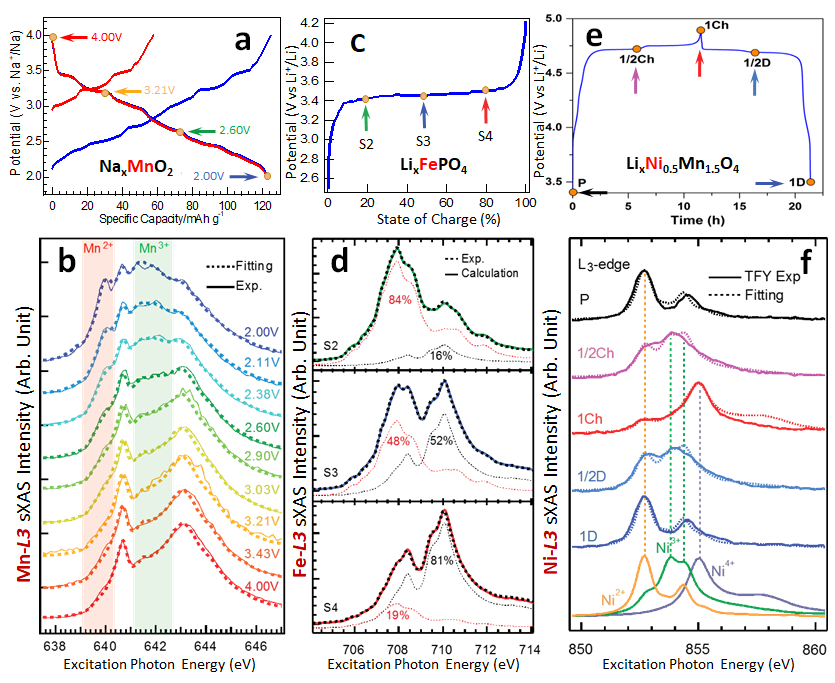
Figure 9: Demonstrations of quantitative analysis of TM redox couples in battery electrodes based on sXAS. In all panels, solid lines are experimental data, and dotted spectra are simulation results. (a) Na0.44MnO2 electrode cycled to different electrochemical states, and (b) the quantitative analysis of Mn L-edge sXAS. (c) LixFePO4 electrode cycled to different SOCs, and (d) the quantitative fitting of the sXAS data. (e) LiNi0.5Mn1.5O4 electrode within the first electrochemical cycle, and (f) the quantitative fitting of the Ni-L sXAS through the comparison between experimental data and calculated Ni2+, Ni3+ and Ni4+ spectra. This figure has been modified from Lin, F et al. Why LiFePO4 is a safe battery electrode: Coulomb repulsion induced electron-state reshuffling upon lithiation.11 Please click here to view a larger version of this figure.
Discussion
The formidable challenge of improving the performance of energy storage materials requires advances of incisive tools to directly probe the chemical evolutions in battery compounds upon electrochemical operation. Soft X-ray core-level spectroscopy, such as sXAS, sXES, and RIXS, is a tool-of-choice for detecting the critical valence states of both the anions and cations involved in LIBs and SIBs.
Core-level spectroscopy techniques involve the strong excitation of core electrons to unoccupied states following the dipole selection rules. Compared with hard X-rays, the low energy of soft X-rays enables dipole-allowed 1s-2p excitations for low-Z anion elements, such as C, N, and O K-edges, as well as the 2p-3d excitations for 3d TM elements. The strong dipole-allowed excitations make soft X-ray techniques unique for directly probing the valence states of the 2p states in anions, and 3d states in cations, of battery materials.
With recent developments in soft X-ray spectroscopy instrumentation, sXAS, sXES and RIXS experiments can be performed at unprecedented efficiency, revealing both the conduction-band (sXAS) and valence-band (sXES) states in the vicinity of the Fermi level. This work provides a general protocol for typical sXAS, sXES, and RIXS experiments. We cover common procedures of data collection and analysis of these techniques without involving too many specific details of a particular experimental endstation.
We demonstrate that, due to the high sensitivity to the TM valence states in battery materials, sXAS could be used for a quantitative analysis of the chemical state of TMs in battery electrodes in different electrochemical states. We also showcase that state-of-the-art high-effeciency sXES could be performed in a much faster speed now, compared with conventional sXAS and XPS experiments that are popular for chemical analysis. Additionally, RIXS mapping of interested elements could provide much more detailed information on the specific electron state configuration because RIXS reveals the correlation between different states through low-energy excitations. Particularly for revealing the chemical states in battery materials, RIXS provides additional sensitivity by uncovering the underlying decay process beyond sXAS. Because of the extra dimension of the emission energy, the low energy excitations in RIXS results often correspond to specific chemical information that does not manifest in sXAS experiments31. This is critical for studying some novel valence state that cannot be reliably probed by sXAS, especially on the recently proposed anionic redox in batteries6.
While sXAS has been extensively employed for studying LIB and SIB materials, and these presented demonstrations have shown that high-quality sXAS results can be quantitatively analyzed for TM states. However, sXES and RIXS have seen only limited applications in the field of energy storage materials. This work shows that the barrier of the low statistic in these PIPO experiments has been broken through by state-of-the-art RIXS instrumentations34. Still, establishing a reliable data set of sXES and RIXS is required for detailed data analysis. In the meantime, theoretical interpretation of RIXS in a complex real-world system remains challenging for a complete understanding of RIXS features. Nonetheless, the last two decades have witnessed rapid progress on the technical development of RIXS in both efficiency and resolution, and we expect that this fundamental physics tool will soon be employed for tackling the critical challenges for understanding and optimizing energy storage materials.
Disclosures
The authors have nothing to disclose.
Acknowledgements
The Advanced Light Source (ALS) of the Lawrence Berkeley National Laboratory (LBNL) is supported by the Director, Office of Science, Office of Basic Energy Sciences, of the U.S. Department of Energy under Contract No. DE-AC02-05CH11231. Q.L. thanks the China Scholarship Council (CSC) for financial support through the collaboration based on China 111 project No. B13029. R.Q. thanks the support from LBNL LDRD program. S.S. and Z.Z. thank the support from the ALS Doctoral fellowship.
Materials
| Material | |||
| Electrode active materials | various | Synthesized in-house or obtained from various suppliers. | |
| Lithium foil | Sigma-Aldrich | 320080 | Anode for half cells. Store and handle in an inert atmosphere glovebox under Ar. (www.sigmaaldrich.com) |
| Sodium foil | Sigma-Aldrich | 282065 | Anode for half cells. Store and handle in an inert atmosphere glovebox under Ar. (www.sigmaaldrich.com) |
| Electrolyte solutions | BASF | Contact vendor for desired formulations | http://www.catalysts.basf.com/p02/USWeb-Internet/catalysts/en/content/microsites/catalysts/prods-inds/batt-mats/electrolytes |
| Synthetic flake graphite | Timcal | SFG-6 | Conductive additive for electrodes. (www.timcal.com) |
| Indium foil | Sigma-Aldrich | 357308 | Used if collecting Carbon and Oxygen signals of power samples |
| Argon gas | Air Products | Custom order, contact vendors | Argon used to fill glovebox where to assemble and store air-sensitive samples. (http://www.airproducts.com/products/gases.aspx) |
| Eqiupment | |||
| CCD | iKon-L | DO936N | Used to capture the emission photons when carrying out the sXES or RiXS experiment (http://www.andor.com/scientific-cameras/ikon-xl-and-ikon-large-ccd-series/ikon-l-936) |
| Inert atmosphere glovebox | MBRAUN | MB200B | Used during air-sensitive samples assembly and storage. (http://www.mbraun.com/products/glovebox-workstations/mb200b-mod) |
| Battery Charge & Discharge Tester | Bio-Logic | VMP3 | Used to electrochemical cycling of battery materials. (https://www.bio-logic.net/en/) |
| Swagelok cell | MTI | EQ-HSTC | Used to contain the battery for electrochemical cycling |
| Sample holder | manufactured in lab | Used to hold the samples in the experiment | |
| Hardware tools | various | Including tweezers, scissors (used to assemble samples), tongs (used to transfer sample holders), etc. | |
| Carbon and Copper tape | 3M | Custom order, contact vendors | Used to paste the samples onto sample holders |
| Igor Pro | WaveMetrics | 7.06 | Used to process the experiment data. (https://www.wavemetrics.com/index.html) |
References
- Armand, M., Tarascon, J. M. Building better batteries. Nature. 451 (7179), 652-657 (2008).
- Yang, Z., et al. Electrochemical energy storage for green grid. Chem Rev. 111 (5), 3577-3613 (2011).
- Dunn, B., Kamath, H., Tarascon, J. M. Electrical energy storage for the grid: a battery of choices. Science. 334 (6058), 928-935 (2011).
- Ellis, B. L., Lee, K. T., Nazar, L. F. Positive Electrode Materials for Li-Ion and Li-Batteries. Chemistry of Materials. 22 (3), 691-714 (2010).
- Goodenough, J. B., Kim, Y. Challenges for Rechargeable Li Batteries. Chemistry of Materials. 22 (3), 587-603 (2009).
- Grimaud, A., Hong, W. T., Shao-Horn, Y., Tarascon, J. M. Anionic redox processes for electrochemical devices. Nat Mater. 15 (2), 121-126 (2016).
- Wanli Yang, R. Q. Soft x-ray spectroscopy for probing electronic and chemical states of battery materials. Chin. Phys. B. 25 (1), 17104 (2016).
- Yang, W., et al. Key electronic states in lithium battery materials probed by soft X-ray spectroscopy. Journal of Electron Spectroscopy and Related Phenomena. 190, 64-74 (2013).
- Qiao, R., Yang, W. Interactions at the electrode-electrolyte interfaces in batteries studied by quasi-in-situ soft x-ray absorption spectroscopy. Journal of Electron Spectroscopy and Related Phenomena. , (2017).
- Lin, F., et al. Synchrotron X-ray Analytical Techniques for Studying Materials Electrochemistry in Rechargeable Batteries. Chem Rev. , (2017).
- Liu, X., et al. Why LiFePO4 is a safe battery electrode: Coulomb repulsion induced electron-state reshuffling upon lithiation. Phys Chem Chem Phys. 17 (39), 26369-26377 (2015).
- Liu, G., et al. Polymers with tailored electronic structure for high capacity lithium battery electrodes. Adv Mater. 23 (40), 4679-4683 (2011).
- Wu, M., et al. Toward an Ideal Polymer Binder Design for High-Capacity Battery Anodes. Journal of the American Chemical Society. 135 (32), 12048-12056 (2013).
- Wang, L., et al. Rhombohedral prussian white as cathode for rechargeable sodium-ion batteries. J Am Chem Soc. 137 (7), 2548-2554 (2015).
- Qiao, R., et al. Distinct Solid-Electrolyte-Interphases on Sn (100) and (001) Electrodes Studied by Soft X-Ray Spectroscopy. Advanced Materials Interfaces. 1 (100), (2014).
- Shan, X., et al. Bivalence Mn5O8 with hydroxylated interphase for high-voltage aqueous sodium-ion storage. Nat Commun. 7, 13370 (2016).
- Qiao, R., Chuang, Y. D., Yan, S., Yang, W. Soft x-ray irradiation effects of Li(2)O(2), Li(2)CO(3) and Li(2)O revealed by absorption spectroscopy. PLoS One. 7 (11), 49182 (2012).
- Bak, S. -. M., et al. Na-Ion Intercalation and Charge Storage Mechanism in 2D Vanadium Carbide. Advanced Energy Materials. , 1700959 (2017).
- Zhuo, Z., et al. Effect of excess lithium in LiMn2O4 and Li1.15Mn1.85O4 electrodes revealed by quantitative analysis of soft X-ray absorption spectroscopy. Applied Physics Letters. 110, 093902 (2017).
- Qiao, R., et al. Transition-metal redox evolution in LiNi 0.5 Mn 0.3 Co 0.2 O 2 electrodes at high potentials. Journal of Power Sources. 360, 294-300 (2017).
- Qiao, R., et al. Revealing and suppressing surface Mn(II) formation of Na0.44MnO2 electrodes for Na-ion batteries. Nano Energy. 16, 186-195 (2015).
- Qiao, R., et al. Direct evidence of gradient Mn(II) evolution at charged states in LiNi0.5Mn1.5O4 electrodes with capacity fading. Journal of Power Sources. 273, 1120-1126 (2015).
- Wu, J., et al. Modification of Transition-Metal Redox by Interstitial Water in Hexacyanometallate Electrodes for Sodium-Ion Batteries. Journal of the American Chemical Society. , (2017).
- Liu, X., et al. Phase Transformation and Lithiation Effect on Electronic Structure of LixFePO4: An In-Depth Study by Soft X-ray and Simulations. Journal of the American Chemical Society. 134 (33), 13708-13715 (2012).
- Liu, X., et al. Distinct charge dynamics in battery electrodes revealed by in situ and operando soft X-ray spectroscopy. Nat Commun. 4, 2568 (2013).
- Zhuo, Z., Hu, J., Duan, Y., Yang, W., Pan, F. Transition metal redox and Mn disproportional reaction in LiMn0.5Fe0.5PO4 electrodes cycled with aqueous electrolyte. Applied Physics Letters. 109 (2), 023901 (2016).
- Li, Q., et al. Quantitative probe of the transition metal redox in battery electrodes through soft x-ray absorption spectroscopy. Journal of Physics D: Applied Physics. 49 (41), 413003 (2016).
- Qiao, R., et al. Direct Experimental Probe of the Ni(II)/Ni(III)/Ni(IV) Redox Evolution in LiNi0.5Mn1.5O4Electrodes. The Journal of Physical Chemistry C. 119 (49), 27228-27233 (2015).
- Pasta, M., et al. Manganese-cobalt hexacyanoferrate cathodes for sodium-ion batteries. J. Mater. Chem. A. 4 (11), 4211-4223 (2016).
- Jeyachandran, Y. L., et al. Investigation of the Ionic Hydration in Aqueous Salt Solutions by Soft X-ray Emission Spectroscopy. J Phys Chem B. 120 (31), 7687-7695 (2016).
- Jeyachandran, Y. L., et al. Ion-Solvation-Induced Molecular Reorganization in Liquid Water Probed by Resonant Inelastic Soft X-ray Scattering. The Journal of Physical Chemistry Letters. 5 (23), 4143-4148 (2014).
- Fuchs, O., et al. High-resolution, high-transmission soft x-ray spectrometer for the study of biological samples. Rev Sci Instrum. 80 (6), 063103 (2009).
- Chuang, Y. -. D., et al. Modular soft x-ray spectrometer for applications in energy sciences and quantum materials. Review of Scientific Instruments. 88 (1), 013110 (2017).
- Qiao, R., et al. High-efficiency in situ resonant inelastic x-ray scattering (iRIXS) endstation at the Advanced Light Source. Review of Scientific Instruments. 88 (3), 033106 (2017).
- Liu, X., Yang, W., Liu, Z. Recent Progress on Synchrotron-Based In-Situ Soft X-ray Spectroscopy for Energy Materials. Adv Mater. 26 (46), 7710-7729 (2014).
- Guo, J. The development of in situ photon-in/photon-out soft X-ray spectroscopy on beamline 7.0.1 at the ALS. Journal of Electron Spectroscopy and Related Phenomena. 188, 71-78 (2013).
- Blum, M., et al. Solid and liquid spectroscopic analysis (SALSA)-a soft x-ray spectroscopy endstation with a novel flow-through liquid cell. Review of Scientific Instruments. 80 (12), 123102 (2009).
- Williams, G. P. . X-RAY DATA BOOKLET. , (2009).
- Achkar, A. J., et al. Bulk sensitive x-ray absorption spectroscopy free of self-absorption effects. Physical Review B. 83 (8), 081106 (2011).
- Qiao, R., Chin, T., Harris, S. J., Yan, S., Yang, W. Spectroscopic fingerprints of valence and spin states in manganese oxides and fluorides. Current Applied Physics. 13 (3), 544-548 (2013).

