Quantifying Drosophila melanogaster Eye Phenotypes: A Computational Approach Integrating ilastik and Flynotyper
Summary
The Drosophila eye system is a useful tool for studying various biological processes, particularly human neurodegenerative diseases. However, manual quantification of rough eye phenotypes can be biased and unreliable. Here we describe a method by which ilastik and Flynotyper are used to quantify eye phenotype in an unbiased way.
Abstract
The Drosophila melanogaster compound eye is a well-structured and comprehensive array of around 800 ommatidia, exhibiting a symmetrical and hexagonal pattern. This regularity and ease of observation make the Drosophila eye system a powerful tool to model various human neurodegenerative diseases. However, ways of quantifying abnormal phenotypes, such as manual ranking of eye severity scores, have limitations, especially when ranking weak alterations in eye morphology. To overcome these limitations, computational approaches have been developed such as Flynotyper. The use of a ring light allows for better qualitative images accessing the intactness of individual ommatidia. However, these images cannot be analyzed by Flynotyper directly due to shadows on ommatidia introduced by the ring light. Here, we describe an unbiased way to quantify rough eye phenotypes observed in Drosophila disease models by combining two software, ilastik and Flynotyper. By preprocessing the images with ilastik, successful quantification of the rough eye phenotype can be achieved with Flynotyper.
Introduction
The Drosophila melanogaster genome contains ~75% of human disease-related gene orthologs. Additionally, during Drosophila eye development, approximately two-thirds of the genes in the genome are expressed, making the Drosophila eye an outstanding genetic system to investigate various molecular and cellular functions, development, and disease models1,2. Thus, the Drosophila eye system is a useful experimental tool to study various biological processes.
The Drosophila compound eye is a well-structured and comprehensive array of ~800 ommatidia that exhibit a symmetrical and hexagonal pattern3. The regularity of this hexagonal pattern can be used to estimate the effect of introducing mutations and gene expression changes in eye morphology4. Previous studies that require evaluation of eye morphology have heavily relied on manual ranking of the severity of eye phenotypes detected by the naked eye. To rank the eye phenotypes, external eye morphology images are taken by a stereomicroscope5,6. The eye phenotype of each group is assessed by splitting the external eye into four areas and calculating the proportion of degeneration in each area5,6. Then, the values are used to calculate averages that are compared with the values obtained from control flies7. The scoring is based on the extent of fusion, loss of ommatidia, and bristle organization7,8. Fly eye photos taken with a stereomicroscope are acquired by one researcher, and the eye phenotype analysis is performed by another researcher with triple validation sets7,8.
When it comes to ranking weak alterations in eye morphology with the naked eye, there are limitations4. To overcome these limitations, computational approaches such as FLEYE and Flynotyper have been developed1,9. Flynotyper is a novel computational method for quantitatively estimating morphological changes in the Drosophila eye system1. It automatically detects the Drosophila eye and individual ommatidium, calculating Phenotypic Scores (P-Scores) based on the irregularity of theeye1. A higher P-Score indicates the fly eye is more degenerated. This software was successfully used in quantifying the abnormality of Drosophila eyes10. Although Flynotyper ensures an automated process, it still cannot be successfully applied to some eye images taken by various light microscopy methods.
Qualitatively, we prefer a ring light source compared to a single-point light source, as it offers a more accurate representation of each ommatidium. However, when the ring light is used, it generates a ring-shaped shadow at the top of each ommatidium due to the hemispherical shape of the ommatidium. This ring-shaped shadow inhibits accurate ommatidial detection by Flynotyper, leading to incorrect calculation of P-Scores.
To overcome these issues, we implemented ilastik, a machine learning-based tool for various analyses, to classify ommatidia in fly eye images11. We then fed the ilastik-generated images into Flynotyper to calculate P-Scores. This allows us to quantify the Drosophila eye morphological defects unbiasedly1.
Protocol
1. Preparing for quantification
- Download and install ilastik11, ImageJ, and the ImageJ plugin Flynotyper1. See Table of Materials for website links to installation. Download the appropriate packages according to the computer operating system (Mac, Windows, Linux, etc). Follow the installation instructions exactly as stated.
NOTE: Following the directions exactly as stated in the provided links is imperative. The computer used needs a 64-bit operating system; otherwise, there are no other required specifications. See the Table of Materials for the computer specifications of the system used for this protocol. - Use a standard image to train the machine learning model. Take an image of a healthy fly eye using a light microscope with a ring light (such as w1118 x GMR-GAL4), using the center of the eye as the focal point. Analyze males and females separately; therefore, acquire a standard image for males and for females.
NOTE: Settings will vary widely depending on the microscope and camera. See the second paragraph in the discussion for more general information on fly preparation and image acquisition. - Take images of the experimental fly eyes using the same settings used for the standard image acquisition.
NOTE:Good orientation is paramount for accurate quantification. See Figure 4 as an example for proper orientation.
2. Using ilastik to detect ommatidia from fly eye images
- Before starting analysis, make sure all experimental groups, regardless of experimental condition, are in the same file folder to make the following processes easier. Make sure files are named appropriately to identify experimental groups and distinguish between males and females.
NOTE: We recommend printing out the protocol and using the computer to zoom in on figures, as this protocol is most easily followed visually. - Open the software.
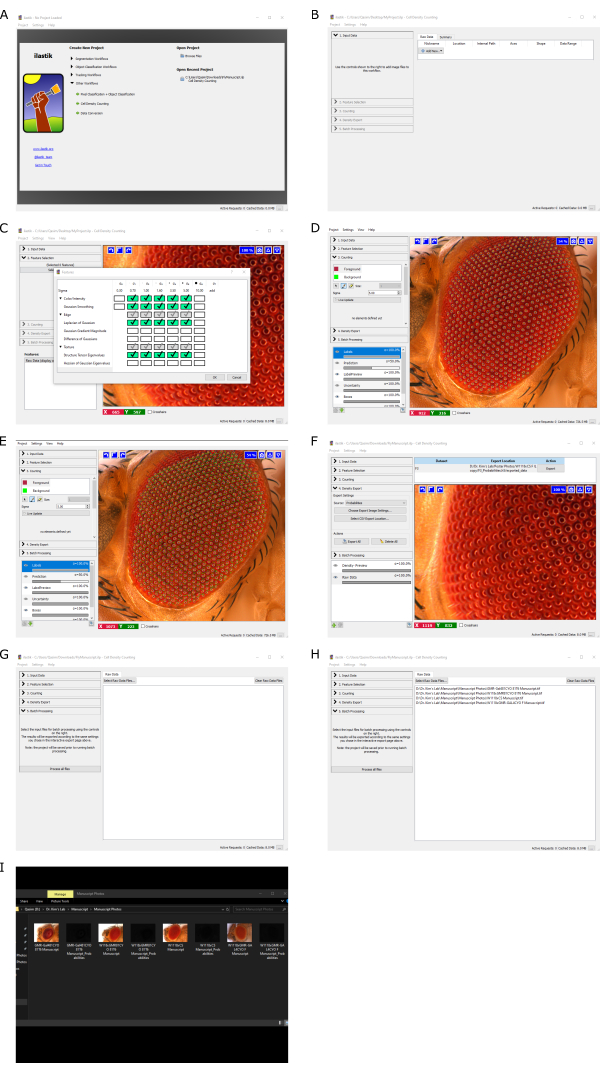
NOTE: It is advised not to have other applications open while running the software; otherwise, the computer might run very slowly, particularly in older or less robust systems. - Click on Create New Project | Other Workflows, choose Cell Density Counting, and select a location to save the project file (Figure 1A).
- Click on 1. Input Data | Add New | Add Separate Image(s). Choose the standard image (Figure 1B).
- Click on 2. Feature Selection and select features to use. Select the features shown in Figure 1C; choose more sigma values to increase sensitivity (i.e., 10, 15, 20, etc).
NOTE: If too many boxes are checked, the program might run for a long time. - Click on 3. Counting and set the Foreground sigma value to 5.00. Mark 50 or more individual ommatidium using the Foreground tool on the standard image.
NOTE: Fifty markings are typically adequate for analysis; however, the more ommatidia marked, the more accurate the results will be (Figure 1D). - Click on 3. Counting and use the Background tool to mark the outside of the ommatidia (Figure 1E). Draw green lines in a lattice shape around the ommatidia.
NOTE: Similar to more markings on the ommatidia, the more green lines drawn, the more accurate the results will be. - Click on 4. Density Export | Choose Export Image Settings to set image settings (Figure 1F). Click on Output File Info | select Format and tif for further analysis in Flynotyper.
- Click on 5. Batch Processing | Select Raw Data Files and select all experimental fly photos to be analyzed (Figure 1G). The list of imported images to be analyzed is seen under Select Raw Data Files (Figure 1H). Click Process all Files at the bottom of the 5. Batch Processing section.
NOTE: As a reminder, male and female analyses should be done separately. Depending on the computer used, this step can take 10 min or longer, especially if there are many imported images. - After the software has finished, check the same file folder containing the experimental fly eye images; there will be black images named "YourSampleName_Probabilities" (Figure 1I).
3. Using ImageJ to prepare photos for Flynotyper
- Open the ilastik-generated .tif file (the black boxes) in ImageJ.
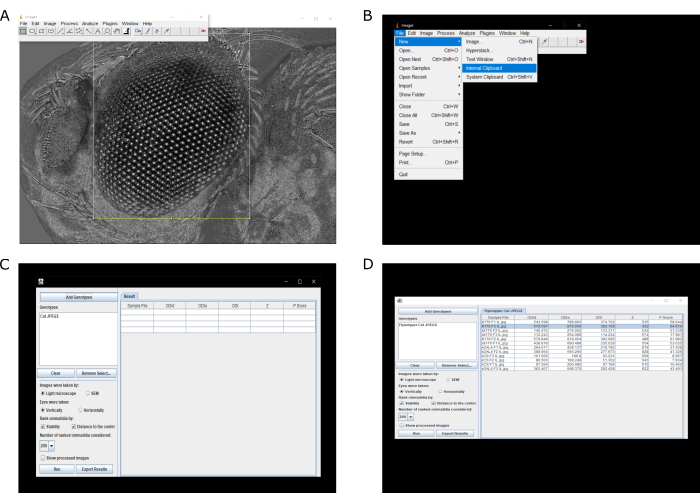
NOTE: Each ilastik generated .tif file needs to be handled separately. - Use the Rectangle Select tool to make a rectangle around just the eye. After the rectangle has been drawn, crop the area by either choosing Ctrl + X or Ctrl + C (Figure 2A). Wait for a black box in the shape of the rectangle outline to appear.
NOTE: The computer operating system will determine whether to use 'Ctrl + X' or 'Ctrl + C'. Usually, 'Ctrl + X' is for Windows and 'Ctrl + C' is used for Mac. - Open the now cut fly eye using ImageJ; click on File | New | Internal Clipboard (Figure 2B).
- Save the cut fly eye as a JPEG by clicking on File | Save As | Jpeg. The cut images are now in the same file folder as the original experimental images.
NOTE: To make the next step easier, it is recommended to create a new file folder called 'cut' and put all of the cut images into that folder.
4. Using Flynotyper to calculate phenotypic scores
- Open Flynotyper as an ImageJ plugin by clicking on Plugins | Flynotyper.
- Select Add Genotypes and open the folder containing the cut fly eye images (cut file folder). The folder name will appear under Genotypes (Figure 2C).
- Check the Light microscope and Vertically boxes but adjust accordingly if needed. Check Stability and Distance to the Center boxes under Rank Ommatidia by: (Figure 2C).
- For Number of ranked ommatidia considered, input 200.
NOTE: In general, 200 is a good number but adjust accordingly to preferences. - Click Run and wait for the results of the analysis to appear (Figure 2D).
NOTE: This step may take 5 min or longer (or shorter) depending on the processing power of the computer used. - Copy and paste the Sample File and P-Score into statistical software for further analysis.
Representative Results
In a previous study, we used this protocol to determine genetic modifiers of mutant VCP protein linked to amyotrophic lateral sclerosis with frontotemporal dementia (ALS-FTD)12. Additionally, this method was also used in another paper to assess the toxicity of CHCHD10S59L-mediated ALS-FTD, even when using an older stereomicroscope13. To further validate these results, we used ilastik and Flynotyper in the same ALS-FTD disease mutation as Baek et al.13; however, a non-trained laboratory personnel performed the experiment and obtained similar results. Thus, combining ilastik and Flynotyper is a robust method for unbiasedly scoring degeneration of the Drosophila ommatidia.
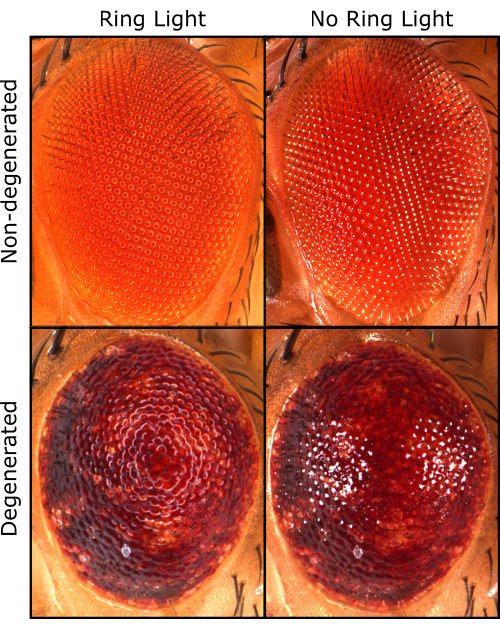
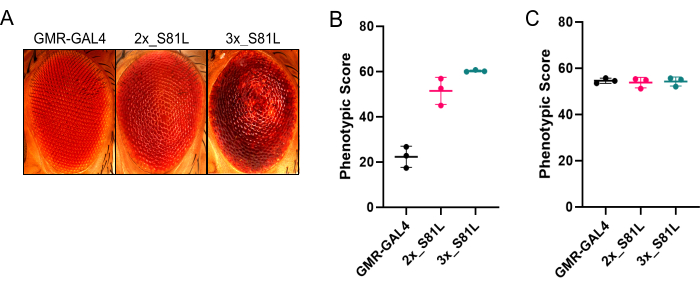
We prefer the use of a ring light because it allows better qualitative assessments (Figure 3). However, using a ring light causes a shadow that Flynotyper cannot directly analyze. To overcome this, we preprocessed the images in ilastik before quantifying P-Scores with Flynotyper. Overall, P-Scores of the non-degenerated (GMR-GAL4) fly eye were significantly lower compared to a moderately degenerated eye (2x_S81L) and a severely degenerated eye (3x_S81L) (Figure 4A,B and Table 1). This is the expected outcome, as higher P-Scores generated from Flynotyper indicate a more degenerated eye1. When ilastik was not used, there were negligible differences in P-Scores between a non-degenerated eye and a moderately degenerated eye (Figure 4C and Table 1). This suggests that Flynotyper struggles to accurately identify ommatidia patterns under ring light conditions without using ilastik. This is because Flynotyper is designed to use images taken with a dual-point light that is converted to grayscale with additional adjustments to identify the ommatidial center1. Ilastik replicates this process by incorporating a dot at the center of each ommatidium, enabling quantification within Flynotyper.

Figure 1: Example ilastik workflow. (A) Creating a new project in ilastik. (B) Choosing the standard image. (C) Selecting sigma values under Feature Selection. (D) Marking the foreground of ommatidia for sensitivity. (E) Marking the background of ommatidia for sensitivity. (F) Selecting how the software will export processed files. (G) Choosing which experimental fly eye images to be analyzed. (H) Showing which experimental fly eye images will be analyzed. (I) Finished product after running the software. Please click here to view a larger version of this figure.

Figure 2: Example Flynotyper workflow. (A) Selecting only the eye of the fly for further analysis. (B) Opening the cut eye image in a new window. (C) Selecting which cut images to be analyzed and the parameters to be checked for analysis. (D) Example results. Phenotypic scores are presented on the far right. Please click here to view a larger version of this figure.

Figure 3: Qualitative Drosophila eye images. The same fly eye taken with a ring light (left) and taken with a dual-point light (right) in non-degenerated (top) and degenerated (bottom) conditions. Please click here to view a larger version of this figure.

Figure 4: Using ilastik before Flynotyper for accurate quantification of the rough eye phenotype in Drosophila. (A) Representative Drosophila eye images of a non-degenerated eye (GMR-GAL4), a moderately degenerated eye (2x_S81L), and a severely degenerated eye (3x_S81L). (B) Quantification results from Flynotyper after using ilastik. P-values of a two-sided permutation t-test were calculated to help facilitate the interpretation of the results (GMR-GAL4 vs 2x_S81L: p = 0, GMR-GAL4 vs 3x_S81L: p = 0) (C) Quantification results from Flynotyper without using ilastik. P-values of a two-sided permutation t-test were calculated to help facilitate the interpretation of the results (GMR-GAL4 vs 2x_S81L: p = 0.597, GMR-GAL4 vs 3x_S81L: p = 0.687). N = 3 for each group. Data points are jittered or stacked on the x-axis for visual clarity. Solid horizontal line represents the average. Error bars represent standard deviation. Please click here to view a larger version of this figure.
| GMR-GAL4 | 2x_S81L | 3x_S81L | |||
| With ilastik | Without ilastik | With ilastik | Without ilastik | With ilastik | Without ilastik |
| 26.7 | 55.7 | 52.5 | 51.2 | 59.9 | 55.6 |
| 17.4 | 53.5 | 50 | 54.9 | 60.7 | 52 |
| 22.8 | 55.5 | 56.8 | 55.2 | 60.1 | 55.1 |
Table 1: P-Scores when using Flynotyper with ilastik and when using Flynotyper alone.
Supplemental Figure S1: Fly head mount set up for image acquisition. This is an example of how to set up for image acquisition using multiple sheets of paper. However, any method that ensures proper orientation of the head and fly eye can be used. Please click here to download this File.
Supplemental Figure S2: Quantitative results of ilastik and Flynotyper when using a sigma value of 2.5 under feature selection. Using a sigma value other than 5.0 under feature selection in ilastik can result in inaccurate quantification. Specifically, a sigma value of 2.5 results in a loss of sensitivity. P-values of a two-sided permutation t-test were calculated to help facilitate the interpretation of the results (GMR-GAL4 vs 2x_S81L: p = 0.192, GMR-GAL4 vs 3x_S81L: p = 0). N = 3 for each group. Data points are jittered or stacked on the x-axis for visual clarity. Solid horizontal line represents the average. Error bars represent standard deviation. Please click here to download this File.
Supplemental Figure S3: Loss of sensitivity and inaccurate P-Scores due to necrotic patches. White arrows are pointing to segments of necrotic patches. Please click here to download this File.
Supplemental Table S1: P-Scores when using a sigma value of 2.5 under feature selection. Please click here to download this File.
Discussion
The ommatidia of Drosophila comprise a useful system for studying various biological functions and genetic diseases. The regularity of ommatidia is a good measurement to examine the effect of genetic mutations4. Even though several methods for calculating ommatidial regularity exist, such as manual ranking, these methods can be heavily biased. To overcome this biased approach, semi-automatic tools have been developed1,11.
For accurate eye quantification, fly preparation and setup must be optimized. While we understand each lab is going to have their setup, we are providing the following setup in our lab to give readers an idea on how to prepare flies for image acquisition. Flies are frozen and stored at -80 °C. We used a sample size of 3 because, in our experience, when GMR-GAL4 is combined with the S81L mutation, there is very little variation among the population. However, keep in mind, the sample size should be adjusted to perform null-hypothesis significance testing. To mount the flies for image acquisition, the fly head rests on a very small sheet of paper that acts as a pillow so that the center of the eye is roughly the focal plane (Supplemental Figure S1). Our lab uses a Z-stack microscope and camera (see Table of Materials) as this produces overall clearer images, allowing for the best visualization of the entire eye since the fly eye is dome-shaped. However, the Z-stack function is not a requirement for this protocol as we successfully used this method with an older stereomicroscope without the Z-stack function13. The ring light dial for brightness is turned no more than ¼ of the way up to avoid overexposure. The total thickness of our samples ranges between 300 and 450 microns.
In this study, we showed that the analysis of fly eyes with ilastik and Flynotyper generates unbiased and reliable ommatidia quantification results. We analyzed Drosophila ommatidia patterns using ilastik, a machine-learning-based bioimage analysis tool, to mark ommatidia, and then Flynotyper, a computational method used for measuring ommatidia regularity1,11. We prefer to use a ring light to obtain images for better qualitative evaluation. However, this approach does not allow Flynotyper to produce quantitative results using these images. Therefore, ilastik is implemented to preprocess these images, and these processed images were successfully used with Flynotyper to produce quantitative results. When the images were not preprocessed with ilastik before Flynotyper, overall P-Scores were similar between nondegenerative and degenerative eyes. This highlights the importance of using ilastik first when implementing a ring light for quantitative results.
There are some limitations in our methods. Settings in ilastik can vary greatly and can result in nonsignificant data. For example, we performed another set of analyses using the same images but adjusted the foreground sigma value in ilastik to 2.5 instead of 5. This resulted in a loss of sensitivity in moderately degenerative phenotypes (Supplemental Figure S2 and Supplemental Table S1). Another limitation is the loss of sensitivity in the eyes with too much degeneration. Compared to a 3x_S81L eye, an eye with necrotic patches is qualitatively much more degenerated. However, the average P-Score for 3x_S81L eyes was 60.2, while the average P-score for the eyes with necrotic patches was 60.9. Thus, eyes with too much degeneration, such as necrotic patches, can also result in loss of sensitivity (Supplemental Figure S3).
A critical step of this protocol is the selection of an appropriate standard image, which is used to train ilastik. A non-degenerated standard image with a distinct contrast between the ommatidia and the surrounding pigment cells, such as red or orange eyes, will result in more accurate quantification in Flynotyper. Another critical step is Feature Selection in ilastik where sensitivity, represented as sigma values, are selected to fine-tune the machine learning software (Figure 1D). The selection of too few features can reduce the sensitivity of ilastik, leading to inaccurate marking of the ommatidia. The selection of too many features will increase the length of time and processing power required to generate results, lowering the efficiency of the procedure. Alternatively, if there is noticeable qualitative degeneration of the eye, but analysis results are not statistically significant, increasing the sigma value of the features selected would be a potential fix. However, the feature selections provided in this protocol regularly produce accurate results. Following the critical steps as written will help mitigate the most common issues and troubleshooting in the future.
In summary, this method provides better qualitative images while also yielding unbiased and reliable quantification of the Drosophila eye system. Consequently, this method could enhance the utility of eye degeneration as a powerful tool for modeling degenerative diseases in the future.
Divulgazioni
The authors have nothing to disclose.
Acknowledgements
We thank Pedro Fernandez-Funez for the use of the microscope and camera used in this protocol. We would also like to thank Ava Schapman for providing feedback on the clarity of the protocol. Financial support was provided by The Wallin Neuroscience Discovery Fund to Nam Chul Kim.
Materials
| Computer specifications | Ryzen 5, 16 GB RAM, Nvidia RTX 3070 Super, Windows 10 | ||
| Flynotyper | Iyer, J. et al. (2016) | Download software here: https://flynotyper.sourceforge.net/imageJ.html | Open source software. Do not use Flynotyper 2.0. At the time of publication, 2.0 was fairly new and this protocol is optimized for the original version of Flynotyper. |
| ilastik | Berg, S. et al. (2019) | Download software here: https://www.ilastik.org/download.html | Open source software. Download Version 1.4.0.post1 under Regular Builds corresponding to your computer operating system. |
| ImageJ | Download software here: https://imagej.net/ij/download.html | Open source software. Versions 1.53 and 1.54 were used. 1.54 is the updated version and is the default download. | |
| Leica Application Suite (LAS X) | Leica Microsystems | LASX Office 1.4.6 28433 | System and software used for z-stack acquisition. |
| Leica Z16 APO microscope with a DMC2900 camera | Leica Microsystems | 10 447 173, 12 730 466 | Referred to as Z-stack microscope and camera in the text. This product is now archived. |
Riferimenti
- Iyer, J., et al. Quantitative assessment of eye phenotypes for functional genetic studies using Drosophila melanogaster. G3. 6 (5), 1427-1437 (2016).
- Thomas, B. J., Wassarman, D. A. A fly’s eye view of biology. Trends Genet. 15 (5), 184-190 (1999).
- Roignant, J. -. Y., Treisman, J. E. Pattern formation in the Drosophila eye disc. Int J Dev Biol. 53 (5-6), 795-804 (2009).
- Diez-Hermano, S., Ganfornina, M. D., Vegas, E., Sanchez, D. Machine learning representation of loss of eye regularity in a Drosophila neurodegenerative model. Front Neurosci. 14 (1), 1-14 (2020).
- Appocher, C., Klima, R., Feiguin, F. Functional screening in Drosophila reveals the conserved role of REEP1 in promoting stress resistance and preventing the formation of Tau aggregates. Hum Mol Genet. 23 (25), 6762-6772 (2014).
- Pandey, U. B., et al. HDAC6 rescues neurodegeneration and provides an essential link between autophagy and the UPS. Nature. 447 (7146), 860-864 (2007).
- Outa, A. A., et al. Validation of a Drosophila model of wild-type and T315I mutated BCR-ABL1 in chronic myeloid leukemia: an effective platform for treatment screening. Haematologica. 105 (2), 387-397 (2019).
- Shirinian, M., et al. A transgenic Drosophila melanogaster model to study human T-lymphotropic virus oncoprotein Tax-1-driven transformation in vivo. J Virol. 89 (15), 8092-8095 (2015).
- Diez-Hermano, S., Valero, J., Rueda, C., Ganfornina, M. D., Sanchez, D. An automated image analysis method to measure regularity in biological patterns: a case study in a Drosophila neurodegenerative model. Mol Neurodegener. 10 (1), 1-10 (2015).
- Yusuff, T., et al. Drosophila models of pathogenic copy-number variant genes show global and non-neuronal defects during development. PLoS Genet. 16 (6), e1008792-e1008792 (2020).
- Berg, S., et al. ilastik: interactive machine learning for (bio)image analysis. Nat Methods. 16, 1226-1232 (2019).
- Chalmers, M. R., Kim, J., Kim, N. C. Eip74EF is a dominant modifier for ALS-FTD-linked VCPR152H phenotypes in the Drosophila eye model. BMC Res Notes. 16 (1), 1-5 (2023).
- Baek, M., et al. TDP-43 and PINK1 mediate CHCHD10S59L mutation-induced defects in Drosophila and in vitro. Nat Commun. 12 (1), 1-20 (2021).

.
