Imaging of Intracellular ATP in Organotypic Tissue Slices of the Mouse Brain using the FRET-based Sensor ATeam1.03YEMK
Summary
We describe a protocol for cell-type specific expression of the genetically encoded FRET-based sensor ATeam1.03YEMK in organotypic slice cultures of the mouse forebrain. Furthermore, we show how to use this sensor for dynamic imaging of cellular ATP levels in neurons and astrocytes.
Abstract
Neuronal activity in the central nervous system (CNS) evokes a high demand on cellular energy provided by the breakdown of adenosine triphosphate (ATP). A large share of ATP is needed to re-install ion gradients across plasma membranes degraded by electrical signaling of neurons. There is evidence that astrocytes – while not generating fast electrical signals themselves – undergo increased production of ATP in response to neuronal activity and support active neurons by providing energy metabolites to them. The recent development of genetically encoded sensors for different metabolites now enables the study of such metabolic interactions between neurons and astrocytes. Here, we describe a protocol for cell-type specific expression of the ATP-sensitive Fluorescence Resonance Energy Transfer- (FRET-) sensor ATeam1.03YEMK in organotypic tissue slice cultures of the mouse hippocampus and cortex using adeno-associated viral vectors (AAV). Furthermore, we demonstrate how this sensor can be employed for dynamic measurement of changes in cellular ATP levels in neurons and astrocytes upon increases in extracellular potassium and following induction of chemical ischemia (i.e., an inhibition of cellular energy metabolism).
Introduction
Excitatory electrical activity of neurons is largely based on the flux of cations such as sodium (Na+) and potassium (K+) across their plasma membranes. Maintenance of the electrochemical gradients of these two ions is thus required for signaling. This is accomplished by the cellular Na+/K+-ATPase (NKA), an ubiquitously expressed electrogenic transmembrane pump, which extrudes 3 Na+ out of the cell in exchange for 2 K+ from the extracellular space, requiring the consumption of one molecule of ATP per transport cycle1. In addition to the NKA, there are several other ATP-consuming ion transporters including the plasma membrane Ca2+-ATPase, which is vital for intracellular Ca2+ homeostasis and its export following activity-induced influx2. In presynaptic vesicles, a vacuolar-type H+-ATPase (v-ATPase) creates the proton gradient necessary for neurotransmitter uptake into this compartment3.
While activity of neurons thus requires a substantial amount of ATP4, they do not exhibit a significant capacity for storage of energy. Instead, they seem to rely on metabolic interactions with neighboring astrocytes, the major glycogen stores in the brain5. It has been suggested that astrocytic glycogen indeed plays an important role in supporting neuronal energy needs; and a key phenomenon in this proposed neuro-metabolic coupling between the two cell types is the capacity of astrocytes to increase their ATP production in response to neuronal activity6,7,8. This hypothesis, known as astrocyte-neuron lactate shuttle (ANLS), is still under debate, because other work has provided evidence that neurons may also increase their own rate of glycolysis in response to stimulation9,10, reflecting the necessity of further methods and approaches to study neuro-glia interaction.
Investigation of cellular energy metabolism and ATP levels in neurons and astrocytes to elucidate neuro-glia metabolic interactions has long been hampered by the lack of suitable probes for the detection of changes in metabolite concentrations in living cells in brain tissue. The last decade, however, has provided a surge in the development of new tools and new genetically encoded fluorescent probes for different metabolites, including sensors for ATP, lactate, pyruvate and others11,12. Using these tools, it is now possible to directly address questions related to cellular ATP consumption and changes in cellular energy levels at the single cell level and in a cell-type specific manner in intact brain tissue13.
In the present work, we describe a procedure to visualize cytosolic ATP dynamics on neurons and astrocytes of cultured organotypic brain slices. We show how to employ adeno-associated viral vectors (AAV) for cell-type specific expression of the genetically encoded ATP-nanosensor ATeam1.03YEMK (14) in neurons and astrocytes of slices of mouse brain that can be maintained in cell culture for several weeks15. A procedure of how to remove the glial scar that covers cultured tissue slices is described, which improves optical accessibility and imaging of cells in the organotypic tissue layers underneath. Finally, we show how ATeam1.03YEMK can be used to perform FRET-based imaging of changes in cellular ATP levels in this preparation. This method hosts the major advantages that it does not require surgical brain procedures, provides high levels of expression of the sensor and cell type specificity in cultured brain slices, reducing invasiveness or stress in the cells as compared with other methods, like transfection by electroporation or transduction with other viral vectors10,16,17. In addition, this protocol can be applied to other FRET based nanosensors, among them variants of ATeam1.03 that provide lower binding affinity for ATP14.
Protocol
The present study was carried out in strict accordance with the institutional guidelines of the Heinrich Heine University Düsseldorf as well as the European Community Council Directive (2010/63/EU). All experiments using organotypic brain slice cultures were communicated to and approved by the Animal Welfare Office at the Animal Care and Use Facility of the Heinrich Heine University Düsseldorf (institutional act number: O50/05). In accordance with the recommendations of the European Commission18, animals up to 10 days old were killed by decapitation.
1. Preparation of Organotypic Brain Slice Cultures (OTCs)
- The day before or at least 30 min prior to the procedure
- Prepare the Petri dish (under sterile conditions). Remove the lid of the 6 well plate and place 800-850 µL of OTC medium into each well. Keep the plate in the incubator (37 °C, 5% CO2/95% O2) until required.
- Prepare the washing Petri dishes (under sterile conditions). Add 3 mL of HBSS to each 30 mm Petri dish. A total of 5 dishes per procedure is required. Place them in the incubator (37 °C, 5% CO2/95% O2) for at least 30 min — overnight until required.
- Prepare the ACSF (Table 1). Keep the saline without glucose at 4 °C until the next day.
| Salines and Media – Formulation | ||||
| Name | Abbreviation | Composition | Concentration [mM] | Comments |
| Artificial Cerebrospinal Fluid Solution | ACSF | NaCl | 125 | Bubbled with 5% CO2/95% O2, pH 7.4 |
| KCl | 2.5 | Always add glucose right before usage. | ||
| CaCl2 | 2 | Do not store for more than one day with glucose | ||
| MgCl2 | 1 | ~310 mOsm/L | ||
| NaH2PO4 | 1.25 | |||
| NaHCO3 | 26 | |||
| Glucose | 20 | |||
| Experimental ACSF | E-ACSF | NaCl | 136 | Bubbled with 5% CO2/95% O2, pH 7.4 |
| KCl | 3 | Always add glucose right before usage. | ||
| CaCl2 | 2 | Do not store for more than one day with glucose | ||
| MgCl2 | 1 | ~320 mOsm/L | ||
| NaH2PO4 | 1.25 | |||
| NaHCO3 | 24 | |||
| Glucose | 5 | |||
| Lactate | 1 | |||
| Chemical Ischemia Solution | CIS | NaCl | 136 | Bubbled with 5% CO2/95% O2, pH 7.4 |
| KCl | 3 | ~318 mOsm/L | ||
| CaCl2 | 2 | |||
| MgCl2 | 1 | |||
| NaH2PO4 | 1.25 | |||
| NaHCO3 | 24 | |||
| 2, 2-Deoxyglucose | 2 | |||
| NaN3 | 5 | |||
| 8 mM potassium ACSF | 8 mM K+ ACSF | NaCl | 128 | Bubbled with 5% CO2/95% O2, pH 7.4 |
| KCl | 8 | ~320 mOsm/L | ||
| CaCl2 | 2 | |||
| MgCl2 | 1 | |||
| NaH2PO4 | 1.25 | |||
| NaHCO3 | 24 | |||
| Glucose | 5 | |||
| Lactate | 1 | |||
| Hepes-buffered ACSF | H-ACSF | NaCl | 125 | Adjusted to pH 7.4 with NaOH |
| KCl | 3 | Always add glucose right before use | ||
| CaCl2 | 2 | Do not store for more than one day with glucose | ||
| MgSO4 | 2 | ~310 mOsm/L (adjusted with sucrose) | ||
| NaH2PO4 | 125 | |||
| Hepes | 25 | |||
| Glucose | 10 | |||
| Hanks' Balanced Salt Solution | HBSS | Sigma (catalog number H9394). | ||
| Dulbecco's Phosphate-Buffered Saline | DPBS | Gibco (catalog number 14287-080) | ||
| Organotypic Culture Medium | OTC medium | heat-inactivated horse serum | 20% | 34°C, 5 % CO2, pH 7.4, under culturing condition |
| MEM | 79% | ~320 mOsm/L | ||
| L-glutamine | 1 | |||
| Insulin | 0.01 mg/mL | |||
| NaCl | 14.5 | |||
| MgSO4 | 2 | |||
| CaCl2 | 1.44 | |||
| Ascorbic acid | 0.00125 % | |||
| D-glucose | 13 |
Table 1: Solution composition.
- On the day of preparation, add the glucose to the ACSF, place it on ice and start bubbling with 95% O2/5% CO2 for at least 30 min to result in a pH of 7.4.
- Dissection and slicing
- Sacrifice the mouse (BalbC, both sexes) at postnatal days 6 to 8 by rapid decapitation and place the head in a glass Petri dish containing ice-cold ACSF.
- Expose the skull by cutting the skin from the back until the posterior tip of the nasal bone. Then, carefully cut the skull from the foramen magnum using a surgical scissor and expose the brain.
NOTE: Verify that the procedure is in accordance with the guidelines of the institution. - Remove the brain and place it on a filter membrane in an ice-cold Petri dish filled with ACSF.
- Separate the hemispheres and perform a parasagittal cut at an angle of 45°. Fix one hemisphere at the vibratome tissue stage with superglue. Immediately transfer the tissue block to the vibratome bath containing ice-cold ACSF (bubbled with 5% CO2/95% O2). Finally align the tissue. Keep the second hemisphere in ice-cold ACSF until slicing.
- Adjust the vibratome to cut slices at 250-400 µm. Slicing at 250 µm will yield approximately 12 slices per animal (400 µm: ~7 slices).
- After cutting the slice (Figure 1A), identify the hippocampal formation based on its typical morphological appearance (Figure 1) and isolate it using hypodermic needles (23 gauge, 1"), keeping the part of the cerebral cortex adjacent to the hippocampus.
NOTE: Preserving the neocortex while culturing helps to preserve the integrity of the hippocampus. However, the hippocampus can be isolated and cultured without cortex if required. - Place the slice on a mesh in warmed, ACSF (34 °C, bubbled with 5% CO2/95% O2) until all the slices are collected.
- Transfer the slices to the laminar flow cabinet to continue under sterile conditions.
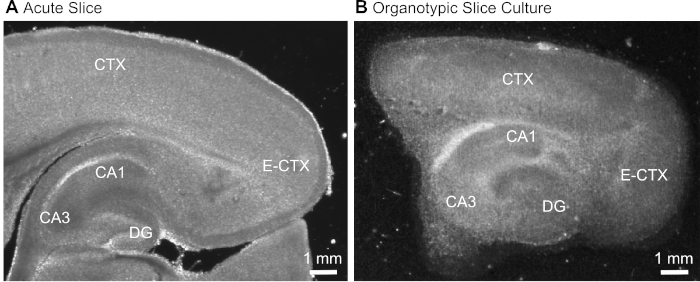
Figure 1: Representative transmission images of acute and organotypic brain slice preparations. Comparison of an acutely isolated parasagittal brain slice (A) and a parasagittal organotypic brain slice maintained in culture for 12 days (B) using wide-field translumination microscopy. DG = dentate gyrus; CA1/3 = CA1/CA3-region of the hippocampus; E-CTX = Entorhinal cortex; CTX = (neo-) cortex. Please click here to view a larger version of this figure.
2. Culturing the Slices
- Gently transfer the slices from the ACSF into one of the pre-warmed Petri dishes filled with sterile Hank's salt solution using an inverted sterile glass Pasteur pipette.
NOTE: Sterilization of the tissue is achieved by dilution (step 3.2). Transfer as little ACSF as possible to the Petri dish. - Change the pipette and transfer the slices to the second Petri dish. Repeat the process 5 times overall. Transfer as little HBSS as possible to the following Petri dishes.
- Gently place one slice at a time on the top of the culture insert. Repeat the process for each slice. Avoid turbulences in the pipette and wait until the slice descents to the tip of the Pasteur pipette. One may place up to 4 slices onto a single membrane.
- Carefully remove any excess Hank's solution from the top of the insert by using a fine tip.
- Keep the cultures (Figure 2) in an incubator at the interface between gas (carbogen, 95% O2 /5% CO2) and the liquid at 37 °C until the day of experiment. Replace the medium every 2-3 days.
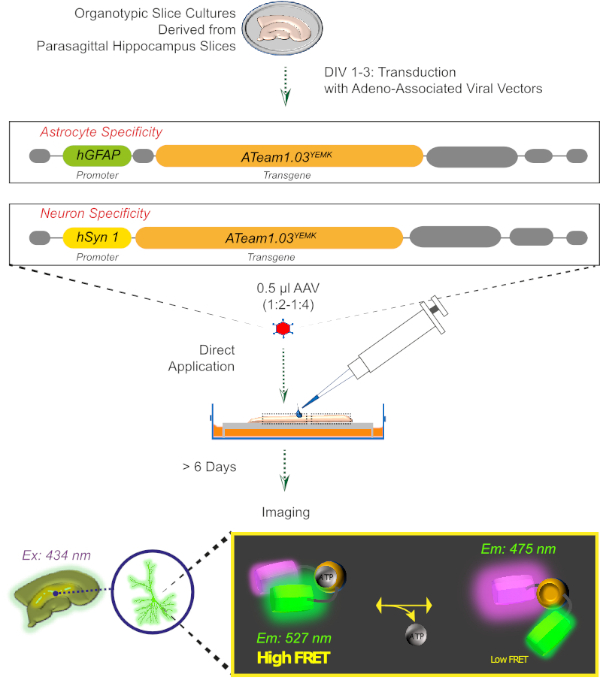
Figure 2: Principle of FRET-based ATP imaging in cultured organotypic brain slices using the genetically encoded sensor ATeam1.03YEMK. Schematic representation of the protocol presented in this work. Briefly, parasagittal organotypic slices, cultured for 1-3 days, are transduced with an adeno-associated viral vector containing either, the astrocyte-specific hGFAP- or the neuron-specific hSyn-promoter and the sequence for the expression of ATeam1.03YEMK. Diluted aliquots of these vectors (1:2-1:4) are directly applied on the top of a slice, which is maintained under culturing conditions for at least 6 more days. Changes in intracellular ATP levels can then be visualized in cells expressing the sensor by exciting it at 434 nm and by acquiring fluorescence emission simultaneously at 527 (acceptor) and 475 (donor) nm. Please click here to view a larger version of this figure.
3. Expression of ATP Sensors with an Aadeno-associated Viral Vector (Figure 2)
NOTE: Make sure to meet all requirements for handling of genetically modified organisms!
- To handle the viral vector, aliquot adeno-associated viral vectors (AAV2/5) at 1-2 µL to avoid repeated freezing and thawing. Store the aliquots at -80 °C.
- Place a flask containing 10% bleach onto the sterile bench to discard all used residual material that was in contact with the vector.
- For transduction, prepare a dilution of 1 µL of the vector with 2-3 µL of DPBS. Stock solutions normally exhibit a physical titer in the magnitude of 1012 viral genomes per mL (vg/mL).
- Transfer an insert containing a cultured slice into the sterile hood.
- Without touching the tissue, apply 0.5 µL of the diluted vector directly to the top of each slice.
NOTE: Better expression in the deeper layers of the tissue is obtained by transducing cultured slices at 1-3 days in vitro (DIV). Transduction of older cultures might result in a predominant expression of cells in the surrounding glial scar or a low expression in neurons, respectively. - Finally, place the slices back into the incubator and maintain them for at least 6 more days. Do not change the medium on the day of transduction.
4. Removal of the Glial Scar (Figure 3)
- Just before starting an experiment, transfer an insert containing cultured slices into the sterile hood and place it into a 30 mm dish, containing 1 mL of OCT medium or MEM.
- Place the dish under the stereoscope and focus onto the surface of the slice.
- Use two sterile hypodermic needles (23 G, 1") to make a short cross-cut right on the narrow edges of a chosen slice (Figure 3). This procedure will release the tension in the surface created by the glial scar causing it to retract, thereby exposing the underlying layers (see Figure 5).
NOTE: The first tissue layer (glial scar) is mainly formed by reactive astrocytes. In wide-field imaging, this dense tissue layer will result in additional scattering of the light, resulting in blurry images. Removing the scar is thus advantageous to obtain better visibility of the deeper layers, which contain the proper organotypic tissue. Thus, be careful to perform this cut exclusively at the edge and in the upper layer of the slice preparation only and not to damage the tissue underneath. We did not observe differences between data obtained in OTCs with glial scar with those from scar-free OTCs (data not shown). - Remove the prepared slice from the insert. To this end, use a sterile scalpel and excise it by making straight parallel cuts to the membrane, forming a square or a triangle with the slice in the center, while holding the edges of the membrane with tweezers. If the insert hosts additional slices, transfer it back to the original plate and into the incubator. The surface tension of the medium will prevent its leakage onto the surface of the membrane.
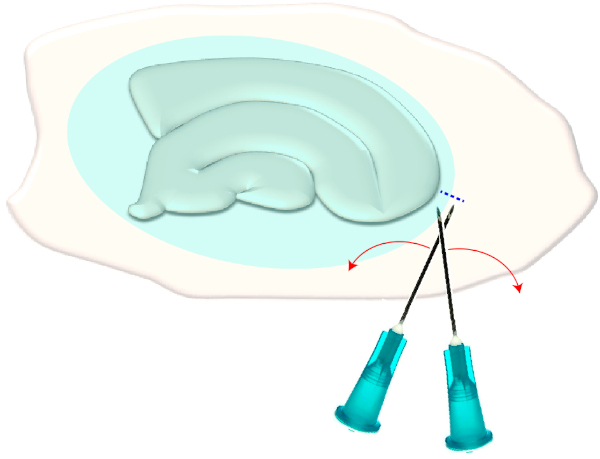
Figure 3: Schematic illustration of the mechanical removal of the glial scar. The figure shows a hippocampal slice culture which is covered by a glial scar (blueish ellipsoid). By one time shearing the tips of two syringe needles at the smallest pole of the culture and at the edge of the glial scar (blue dashed line), the scar will flip aside. Please click here to view a larger version of this figure.
5. FRET-based ATP Imaging (Figure 4)
- Before the experiment, prepare E-ACSF and bubble it with 95% O2/5% CO2 for at least 30 min to obtain a pH of 7.4. Switch on the fluorescent light source (Xenon lamp) of the monochromator (Figure 4). Start the perfusion just before taking out the slice from the incubator.
NOTE: Keep the saline bubbled with 95% O2 and 5% CO2 during the entire experiment. - Transfer the slice into an experimental chamber that is constantly perfused with freshly carbogenated E-ACSF using a peristaltic pump (Figure 4). Then, fix the slice with a grid. Place the chamber onto the microscope stage and connect the perfusion system. Gas-proof laboratory tubing is recommended for perfusion.
NOTE: Experiments can be performed at room temperature or near physiological temperature, depending on the experimental design. Check the stability and reliability of the perfusion flow to avoid changes of focus induced by movement of the tissue and/or changes in shear stress. Standard perfusion velocities for slice work, used by us and many other laboratories, are 1.5-2.5 mL/min.
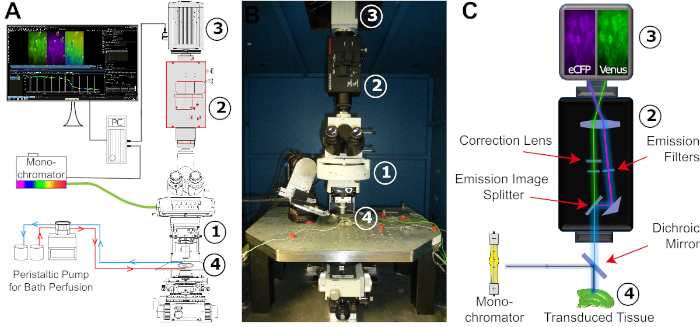
Figure 4: Configuration of the FRET imaging setup. (A) Schematic illustration of the different components and their spatial arrangement required for the FRET imaging setup. The arrangement consists of a monochromator with a xenon lamp as a light source, an upright fixed-stage microscope (1), an image-splitter system (2), a digital CCD or CMOS camera for time-lapse recording (3), and an experimental bath adapted for stable constant perfusion (4). The bath perfusion is realized by a peristaltic pump with adjustable flow rate. (B) Image of the experimental workspace. The FRET imaging setup is mounted on a vibration-damped table carrying a x/y-translational stage, into which the experimental bath is embedded. Numbers: see (A). (C) Schematic view of the light pathway from the monochromator to the digital camera. Indicated is the position of the different filters and the dichroic mirror. Numbers: see (A). Please click here to view a larger version of this figure.
- Bring the cultured slice into focus using transmission light. Identify the area where experiments shall be performed (example: CA1 region of the hippocampus). Before starting imaging experiments, wait at least 15 min to allow slices to adapt to the saline conditions. For the configuration of the experimental setup, see Figure 4.
- Switch on the camera and the imaging software. Then, select the proper filter cube.
- Excite the donor fluorescent protein (eCFP) at 435/17 nm (~435 nm). Set the exposure time between 40 to 90 ms.
NOTE: Strong exposure of slices to the fluorescent light may result in phototoxic effects. - Excitation at 435 nm results in emission at both 475 nm (eCFP; donor) and 527 nm (Venus; acceptor). Split the fluorescence emission at 500 nm with an emission image splitter and employ band pass filters at 483/32 and 542/27 to further isolate donor and acceptor fluorescence. Strong expression might result in saturation of the detectors. In this case, you might use a neutral density filter to reduce intensity of excitation.
- Select a region of interest (ROI) apparently devoid of cellular fluorescence for background subtraction. Then, create ROIs delineating cell bodies.
- Set the frequency of image acquisition and the overall recording time. For long (>30 min) experiments, an acquisition frequency of 0.2-0.5 Hz is recommended to prevent phototoxicity.
- Start the recording. It is recommended to record at least 5 min under baseline conditions to ensure the stability of the preparation.
NOTE: Adjust focus of the cell during the recording if needed. - To induce changes in intracellular ATP, transfer the perfusion tube from standard ACSF to a saline containing metabolic inhibitors (e.g. CIS, see Table 1 and below). Alternatively, use a saline with elevated potassium concentration to mimic release of potassium from active neurons.
NOTE: Application by bath perfusion is a relatively slow process, which globally acts on the entire preparation. Take note of the time at which the new solution actually started to enter the experimental bath. Depending on the distance between the chamber and the saline's reservoir, as well as on the speed of the perfusion, a delay time must be considered.
6. High Resolution Documentation of Cellular ATeam Fluorescence
- Directly after the recordings, transfer the recording chamber containing the slice culture to the confocal laser scan microscope.
NOTE: Take special care. Because of potential photodamage, perform this step only after experiments. For documentation purposes, one may exchange the E-ACSF with H-ACSF. Therefore, a perfusion system is not necessarily required. - Take z-stacks at the highest z resolution possible at the given optical configuration.
- Apply a deconvolution algorithm to increase image resolution.
Representative Results
AAV vectors are a reliable tool to selectively express foreign genes in cells within living tissue16. Direct application of AAVs containing the sequence cassette of ATeam1.03YEMK and a specific promoter results in a high expression of the sensor in the chosen cell type. At DIV 14 (~10 days after a transduction), neurons expressing ATeam under the human synapsin promoter are found at high density in the neocortex of cultured tissue slices at depths of up to 50 µm below the slice surface (Figure 5A). Comparable results can be achieved in the hippocampus (Figure 5B).
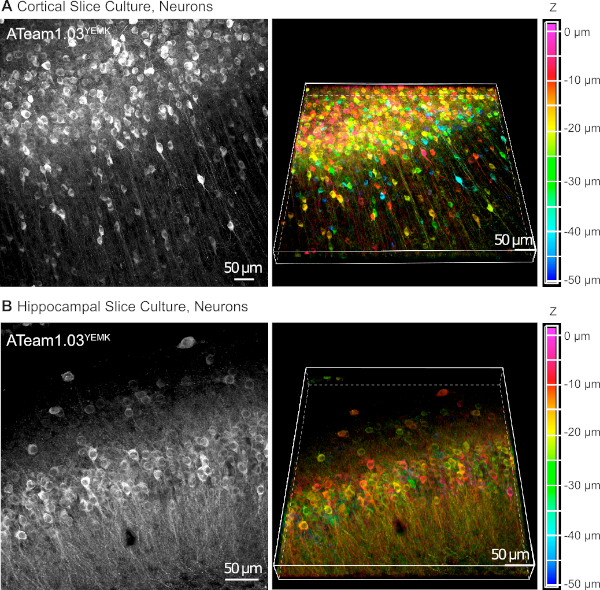
Figure 5: Visualization of neurons expressing ATeam1.03YEMK in cultured parasagittal organotypic brain slices. Images on the left correspond to extended focus projections of 43 optical sections (1.05 µm each) of cortical tissue (A) and (B) of 70 optical sections (0.6 µm each) of hippocampal tissue. Images on the right represent the volume view of the same projection. Cells are color-coded according to their depth relative to the slice surface as indicated by the color scale on the right. Please click here to view a larger version of this figure.
For the measurement of ATP levels in astrocytes, ATeam1.03YEMK is expressed under the control of the human glial fibrillary acidic protein (GFAP) promoter. This results in efficient transduction of cells in both neocortex and hippocampus of cultured tissue slices (Figure 6). Notably, two different morphological phenotypes can be distinguished, depending on the depth relative to the surface of slice preparations. In the first, superficial layer, cells are characterized by thick primary processes that are predominately arranged in parallel to the surface. These cells exhibit strongly overlapping domains, creating a dense meshwork of apparently reactive astrocytes (Figure 6). In deeper layers (30-60 µm from the surface), transduced astrocytes exhibit fine cellular processes that form largely spherical domains and their morphology resembles that of astrocytes in situ as reported earlier19,20,21 (Figure 6). To obtain better transduction of deeper-layer astrocytes as well as better optical access to these deeper layers, the glial scar tissue can be removed as described in Step 4.
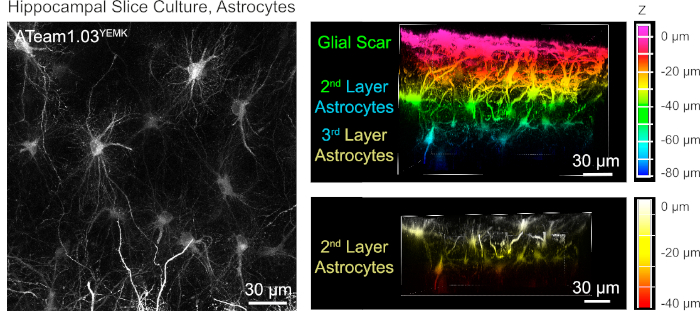
Figure 6: Visualization of astrocytes expressing ATeam1.03YEMK in cultured parasagittal organotypic brain slices. The image on the left corresponds to an extended focus projection of 191 optical sections (0.45 µm each). For illustration purposes, the glial scar was excluded from the projection of astrocytes. Images on the right represent the volume view of the same projection before and after removal of the glial scar. Cells are color-coded according to their depth relative to the slice surface as indicated by the color scales on the right. Please click here to view a larger version of this figure.
Successful expression of ATeam1.03YEMK allows the dynamic measurement of changes in ATP levels in neurons or astrocytes, depending on the promoter used (see above). Experiments were performed in an experimental bath constantly perfused with E-ACSF (bubbled with 95% O2/5% CO2). In organotypic slices expressing ATeam1.03YEMK in hippocampal neurons, regions of interest (ROIs) were selected before starting the recording, representing the somata of pyramidal cells (Figure 7A). Moreover, a region for background subtraction was chosen (Figure 7A). Emission of Venus as well as eCFP fluorescence was then collected for each of these ROIs separately and depicted as fluorescence emission level over time (Figure 7B). After recording fluorescence under control conditions for several minutes to ensure a stable baseline, cellular metabolism was inhibited by exposing the slice preparation to a glucose-free saline, to which 5 mM sodium azide (NaN3) was added for one minute (Figure 7B). This manipulation induced opposite changes in the emission intensity of the FRET pair (Figure 7B, left panels), with a decrease of Venus (527 nm) and an increase of eCFP (475 nm) emission. Calculating the FRET ratio by dividing the fluorescence emission of Venus by that of eCFP (FVenus/FeCFP) resulted in signals that reflect the relative changes in the intracellular ATP levels, the so-called "ATeam FRET ratio" (Figure 7B, right panel). In all recorded neurons (n = 70 cells in N = 5 slices), NaN3 caused a reversible decrease in the ATeam FRET ratio, indicating a reversible decrease in intracellular ATP levels upon inhibition of cellular metabolism.
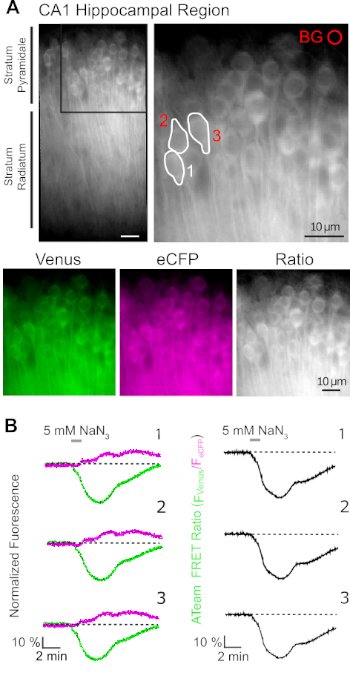
Figure 7: Demonstration of time lapse ATeam FRET ratio imaging. (A) Top left: Wide-field fluorescence image of the pyramidal layer and stratum radiatum of the CA1 region of a cultured organotypic hippocampal slice expressing ATeam1.03YEMK in neurons. Top right: Enlarged view of boxed section as indicated on the left. White lines delineate regions of interest (ROIs) 1-3 representing cell bodies of CA1 pyramidal neurons chosen for analysis in (B). BG represents the ROI chosen for background correction. Bottom: Pseudo-colored images representing fluorescence emission of Venus (green), eCFP (purple) and the ratio of Venus/eCFP. (B) Time lapse recording in ROIs 1-3, representing neuronal cell bodies (see A). Traces on the left show normalized fluorescence emission of Venus (green) and eCFP (magenta). Traces on the right show the corresponding ATeam FRET ratio. Note that perfusion with 5 mM NaN3 in the absence of extracellular glucose for 1 minute (grey bar) induces a reversible decrease in the ATeam FRET ratio, indicating a decrease in intracellular ATP concentration. Please click here to view a larger version of this figure.
To ensure the stability of the preparation and the sensor under long-term experiment conditions, slices expressing ATeam in neurons or astrocytes were constantly perfused with ACSF for prolonged periods (>50 min; n = 12 cells each, N = 3 OTCs from 3 brains). Under these conditions, the ATeam FRET ratio did not change (Figure 8). Exposing the preparations to CIS containing metabolic inhibitors ("Chemical ischemia", see Table 1), in contrast, again resulted in the expected drop in the ATeam FRET ratio as observed above.
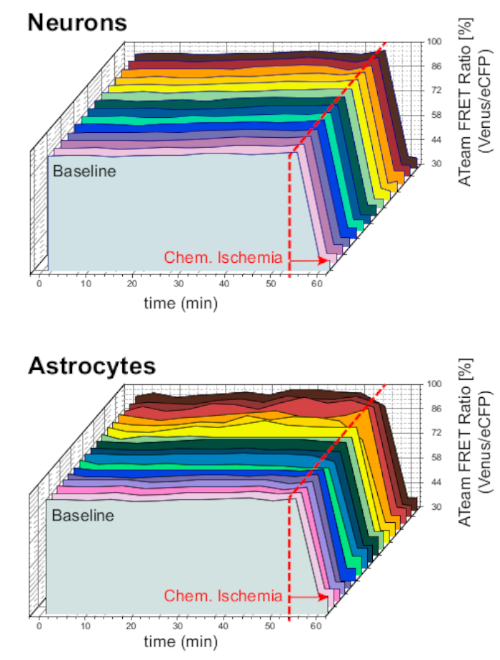
Figure 8: Baseline experiments employing ATeam. Long-term ATeam FRET ratio imaging in 14 different cells under baseline conditions in neurons (top) and astrocytes (bottom). Data were taken under comparable conditions as other experimental data. At the end of each measurement, chemical ischemia was elicited by perfusion with CIS as indicated by the arrow. NOTE: Baseline ATeam FRET ratios are stable over time under baseline conditions. Please click here to view a larger version of this figure.
Next, we analyzed the responses of neurons and astrocytes expressing ATeam1.03YEMK to an increase in the extracellular potassium concentration. After establishing a stable baseline, neurons were perfused with a saline in which the potassium concentration was increased from 3 to 8 mM for 3 minutes (Figure 9A). This manipulation did, however, not result in a detectable change in the ATeam FRET ratio (n = 56 cells in N = 5 slices). To ensure that the sensor reacted to a change in ATP levels, slices were then again exposed to a sustained period of chemical ischemia elicited by replacing E-ACSF by CIS. Chemical ischemia resulted in a rapid decrease in the ATeam FRET ratio to a new, stable level, indicating nominal depletion of ATP after 2-3 min (Figure 9A).
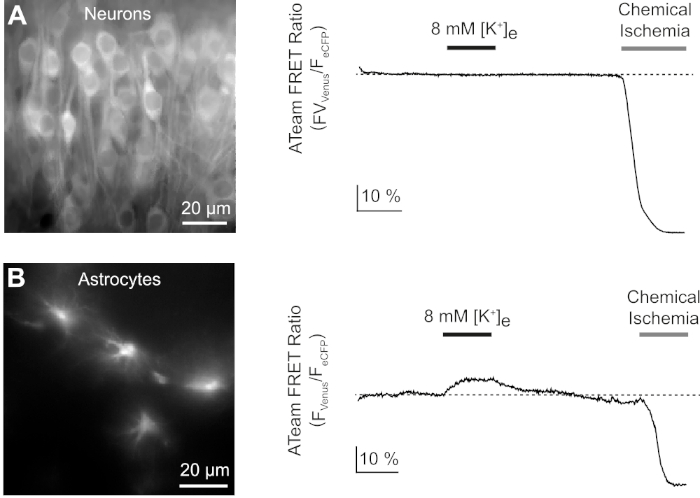
Figure 9: Representative experiments illustrating changes in ATP levels in neurons and astrocytes. (A,B): Images on the left show ATeam fluorescence from neurons and astrocytes located in the hippocampal CA1 region of organotypic slices. Traces on the right represent time lapse recordings of the ATeam FRET ratio obtained from a ROI positioned over a single cell body. In both experiments, slices were first subjected to an increase in the extracellular potassium concentration for 3 minutes (see bar), followed by a final exposure to chemical ischemia. Note that while neurons do not respond to the elevation of extracellular potassium (A), astrocytes react with an increase in ATP (B). Please click here to view a larger version of this figure.
The same experimental protocol was performed with slices, in which ATeam1.03YEMK was expressed in astrocytes. In contrast to what was observed in neurons, astrocytes reacted to the increase in extracellular potassium by a reversible increase in the ATeam FRET ratio, indicating an increase in intracellular ATP levels (n = 70 cells in N = 5 slices) (Figure 9B). Subsequent exposure to chemical ischemia resulted, as expected, in a large drop in the ATeam FRET ratio, indicative of nominal depletion of intracellular ATP (Figure 9B).
Discussion
Here, we demonstrate a procedure for the cell-type specific expression of ATeam1.03YEMK, a FRET-based, genetically encoded nanosensor14, for measurement of changes in ATP levels in astrocytes or neurons in organotypic tissue slice cultures of the mouse brain15. In exemplary recordings, we show that an increase in the extracellular potassium concentration does not result in a change in ATP concentrations in neurons, while astrocytic ATP levels rise in response to this manipulation. Moreover, our results demonstrate that upon inhibition of cellular metabolism, ATeam1.03YEMK FRET ratio rapidly drops in both cell types, indicating a rapid decrease in intracellular ATP.
Expression of ATeam1.03YEMK in organotypic slice cultures requires maintenance of the tissue in culture under controlled conditions for at least 7-10 days. Alternatively, ATeam1.03YEMK can also be employed for measurement of ATP in acutely isolated brain tissue slices and in optic nerves of mice13,15. Measurements in acutely isolated tissue, however, necessitate the generation of transgenic animals or a stereotactic application of viral vectors into the brain, involving animal experimentation and strict animal care protocols. In this regard, ATeam1.03YEMK expression in organotypic tissue slice cultures represents a useful and valuable alternative22,23. For many years now, organotypic tissue slice cultures serve as an established model system to study neural properties, connectivity and development24,25,26. They not only maintain the general tissue architecture and lamination (Figure 1), but also host the preferential properties of cell cultures such as superior accessibility and direct control of experimental conditions. Organotypic tissue slice cultures are also routinely employed to express foreign genes by using viral vectors27. Several types of viral vectors have been reported to deliver transgenes into brain tissue16,28. Adenoviral vectors induce high expression in glial cells, but not hippocampal neurons16, and might generate glial reactivity17. Adeno-associated viral vectors as used here emerge as a good alternative15, and their effectiveness has also been shown in vivo29.
While mainly being used for the study of neuronal properties, recent studies have established that organotypic tissue slice cultures can also be employed for the analysis of astrocytes. Cultured slices are usually covered by a layer of reactive astrocytes19,30 (Figure 5), but astrocytes exhibit a more native, non-reactive morphology and cytoarchitecture in deeper layers19,30 (Figure 5). In the present study, we describe a procedure for the mechanical removal of the outer glial scar, which results in a better experimental and optical accessibility of native astrocytes within the proper organotypic tissue layers. Moreover, its removal improves the expression efficacy in deeper layers of the organotypic slices; if the glial scar is not removed, transduction by AAVs might tend to be restricted to the superficial cell layers.
Several external mechanical factors need to be considered when performing experiments in tissue slices. A variation in bath perfusion velocity can induce movements of the entire preparation and/or induce changes in focus, resulting in artificial transient changes of the sensor signal. Moreover, both astrocytes and neurons have been reported to respond to mechanical deformation such as imposed by high perfusion rates32,33. In our hands, using a reliable peristaltic pump, together with maintaining small and stable volumes of saline between the tissue and the objective (meniscus) results in a stable FRET-signal under baseline conditions at the perfusion velocity used here (1.5-2.5 mL/min; Figure 8).
In the present study, we also demonstrate that FRET-based imaging with ATeam1.03YEMK can be employed to monitor ATP levels in neurons and astrocytes. An alternative means introduced earlier for measurement of cellular ATP is the so-called luciferin-luciferase assay34,35,36,37. This approach, however, is based on imaging of bioluminescence and only provides a rather low temporal and spatial resolution partly due to high background noise levels. Another method routinely employed in recent years was the imaging of changes in the intracellular magnesium concentration using the ion-sensitive fluorophore magnesium green38,39,40. This approach relates to the observation that a consumption of ATP results in the release of its co-factor magnesium. Imaging with magnesium green thereby only provides a secondary estimate of changes in ATP levels. Moreover, magnesium green is also sensitive to changes in intracellular calcium, introducing another difficulty when interpreting results obtained with this method.
The recent development of genetically-encoded nanosensors for direct imaging of cellular metabolites, therefore, represented a big step forward11,12. Several different sensors were generated that can be employed for measurement of intracellular ATP36,41,42,43. Among those are the ratiometric fluorescent ATP indicator "QUEEN"41 as well as PercevalHR, which senses the ATP:ADP ratio42. While the latter probe is a valuable tool for the study of the energy status of cells, it requires simultaneous measurement of changes in pH42.
ATeam is a nanosensor of which several variants exist, which — among others — differ in their binding affinity for ATP14. In vitro, ATeam1.03YEMK exhibits a Kd of 1.2 mM at 37 °C, which is close to cellular ATP levels determined in different neuronal cell types, ranging from hypothalamus and cerebellum34 to hippocampus37,44,45. In cuvette measurements, lowering the temperature by 10 °C resulted in a significant decrease in the binding affinity of ATeam1.03YEMK to ATP, suggesting that it might not be ideal for cellular imaging at room temperature14. Our earlier study15, however, demonstrated that the behavior and response of ATeam1.03YEMK expressed in neurons and astrocytes to different manipulations is similar at near physiological and at room temperature, indicating that the sensor allows reliable determination of intracellular ATP levels under both conditions. In addition, our previous experiments addressed the pH-sensitivity of ATeam1.03YEMK expressed inside cells15, showing that it is insensitive to changes in intracellular pH by about 0.1-0.2 pH units. If the Kd in the low mM range is a concern, alternative ATeam variants might be used14, among them red-shifted variants of ATeam ("GO-ATeam")43.
Our experiments using ATeam1.03YEMK demonstrate that an increase in the extracellular potassium concentration by a few mM only (from 3 to 8 mM) results in a transient increase in the ATeam1.03YEMK ratio in astrocytes in organotypic slice culture. This observation confirms earlier studies15,46 and clearly indicates that astrocytes respond to the release of potassium by active neurons with an increase in their ATP production, mostly likely as a consequence of a stimulation of the Na+/K+-ATPase and the Na+/HCO3– cotransporter, respectively47,48. In contrast to this, neurons did not show a response, which is in line with previous work as well15. Both cell types, however, rapidly and strongly reacted to inhibition of cellular glycolysis and mitochondrial respiration as shown before15. Under conditions of chemical ischemia, ATeam FRET ratios fell to a new stable level, indicating a nominal depletion of cellular ATP. The latter result suggests that both neurons as well as astrocytes exhibit a relevant consumption of ATP also under steady-state conditions without additional stimulation by synaptic activation or application of neurotransmitters. Taken together, we conclude that FRET-based imaging with genetically encoded nanosensors, among them ATeam1.03YEMK, will provide a valuable approach to elucidate the cellular processes that are responsible for changes in intracellular ATP levels and cellular ATP consumption under different conditions.
Disclosures
The authors have nothing to disclose.
Acknowledgements
The authors wish to thank Claudia Roderigo and Simone Durry for expert technical assistance. We thank Dr. Niklas J. Gerkau and M.Sc. Joel Nelson for assistance in the preparation of the organotypic slice cultures. Research in the author's laboratory was funded by the German Research Association (DFG; FOR 2795: Ro 2327/13-1 and SPP 1757: Ro 2327/8-2 to CRR; and SPP 1757: Young Glia Start-Up funding to RL).
Materials
| 2-deoxyglucose | Alfa Aesar | L07338 | Non-metabolizable glucose analog |
| 36-IMA-410-019 Argon laser | Melles Griot | 488 nm wavelength argon | |
| Ascorbic acid | Carl Roth | 3525.1 | Antioxidant, Vitamin C |
| band pass filters 483/32 | AHF Analysentechnik AG | Splitter compatible emmision filter | |
| band pass filters 542/27 | AHF Analysentechnik AG | Splitter compatible emmision filter | |
| Beamsplitter T 455 LP | AHF Analysentechnik AG | Excitation dichroic mirror | |
| Beamsplitter T 505 LPXR | AHF Analysentechnik AG | Splitter dichroic | |
| Confocal laser scannig microscope C1 | Nikon Microscope Solutions | Modular confocal microscope system C1 | |
| Data processing Origin Pro 9.0.0 (64-bit) | OriginLab corporation | Scientific graphing and data analysis software | |
| D-glucose monohydrate | Caelo | 2580-1kg | |
| DPBS | GIBCO/Life | 14190250 | Dulbecco's phosphate-buffered saline |
| Eclipse E 600FN upright microscope | Nikon Microscope Solutions | ||
| Eclipse FN1 upright microscope | Nikon Microscope Solutions | ||
| Experimental chamber | custom build | Perfusion chamber for live-cell imaging | |
| EZ-C1 Silver Version 3.91 | Nikon Microscope Solutions | Imaging software for confocal microscope | |
| Hanks' Balanced Salt solution | Sigma-Aldrich | H9394 | With Phenol Red for pH monitoring |
| HERAcell 150 | Thermo Scientific | CO2 incubator HERAcell ® 150 with decontamination routine | |
| HERAsafe KS/KSP | Thermo Scientific | Safety Cabinet | |
| Horse serum | GIBCO/Life | 26050088 | Heat inactivated |
| Huygens Professional | SVI Imaging | Deconvolution software | |
| Image J 1.52i | Wayne Rasban national Institute of Health | Image processing Software available in the public domain | |
| Insulin | Sigma-Aldrich | I6634 | Insulin from bovine pancreas |
| IP serie peristaltic pump | Ismatec | High-precisionmulti-channel pump | |
| Layout software, Illustrator CS6 | Adobe | Vector graphics editor | |
| L-glutamine | GIBCO/Life | 25030024 | |
| Microm HM 650 V | Thermo Scientific | Vibration microtome. Thermo scientific discontinued the production of the device in the meantime. Any other slicer or tissue chopper siutable for slicing living tissue is fine, too. | |
| Microscope stage | custom build | ||
| Microsoft Excel 16 | Microsoft | Spreadsheet software for basic data processing | |
| Millicell culture insert | Merck Millipore | PICM0RG50 | Hydrophilized PTFE, pore size 0.4 μm |
| Minimum Essential Medium Eagle | Sigma-Aldrich | M7278 | Synthetic cell culture media |
| Monochromator Polychrome V | Thermo Scientific/FEI | Ultra fast switching monochromator | |
| NaN3 (Sodium Azide) | Sigma-Aldrich | S-8032 | Mitochondrial inhibitor (complex IV inhibitor). CAUTION: Azide is toxic. Be aware not to accidentally ingest or inhale it, and prevent ist absoption through the skin. |
| Nikon Fluor 40x / 0.80 W DIC M ∞/0 WD 2.0 | Nikon Microscope Solutions | Water Immersion Microscope Objective | |
| NIS Elements 4.50 advanced Research | Nikon Microscope Solutions | Imaging software. Upgraded version for FRET imaging | |
| ORCA-Flash4.0 | Hamamatsu Photonics | Digital CMOS camera | |
| Perfusion tubing | Pro Liquid GmbH | Tygon tubing, 1.52 x 322 mm (Wd: 0.85) | |
| Photoshop CS 6 Version 13.0 | Adobe | Image processing software | |
| Sodium L-lactate | Sigma-Aldrich | 71718-10G | |
| ssAAV-2/2-hSyn1-ATeam1.03YEMK-WPRE-hGHp(A) | ETH Zürich | v244 | Single-stranded AAV vector that induces the expression of ATeam1.03YEMK under the control of the human synapsin 1 promoter fragment hSyn1. |
| ssAAV-5/2-hGFAP-hHBbI/E-ATeam1.03YEMK-WPRE-bGHp(A) | ETH Zürich | v307 | Single-stranded AAV vector that induces the expression of ATeam1.03YEMK under the control of the human glial fibrillary acidic protein promoter fragment ABC1D. |
| WVIEW GEMINI optic system | Hamamatsu Photonics | Emission Image Splitter |
References
- Sweadner, K. J. Isozymes of the Na+/K+-ATPase. Biochimica et Biophysica Acta. 988, 185-220 (1989).
- Clapham, D. E. Calcium signaling. Cell. 131, 1047-1058 (2007).
- Cotter, K., Stransky, L., McGuire, C., Forgac, M. Recent Insights into the Structure, Regulation, and Function of the V-ATPases. Trends in Biochemical Sciences. 40, 611-622 (2015).
- Harris, J. J., Jolivet, R., Attwell, D. Synaptic energy use and supply. Neuron. 75, 762-777 (2012).
- Brown, A. M., Ransom, B. R. Astrocyte glycogen and brain energy metabolism. Glia. 55, 1263-1271 (2007).
- Hertz, L., et al. Roles of astrocytic Na+,K+-ATPase and glycogenolysis for K+ homeostasis in mammalian brain. Journal of Neuroscience Research. 93, 1019-1030 (2015).
- Allaman, I., Belanger, M., Magistretti, P. J. Astrocyte-neuron metabolic relationships: For better and for worse. Trends in Neurosciences. 34, 76-87 (2011).
- Barros, L. F., Deitmer, J. W. Glucose and lactate supply to the synapse. Brain Research Reviews. 63, 149-159 (2010).
- Diaz-Garcia, C. M., et al. Neuronal Stimulation Triggers Neuronal Glycolysis and Not Lactate Uptake. Cell Metabolism. 26, 361-374 (2017).
- Diaz-Garcia, C. M., et al. Quantitative in vivo imaging of neuronal glucose concentrations with a genetically encoded fluorescence lifetime sensor. Journal of Neuroscience Research. 97, 946-960 (2019).
- Barros, L. F., et al. Current technical approaches to brain energy metabolism. Glia. 66, 1138-1159 (2018).
- Tantama, M., Hung, Y. P., Yellen, G. Optogenetic reporters: Fluorescent protein-based genetically encoded indicators of signaling and metabolism in the brain. Progress in Brain Research. 196, 235-263 (2012).
- Trevisiol, A., et al. Monitoring ATP dynamics in electrically active white matter tracts. eLife. 6, e24241 (2017).
- Imamura, H., et al. Visualization of ATP levels inside single living cells with fluorescence resonance energy transfer-based genetically encoded indicators. Proceedings of the National Academy of Sciences of the United States of America. 106, 15651-15656 (2009).
- Lerchundi, R., et al. FRET-based imaging of intracellular ATP in organotypic brain slices. Journal of Neuroscience Research. , 1-13 (2018).
- Ehrengruber, M. U., et al. Gene transfer into neurons from hippocampal slices: comparison of recombinant Semliki Forest Virus, adenovirus, adeno-associated virus, lentivirus, and measles virus. Molecular and Cellular Neurosciences. 17, 855-871 (2001).
- Woo, J., et al. Functional Characterization of Resting and Adenovirus-Induced Reactive Astrocytes in Three-Dimensional Culture. Experimental Neurobiology. 26, 158-167 (2017).
- Close, B., et al. Recommendations for euthanasia of experimental animals: Part 2. DGXT of the European Commission. Laboratory Animals. 31, 1-32 (1997).
- Benediktsson, A. M., Schachtele, S. J., Green, S. H., Dailey, M. E. Ballistic labeling and dynamic imaging of astrocytes in organotypic hippocampal slice cultures. Journal of Neuroscience Methods. 141, 41-53 (2005).
- Lanjakornsiripan, D., et al. Layer-specific morphological and molecular differences in neocortical astrocytes and their dependence on neuronal layers. Nature Communications. 9, 1623 (2018).
- Bushong, E. A., Martone, M. E., Ellisman, M. H. Examination of the relationship between astrocyte morphology and laminar boundaries in the molecular layer of adult dentate gyrus. The Journal of Comparative Neurology. 462, 241-251 (2003).
- Frotscher, M., Zafirov, S., Heimrich, B. Development of identified neuronal types and of specific synaptic connections in slice cultures of rat hippocampus. Progress in Neurobiology. 45, vii-xxviii (1995).
- Galimberti, I., et al. Long-term rearrangements of hippocampal mossy fiber terminal connectivity in the adult regulated by experience. Neuron. 50, 749-763 (2006).
- Stoppini, L., Buchs, P. A., Muller, D. A simple method for organotypic cultures of nervous tissue. Journal of Neuroscience Methods. 37, 173-182 (1991).
- Forster, E., Zhao, S., Frotscher, M. Laminating the hippocampus. Nature Reviews. Neuroscience. 7, 259-267 (2006).
- Holopainen, I. E. Organotypic Hippocampal Slice Cultures: A Model System to Study Basic Cellular and Molecular Mechanisms of Neuronal Cell Death, Neuroprotection, and Synaptic Plasticity. Neurochemical Research. 30, 1521-1528 (2005).
- Teschemacher, A. G., et al. Targeting specific neuronal populations using adeno- and lentiviral vectors: applications for imaging and studies of cell function. Experimental Physiology. 90, 61-69 (2005).
- Kantor, B., Bailey, R. M., Wimberly, K., Kalburgi, S. N., Gray, S. J. Methods for gene transfer to the central nervous system. Advances in Genetics. 87, 125-197 (2014).
- Mächler, P., et al. In Vivo Evidence for a Lactate Gradient from Astrocytes to Neurons. Cell Metabolism. 23, 94-102 (2016).
- Schreiner, A. E., Berlinger, E., Langer, J., Kafitz, K. W., Rose, C. R. Lesion-Induced Alterations in Astrocyte Glutamate Transporter Expression and Function in the Hippocampus. ISRN Neurology. 2013, 893605 (2013).
- Haber, M., Zhou, L., Murai, K. K. Cooperative astrocyte and dendritic spine dynamics at hippocampal excitatory synapses. The Journal of Neuroscience: The Official Journal of the Society for Neuroscience. 26, 8881-8891 (2006).
- Neary, J. T., Kang, Y., Tran, M., Feld, J. Traumatic injury activates protein kinase B/Akt in cultured astrocytes: role of extracellular ATP and P2 purinergic receptors. Journal of Neurotrauma. 22, 491-500 (2005).
- Xia, J., et al. Neurons respond directly to mechanical deformation with pannexin-mediated ATP release and autostimulation of P2X7 receptors. The Journal of Physiology. 590, 2285-2304 (2012).
- Ainscow, E. K., Mirshamsi, S., Tang, T., Ashford, M. L., Rutter, G. A. Dynamic imaging of free cytosolic ATP concentration during fuel sensing by rat hypothalamic neurones: evidence for ATP-independent control of ATP-sensitive K+ channels. The Journal of Physiology. 544, 429-445 (2002).
- Arcuino, G., et al. Intercellular calcium signaling mediated by point-source burst release of ATP. Proceedings of the National Academy of Sciences of the United States of America. 99, 9840-9845 (2002).
- Rajendran, M., Dane, E., Conley, J., Tantama, M. Imaging Adenosine Triphosphate (ATP). The Biological Bulletin. 231, 73-84 (2016).
- Rangaraju, V., Calloway, N., Ryan, T. A. Activity-driven local ATP synthesis is required for synaptic function. Cell. 156, 825-835 (2014).
- Chatton, J. Y., Pellerin, L., Magistretti, P. J. GABA uptake into astrocytes is not associated with significant metabolic cost: implications for brain imaging of inhibitory transmission. Proceedings of the National Academy of Sciences of the United States of America. 100, 12456-12461 (2003).
- Magistretti, P. J., Chatton, J. Y. Relationship between L-glutamate-regulated intracellular Na+ dynamics and ATP hydrolysis in astrocytes. Journal of Neural Transmission (Vienna). 112, 77-85 (2005).
- Langer, J., et al. Rapid sodium signaling couples glutamate uptake to breakdown of ATP in perivascular astrocyte endfeet. Glia. 65, 293-308 (2017).
- Yaginuma, H., et al. Diversity in ATP concentrations in a single bacterial cell population revealed by quantitative single-cell imaging. Scientific Reports. 4, 6522 (2014).
- Tantama, M., Martinez-Francois, J. R., Mongeon, R., Yellen, G. Imaging energy status in live cells with a fluorescent biosensor of the intracellular ATP-to-ADP ratio. Nature Communications. 4, 2550 (2013).
- Nakano, M., Imamura, H., Nagai, T., Noji, H. Ca2+ Regulation of Mitochondrial ATP Synthesis Visualized at the Single Cell Level. ACS Chemical Biology. 6, 709-715 (2011).
- Mollajew, R., Toloe, J., Mironov, S. L. Single KATP channel opening in response to stimulation of AMPA/kainate receptors is mediated by Na+ accumulation and submembrane ATP and ADP changes. The Journal of Physiology. 591, 2593-2609 (2013).
- Pathak, D., et al. The Role of Mitochondrially Derived ATP in Synaptic Vesicle Recycling. The Journal of Biological Chemistry. 290, 22325-22336 (2015).
- Karus, C., Mondragao, M. A., Ziemens, D., Rose, C. R. Astrocytes restrict discharge duration and neuronal sodium loads during recurrent network activity. Glia. 63, 936-957 (2015).
- Larsen, B. R., Stoica, A., MacAulay, N. Managing Brain Extracellular K+ during Neuronal Activity: The Physiological Role of the Na+/K+-ATPase Subunit Isoforms. Frontiers in Physiology. 7, 141 (2016).
- Ruminot, I., et al. NBCe1 mediates the acute stimulation of astrocytic glycolysis by extracellular K+. The Journal of Neuroscience : The Official Journal of the Society for Neuroscience. 31, 14264-14271 (2011).

