Loss- and Gain-of-function Approach to Investigate Early Cell Fate Determinants in Preimplantation Mouse Embryos
Özet
The goal of this protocol is to describe a loss- and gain-of function method that is applicable to identify neogenin as a stage-specific receptor that leads to trophectoderm and inner cell mass differentiation in preimplantation mouse embryos.
Abstract
Gene silencing and overexpression techniques are instrumental for the identification of genes involved in embryonic development. Direct target gene modification in preimplantation embryos provides a means to study the underlying mechanisms of genes implicated in, for instance, cellular differentiation into the trophectoderm (TE) and the inner cell mass (ICM). Here, we describe a protocol that examines the role of neogenin as an authentic receptor for initial cell fate determination in preimplantation mouse embryos. First, we discuss the experimental manipulations that were used to produce gain and loss of neogenin function by microinjecting neogenin cDNA and shRNA; the effectiveness of this approach was confirmed by a strong correlation between the pair-wise expression levels of either red fluorescent protein (RFP) or green fluorescent protein (GFP) and the immunocytochemical quantification of neogenin expression. Secondly, overexpression of neogenin in preimplantation mouse embryos leads to normal ICM development while neogenin knockdown causes the ICM to develop abnormally, implying that neogenin could be a receptor that relays extracellular cues to drive blastomeres to early cell fates. Given the success of this detailed protocol in investigating the function of a novel embryonic developmental stage-specific receptor, we propose that it has the potential to aid in exploration and identification of other stage-specific genes during embryogenesis.
Introduction
Preimplantation embryonic development can be divided into several distinct stages, from the one-cell stage to the morula and the blastocyst. Much evidence suggests that polarity and positional cues play a role in early cell fate determination into the trophectoderm (TE) and the inner cell mass (ICM). However, the nature of the cues, how they are transduced into cellular signals, and the physiological contexts in which such signals are capable of initiating cell lineage differentiation are not known. These differentiated cells then undergo specialization, beginning to take on characteristic structures and functions needed for embryo proper formation and growth of the placenta1-3.
Pre-implantation embryos are particularly amenable to manipulation by direct injection of modified genetic materials like siRNA or target cDNA and thus can be utilized to study specific target molecules. There is a growing understanding that genetic analysis of vertebrate embryos is critical to advancing our understanding of embryonic development4. Precise introduction of a wild-type gene or a mutant form into an embryo in a timely context to accomplish gain- or loss-of-function of the gene has greatly facilitated the study of developmentally regulated genes. Loss- and gain-of-function via microinjection of genetic materials into individual early non-mammalian and mammalian embryos is relatively simple because of their large size and great receptivity5. Microinjection is typically performed using non-viral vectors. Particular advantage has been taken of the ease of using non-viral vectors over viral vectors and transgenes. A rapid loss- or gain-of-function expression system in mouse embryos has been developed that allows us to dissect and understand gene functions in vertebrate embryology6,7.
Fluorescent labeling of embryos would greatly facilitate the selection of microinjected or genetically manipulated embryos and at the same time grant a means to indirectly quantify the expression level of microinjected siRNA or cDNA based on fluorescent intensity8. To accomplish this labeling, fluorescent protein cDNA, GFP or RFP, are co-injected as either fusion constructs or separately. The fluorescence intensity of GFP or RFP reveals the extent of expression of siRNA or foreign DNA to ensure that loss- or gain-of-function has been accomplished.
Here, we present a micromanipulation protocol for loss- and gain-of- function technique that allowed us to identify neogenin as a receptor that relays extracellular cues important in early cell differentiation in preimplantation mouse embryos.
Protocol
NOTE: All procedures for animal breeding and cares were conducted according to the IACUC regulations of Sahmyook University, Seoul, S. Korea.
1. Superovulation, Breeding and Oviduct Isolation
- Maintain inbred C57BL/6 mice under the following conditions: 22 ± 3 °C, ~60% humidity, 12 hr light/dark cycle, and water and food ad libitum.
- Induce superovulation of 3-5 week-old female mice by an intraperitoneal injection of 5 IU pregnant mare serum gonadotropin (PMSG) at 0.1 ml/head followed 48 hr later by an intraperitoneal injection of 5 IU human chorionic gonadotropin (hCG) at 0.1 ml/head.
- Immediately following hCG injection, mate superovulation-induced females with sexually mature males of the same strain by keeping them in the same cage overnight.
- Next morning, confirm successful mating by the presence of a mating plug or vaginal plug on the female genital tract.
- Sacrifice pregnant female mice by CO2 intoxication followed by cervical dislocation 18-20 hr after hCG injection.
- Open the abdominal cavity by cutting the skin and then the peritoneal layer with fine scissors.
- Pick up the uterine horns with fine forceps and pull away the uterus, oviduct, ovary, and fat pad gently from the body cavity.
- Cut the area between the oviduct and the ovary with fine scissors. Reposition the forceps and cut the uterus near the oviduct, leaving at least 1 cm of the upper part of the uterus attached.
- Transfer the oviductal ampulla to a 35 mm Petri dish containing M16 medium at room temperature. Pool the oviducts from several mice in the same dish.
- Place the dishes under a stereomicroscope for retrieval of embryos.
2. Retrieval and Culture of 2-Pronuclear (2-PN) Embryos
- Cut the end of a 30 or 32 G hypodermic needle, grind it into a blunt tip, and use it as a flushing needle.
- Use fine forceps to slide the end of the oviduct onto the flushing needle. Gently press the tip of the flushing needle against the bottom of the dish to hold it in place. Flush the oviduct with ~0.1 ml of M16 medium to release the 2-PN embryos into a Petri dish.
- Recover the 2-PN embryos along with surrounding cumulus masses from the flushed M16 medium under the stereomicroscope using a sterile glass pipette and transfer them into a new Petri dish.
- Dissociate cumulus cells from the 2-PN embryos by enzymatic digestion with 1.0 ml of 0.1-0.5% hyaluronidase in Dulbecco's phosphate-buffered saline (DPBS) at 37 °C for 5-10 min.
- Denude embryos by gently pipetting with a glass pipette and physical removal of cumulus cells.
- Wash denuded embryos three times with 30-50 ml of fresh phosphate-buffered saline (PBS) per embryo.
- Incubate embryos in a 35 mm plastic Petri dish in M16 media supplemented with 10 mg/ml bovine serum albumin (BSA, Fraction V) at 37 °C in 5% CO2 in a humidified incubator until the microinjection is made, which is usually less than 4 hr later.
3. Embryo Reverse Transcription (RT) and Polymerase Chain Reaction (PCR)
- Collect at least 10 embryos from each stage up to the blastocyst stage and pool them in 4.0 μl of 5x reverse transcriptase pre-mixture solution containing reverse transcriptase, RNase inhibitor, oligo dT primer, random 6mers, dNTP mixture, and the reaction buffer in a PCR tube.
- Add RNase-free distilled H2O to a total volume of 20 μl and sonicate the pooled embryos for 30 sec at 200 W. Initiate the RT reaction immediately at 42 °C for 1 hr followed by 5 min incubation at 95 °C.
- For each 5.0 μl of cDNA solution generated, conduct normal PCR amplification with primers for neogenin, Cdx2, Sox2, Tead4, Nanog, Oct3/4, or β-actin (primer sequences given in Table 1. PCR consists of 40 cycles of 15 sec incubation at 95 °C, 30 sec at annealing temperature (shown in Table 1), and 30 sec at 72 °C.
- Separate PCR products by electrophoresis on a 2% agarose gel and visualize the gel under UV light after staining with ethidium bromide.
- Normalize target gene expression against β-actin levels.
4. Immunocytochemistry of Embryos
- Fix embryos from each stage with 4% paraformaldehyde in PBS for 30 min at room temperature followed by a brief washing 3 times with PBS containing 0.01% BSA.
- Permeabilize Cell membranes by incubating 10 embryos in 1.0 ml of PBS containing 0.1% Tween 20 and 0.1% TritonX-100 at room temperature for 10 min.
- To block nonspecific binding incubate the permeabilized embryos in 1.0 ml of PBS supplemented with 10% normal goat serum for 30 min at room temperature.
- Incubate the blocked embryos with rabbit anti-neogenin antibodies at 1:100 dilution in PBS containing 0.1% BSA overnight at 4 °C.
- After three washes for 30 sec each in drops of PBS, incubate embryos with either Alexa 488-conjugated goat anti-rabbit IgG or Alexa 568-conjugated goat anti-rabbit IgG at 1:500 dilution in PBS/BSA solution overnight at 4 °C.
- To visualize actin filaments, incubate embryos in 1 µg/ml phalloidin in PBS for 1 hr at room temperature.
- Stain the nuclei by adding 5 ml PBS containing 1 µg/ml DAPI (4',6-diamidino-2-phenylindole, dihydrochloride) for 5 min at room temperature.
- Wash embryos three times briefly with PBS.
- Transfer embryos to a glass slide and cover them with a drop of mineral oil.
- Take images at 1,000X magnification with a confocal microscope with an excitation of the appropriate wave length.
5. Preparation of Neogenin-RFP and Neogenin-siRNA GFP Plasmids
- Subclone cDNA encoding mouse neogenin into a Red Fluorescent Protein (RFP)-containing vector, resulting in neogenin-flag-RFP.
- Subclone small hairpin RNA targeting neogenin into an Emerald Green Fluorescent Protein (EmGFP)-containing vector, resulting in pcDNA-EmGFP-miR-neogenin (shown in Figure 1).
- Amplify both neogenin-flag-RFP and pcDNA-EmGFP-miR-neogenin plasmids and purify them with conventional methods.
- Adjust the final concentrations of plasmids to ~1.0 µg/ml in sterile Tris-EDTA (TE) buffer.
6. Microinjection of Plasmids into 2-PN Embryos
- Wash the denuded 2-PN embryos once, briefly, with fresh M16 media.
- Centrifuge the 2-PN embryos for 10 min at 1,000 x g in a table-top centrifuge to allow for observation of the pronuclei.
- Incubate the embryos in a micro drop of 20-30 µl of M16 media per embryo under mineral oil at 37 °C in 5% CO2 for an additional 1-2 hr.
- Manufacture injection pipettes and holding pipettes by pulling borosilicate-glass capillary tubing (O.D = 1.2 mm; I.D = 0.94 mm) with a mechanical puller.
- Fabricate injection pipettes to have blunt tips and polished openings of <500 µm tip length and 1-2 µm tip inner diameter using a microgrinder and a microforger.
- Fabricate holding pipettes such that they have blunt tips and polished openings with an inner diameter of 20 µm and an outer diameter of 100 µm.
- Load injection pipettes with a sufficient amount (>200 nl) of plasmid solution at 1.0 µg/µl.
- Microinject ~10 pl of plasmid solution for each 2-PN embryo into one of the pronuclei using a microinjector attached to a motorized micromanipulator; during this process, keep embryos in position by applying negative pressure with a holding pipette.
- After microinjection, wash the 2-PN embryos 3 times with fresh M16 media for less than 1 min each time.
- Culture the 2-PN embryos in a drop of fresh M16 media on a plastic culture dish covered by a mineral oil drop to prevent media evaporation.
- Observe the embryos at 24 hr intervals under a differential interference contrast (DIC) inverted microscope at 200X magnification.
Representative Results
We discovered that neogenin is transiently expressed during the early developmental stages of preimplantation mouse embryos, appearing as early as at the 2-cell stage and lasting until the early morula but becoming deficient at the late morula and blastocyst stages (Figure 2A). In addition, the spatial distribution of neogenin was restricted mainly to outside cells. The results of RT-PCR analysis were consistent with the early and transient nature of neogenin expression, peaking at the 4-cell stage but completely lacking at the 16-cell stage or later (Figure 2B). By contrast, F-actin did not reveal such a transient and polarized expression pattern.
We next investigated whether neogenin levels could be manipulated by microinjection of either neogenin cDNA vectors (neogenin gain) or vectors harboring shRNA targeting neogenin (neogenin loss) into the 2-PN zygote. To visually differentiate neogenin gain from neogenin loss, RFP and GFP were co-expressed as indicators (Figure 3), and the resulting neogenin expression level was confirmed both by immunofluorescence and by immunoblotting (Figure 4).
Figure 5 shows representative images of embryos at each stage after receiving either neogenin shRNA or neogenin cDNA at the 2-PN stage. There were no apparent gross morphological differences between neogenin loss and neogenin gain embryos, and no developmental potential differences at least until the blastocyst stage (Table 2). In fact, both the number of surviving embryos at each stage and the number of arrested embryos were not significantly different.
However, ICM development was less pronounced in neogenin loss than neogenin gain embryos as evidenced by a higher expression of ICM-specific Oct3/4 in neogenin gain embryos (Figure 6A) and by higher numbers of Oct3/4-positive ICM cells per blastocyst in neogenin gain than neogenin loss embryos (Figure 6B). Furthermore, RT-PCR analysis revealed a strong correlation between the expression level of three transcription factors and that of neogenin. In neogenin loss blastocysts, little Oct3/4, Sox2, and Nanog were detected, which is in sharp contrast to a significant increase in the expression of all three transcription factors in neogenin gain over control embryos (Figure 6C). Unexpectedly, the expression levels of Cdx2 and Tead4, transcription factors implicated in TE differentiation/maintenance6,7, were less influenced by the expression level of neogenin, validating that up-regulation of neogenin leads to the activation of transcriptional regulators specific for ICM but not for TE establishment. All data shown are modified from reference9.
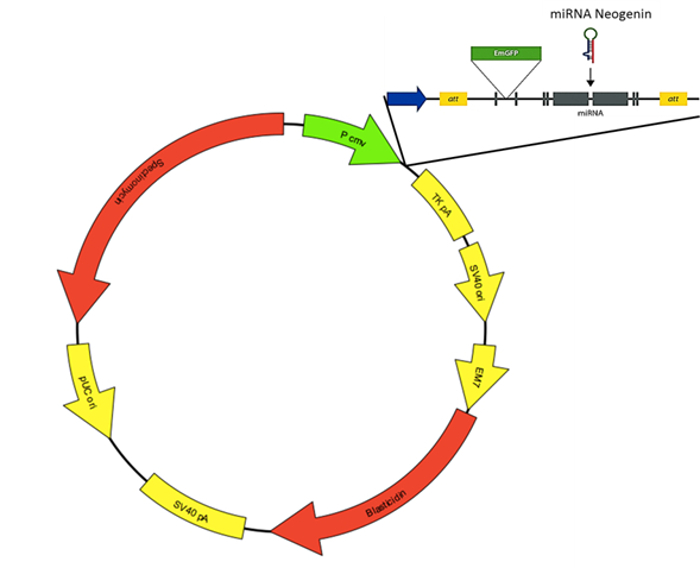
Figure 1: The Structure of pcDNA-EmGFP-miR-neogenin. Please click here to view a larger version of this figure.
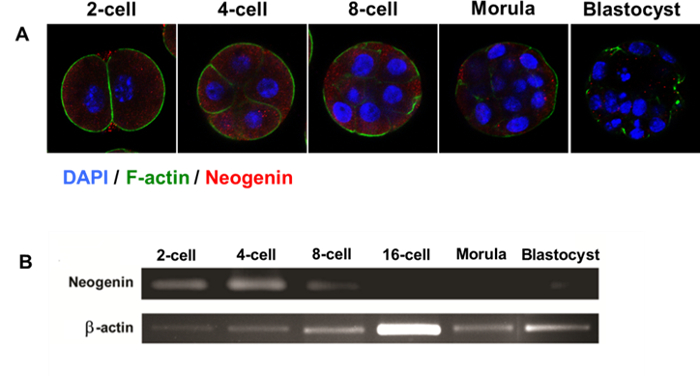
Figure 2: Expression of Neogenin During Mouse Embryonic Development. (A) Confocal microscopic images of neogenin expression in preimplantation embryos at different developmental stages. (B) The reverse transcription polymerase chain reaction of neogenin mRNA in preimplantation embryos at different developmental stages. β-actin was used as an internal control. Please click here to view a larger version of this figure.
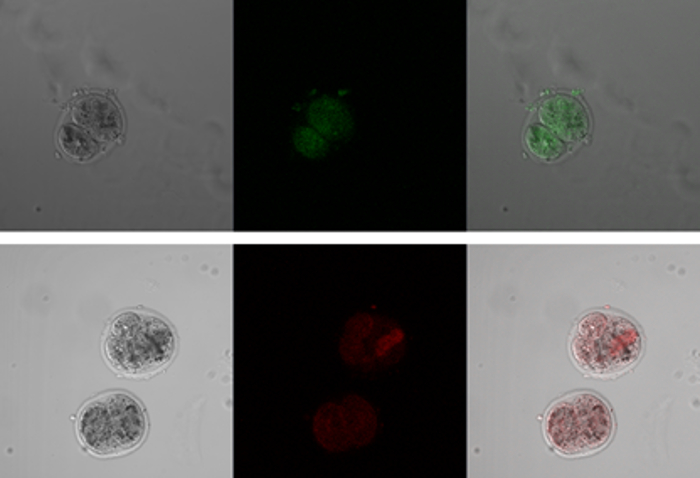
Figure 3: Green Fluorescent Protein (GFP) and Red Fluorescent Protein (RFP) Expression as Indicators for Neogenin Loss and Neogenin Gain, respectively. After microinjection of a neogenin-targeting shRNA vector harboring conjugated GFP or microinjection of a neogenin cDNA vector harboring RFP into 2-PN zygotes, the expression of GFP and RFP was visualized under a fluorescence microscope at the 2-cell and 4-cell stages. Left panel, phase-contrast images; middle and right panels, fluorescence images. Please click here to view a larger version of this figure.
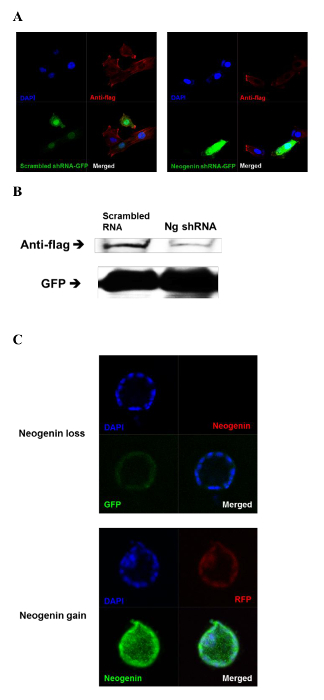
Figure 4: Expression of Neogenin in a Blastocyst After Microinjection of either shRNA Targeting Neogenin or Neogenin cDNA. (A) After microinjection of a neogenin-targeting shRNA vector into 2-PN zygotes, the expression level of neogenin in individual blastocyst cells was evaluated by immunostaining with anti-flag antibodies. In the left panel, scrambled neogenin shRNA vectors were microinjected (control). In the right panel, neogenin-targeting shRNA vectors were microinjected. DAPI, DAPI (blue) was used to stain the nucleus; Anti-flag, visualization of the flag tag on neogenin (red); GFP, green fluorescent protein (green); merged, superimposition of DAPI, anti-flag, and GFP. (B) Whole cell lysates of blastocysts were immunoblotted with anti-flag antibodies. GFP was used as a loading control. Scrambled shRNA, scrambled neogenin shRNA injection; Ng shRNA, neogenin-targeting shRNA injection. (C) The neogenin cDNA vectors or the neogenin-targeting shRNA vectors were microinjected into the 2-PN zygotes and the resulting blastocysts were subjected to immunostaining with anti-neogenin antibodies to measure neogenin expression level. In the upper panel, neogenin-targeting shRNA was injected. Blastocysts were immunostained with anti-neogenin antibodies (red). GFP, green fluorescent protein (green); Merged, superimposition of DAPI, anti-neogenin, and GFP. In the lower panel, neogenin cDNA vectors were microinjected. Blastocysts were immunostained with anti-neogenin antibodies (green). DAPI, DAPI nuclear staining (blue); RFP, red fluorescent protein (red); Merged, superimposition of DAPI, RFP, and anti-neogenin. Please click here to view a larger version of this figure.

Figure 5: Effects of Neogenin Loss or Gain on Embryonic Development. 2-PN mouse embryos were microinjected either with small hairpin RNA (shRNA) targeting neogenin (neogenin loss) or with vectors harboring neogenin cDNA (neogenin gain) and were cultured until reaching the blastocyst stage. To differentiate neogenin loss from neogenin gain embryos, GFP and RFP were co-expressed, respectively. Phase-contrast images of embryos at different developmental stages are shown. Please click here to view a larger version of this figure.
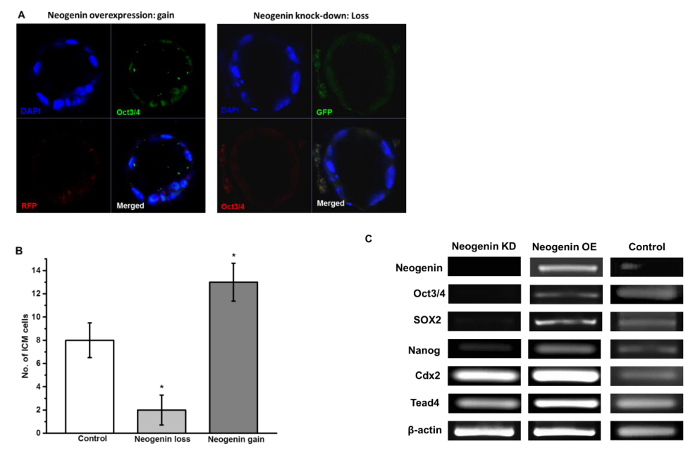
Figure 6: Neogenin Overexpression Favors ICM Differentiation. (A) ICM cells in blastocysts were viewed by immunostaining for Oct3/4. DAPI was used to stain the nucleus. (B) The number of Oct3/4-positive ICM cells in a blastocyst of control, neogenin loss, and neogenin gain embryos are represented as the mean ± SEM from three independent experiments with at least 10 embryos used in each experiment. *Significant differences from control at p <0.05 by Student's t-test. (C) RT-PCR analysis of Oct3/4, Sox2, Nanog, Cdx2, and Tead4 mRNAs from blastocysts of neogenin loss, neogenin gain, and control embryos. β-actin was used as an internal control. Please click here to view a larger version of this figure.
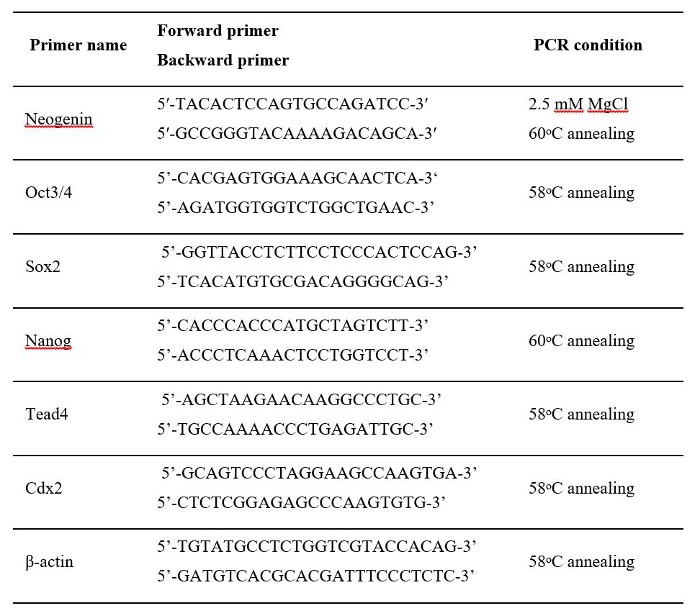
Table 1: Sequences of the Primers and PCR Conditions Used for RT-PCR.

Table 2: The Number of Surviving Mouse Embryos at Each Developmental Stage After Receiving Neogenin shRNA or Neogenin cDNA at the 2-PN Stage.
Discussion
In the present protocol, we demonstrate novel methods of microinjection of genetic materials, either cDNA or shRNA, into the 2-PN mouse embryos to explore the role of neogenin in early cell differentiation during mouse embryogenesis. Genetic modification of preimplantation embryos is a powerful technique in uncovering key information about underlying molecular mechanisms for, for example, the first cell lineage determination. Genetic modification is one of the most commonly used methods for ascertaining gene function. With relatively large receptibility of the 2-PN embryos for foreign genetic materials and the feasibility of microinjection of cDNA and shRNA into the 2-PN embryos, this embryo manipulation technique can be implemented with minimal physical disruption to the embryo, not to mention the intrinsic complementarity associated with this genetic manipulation.
Considering that cytoplasmic injection is easier and less detrimental to survival than nuclear injection but, nonetheless, a higher expression of foreign DNA associated with nuclear injection, one improvement that should be emphasized is the use of centrifugation to position the pronuclei before microinjection into the nucleus. The most technically sophisticated and demanding step is the microinjection of foreign DNA into the pronucleus of a fertilized ovum. This step is critical and requires considerable technical proficiency and extensive training to master the microinjection procedure. Once this skill is acquired however, technical variability and errors become minimal. The routine survival of microinjected embryos is between 80-90% in our facility.
Unlike this study, other researchers positioned embryos by holding the pipette such that a pronucleus near the plasma membrane was close to the microneedle. The micro-needle is then inserted into the pronucleus10,11. We experienced some difficulty visualizing the pronucleus correctly under the microscope without centrifugation. Obviously, centrifugation brings the nucleus close to the plasma membrane for better identification. At the same time, there should be some room for improvement for better visualization thus better positioning of the pronucleus.
Contrary to transgenic mice production, our protocol for microinjection of plasmids into embryos is a transient transfection by nature, and thus suitable for dissecting gene function during preimplantation embryonic development. Therefore, our protocol for a loss- and gain-of-function technique could be further generalized to identify signaling molecules involved in early embryonic development.
In addition, neogenin signaling could be highly beneficial to the development of embryonic stem cell lines given that neogenin and its ligands are likely to enhance stem cell specific transcription factors such as Oct3/4, Sox2, and Nanog.
Açıklamalar
The authors have nothing to disclose.
Acknowledgements
The authors would also like to acknowledge Dr. Xiong's group at Georgia Health Sciences University for manufacturing and sharing the constructs for neogenin cDNA and shRNA vectors. This study was supported by grants from the Basic Science Research Program (2013R1A1A4A01012572) funded by the Korean Research Foundation and by a research grant from Sahmyook University.
Materials
| M16 medium, | Gibco BRL (Grand Island, NY) | M7292 LOT# 11A832 | |
| Goat serum, | Dako (Glostrup, Denmark) | X0907 | |
| PMSG | Folligon, Intervet, Holland | G4877-1000IU LOT#SLBD0719V | |
| Mineral olie | Sigma Aldrich | CG5-1VL LOT# SLBC6783V | |
| human chorionic gonadotropin and pregnant mare serum gonadotropin | (Intervet, Holland) | (invitrogen , 15596-026) | |
| SuperScript® III Reverse Transcriptase | lifetechnologies | 18080-044 | |
| PCR pre mixture | (Bioneer, Daejon, S. Korea) | GenDEPOT , A0224-050 | |
| Agarose (molecular grade) | BioRad | 161-3101 | |
| Paraformaldehyde Solution, 4% in PBS | Affymetrix USA | 19943 | |
| polyclonal rabbit anti-neogenin antibody | Santa Cruz Biotechnology, US | SC-15337 | |
| Alexa fluor 488 labeled anti-rabbit antibody | Molecular Probes (Invitrogen, USA) | A-11094 | |
| Alexa fluor 555 labeled anti-rabbit antibody | Molecular Probes (Invitrogen, USA) | A-21428 | |
| Alexa Fluor® 555 Phalloidin | Molecular Probes (Invitrogen, USA) | A34055 | |
| DAPI (4',6-Diamidino-2-Phenylindole, Dihydrochloride) | Invitrogen, USA | D1306 | |
| Recombinant Human RGM-C/Hemojuvelin | R&D systems | 3720-RG | |
| all plasmid constructs | Prof. Wen Cheng Xiong at Georgia Health Sciences University (Agusta, GA). | the present studies were kindly provided by | |
| Neon® Transfection System | lifetech | MPK10096 | |
| Stereo Microscrope | Nikon | SMZ1000 | |
| Micromainpulation system with Nikon | Nikon | Narishige ONM-1 | |
| MicroInjector | Nikon Narishige | GASTIGHT #1750 | |
| Holder | Nikon Narishige | Narishige IM 16 | |
| Microfoge | Nikon Narishige | Narishige MF-900 | |
| grinder | Narishige | EG400 | |
| Puller | Sutter Instrumnet company | P-97 | |
| CO2 incubator | Thermo Scientific Forma | EW-39320-16 | |
| Veriti® 384-Well Thermal Cycler | lifetechnologies | 4388444 |
Referanslar
- Yamanaka, Y., Ralston, A., Stephenson, R. O., Rossant, J. Cell and molecular regulation of the mouse blastocyst. Dev. Dyn. 235 (9), 2301-2314 (2006).
- Sasaki, H. Mechanisms of trophectoderm fate specification in preimplantation mouse development. Dev. Growth Differ. 52 (3), 263-273 (2010).
- Nishioka, N., Yamamoto, S., Kiyonari, H., Sato, H., Sawada, A., Ota, M., et al. Tead4 is required for specification of trophectoderm in pre-implantation mouse. Mech. Dev. 125 (3-4), 270-283 (2008).
- Ovitt, C. E., Schöler, H. R. The molecular biology of Oct-4 in the early mouse embryo. Mol. Hum. Reprod. 4 (11), 1021-1031 (1998).
- Stein, P., Schindler, K. Mouse Oocyte Microinjection, Maturation and Ploidy Assessment. J. Vis. Exp. (53), e2851 (2011).
- Shin, M. R., Cui, X. S., Jun, J. H., Jeong, Y. J., Kim, N. H. Identification of mouse blastocyst genes that are down regulated by double-stranded RNA-mediated knockdown of Oct-4 expression. Mol. Reprod. Dev. 70 (4), 390-396 (2005).
- Khang, I., Sonn, S., Park, J. -. H., Rhee, K., Park, D., Kim, K. Expression of epithin in mouse preimplantation development: Its role in compaction. Dev. Biol. 281, 134-144 (2005).
- Prieto, D., Aparicio, G., Machado, M., Zolessi, F. R. Application of the DNA-Specific Stain Methyl Green in the Fluorescent Labeling of Embryos. J. Vis. Exp. (99), e52769 (2015).
- Lee, J. H., Choi, S. S., Kim, H. W., Xiong, W. C., Min, C. K., Lee, S. J. Neogenin as a receptor for early cell fate determination in preimplantation mouse embryos. PLoS One. 9 (7), e101989 (2014).
- Gordon, J. W., Scangos, G. A., Plotkin, D. J., Barbosa, J. A., Ruddle, F. H. Genetic transformation of mouse embryos by microinjection of purified DNA. Proc. Natl. Acad. Sci. USA. 77 (12), 7380-7384 (1980).
- Brinster, R. L., Chen, H. Y., Trumbauer, M. E., Yagle, M. K., Palmiter, R. D. Factors affecting the efficiency of introducing foreign DNA into mice by microinjecting eggs. Proc. Natl. Acad. Sci. USA. 82, 4438-4442 (1985).

