Visualize Drosophila Leg Motor Neuron Axons Through the Adult Cuticle
Summary
Here we describe a protocol to visualize the axonal targeting with a florescent protein in adult legs of Drosophila by fixation, mounting, imaging, and post-imaging steps.
Abstract
The majority of work on the neuronal specification has been carried out in genetically and physiologically tractable models such as C. elegans, Drosophila larvae, and fish, which all engage in undulatory movements (like crawling or swimming) as their primary mode of locomotion. However, a more sophisticated understanding of the individual motor neuron (MN) specification—at least in terms of informing disease therapies—demands an equally tractable system that better models the complex appendage-based locomotion schemes of vertebrates. The adult Drosophila locomotor system in charge of walking meets all of these criteria with ease, since in this model it is possible to study the specification of a small number of easily distinguished leg MNs (approximately 50 MNs per leg) both using a vast array of powerful genetic tools, and in the physiological context of an appendage-based locomotion scheme. Here we describe a protocol to visualize the leg muscle innervation in an adult fly.
Introduction
Like the vertebrate limb, the Drosophila adult leg is organized into segments. Each fly leg contains 14 muscles, each of which comprises multiple muscle fibers1,2. The cell bodies of the adult leg MNs are located in the T1 (prothoracic), T2 (mesothoracic), and T3 (metathoracic) ganglia on each side of the ventral nerve cord (VNC), a structural analogous to the vertebrate spinal cord (Figure 1). There are approximately 50 MNs in each ganglia, which target muscles in four segments of the ipsilateral leg (coxa, trochanter, femur, and tibia) (Figure 1)3. Importantly, each individual adult leg MN has a unique morphological identity that is highly stereotyped between animals3,4. All these unique MNs are derived from 11 stem cells, called neuroblasts (NBs) producing leg MNs during the larval stages3,4. At the end of the larval stages all the immature postmitotic MNs differentiate during metamorphosis to acquire their specific dendritic arbors and axonal terminal targets that define their unique morphology3,4. Previously we tested the hypothesis that a combinatorial code of transcription factors (TFs) specifies the unique morphology of each Drosophila adult leg MN5. As a model, we used lineage B, one of the 11 NB lineages which produces seven out of the MNs and demonstrated that a combinatorial code of TFs expressed in postmitotic adult leg MNs dictates their individual morphologies. By reprograming the TF code of MNs we have been able to switch MN morphologies in a predictable manner. We call these TFs: mTFs (morphological TFs)5.
One of the most challenging parts of the morphological analyses of adult MNs is to visualize the axons through a thick and auto-fluorescent cuticle with high resolution. We usually label axons with a membrane-tagged GFP that is expressed in MNs with a binary expression system, such as DVglut-Gal4/UAS-mCD8::GFP or DVglut-QF/ QUAS mCD8::GFP, where DVglut is a strong driver expressed in motoneurons6. By combining these tools with other clonal techniques such as mosaic analysis with a repressible marker (MARCM)7, cis-MARCM8, or MARCMbow5, we can restrict the GFP expression to subpopulations of MNs making the phenotypic analysis of axons easier. We have generated a protocol in order to keep leg MN axonal morphology intact for imaging and subsequent 3D reconstruction by addressing specific issues intrinsic to the adult Drosophila leg such as (1) fixation of the internal structures of the adult leg without affecting axon morphology, endogenous fluorescent expression, and leg musculature, (2) mounting of the leg to preserve the overall structure under a coverslip and in the appropriate orientation for imaging, and (3) image processing to obtain the cuticle background as well as axonal fluorescent signal. While this protocol has been detailed for the detection of fluorescent expression in MN axons, it can be applied to visualize other components of leg neuromusculature in arthropods.
Protocol
1. Leg Dissection and Fixation
- Take a glass multi-well plate and fill appropriate number of wells with 70% ethanol. Add 15–20 CO2-anesthetized flies (of either sex and any age) to each well and by using a brush, gently dab the flies into the ethanol solution until flies are fully submerged.
NOTE: This step is to remove the hydrophobicity of the cuticle. Do not wash for more than 1 min, because this increases auto-fluorescence of the cuticle. - Rinse the flies 3 times with 0.3% nonionic surfactant detergent solution in 1x phosphate buffered saline (PBS). Keep the flies in this solution for at least 10 min.
NOTE: Legs are better fixed when including detergent, which is likely to increase penetration of the fixative inside the leg. - Place a multi-well plate on the ice along with a tube of 4% paraformaldehyde (PFA).
NOTE: The preparation of fresh 4% PFA from a 16% PFA ethanol free stock solution is critical. - Use forceps to remove the head and abdomen of the flies without damaging the thoracic segment or the legs.
NOTE: Removing the abdomen makes it easier to hold the fly and dissect the legs. - Dissect the legs from the thoracic segment with forceps and place the legs in the wells containing 4% PFA. For this, push gently but firmly at the coxa-thorax junction using the tip of fine forceps until the leg detaches.
- Fix the legs in 4% PFA overnight at 4 °C (approximately 20 h total).
- Wash the legs with 0.3% nonionic surfactant detergent solution in 1x PBS, 5x for 20 min each.
- Replace the washing buffer with mounting medium. Keep the leg in mounting medium for at least a day prior to mounting to allow for its complete penetration into the leg.
NOTE: If the mounting medium is highly viscous, dilute the mounting medium to 80% with 1x PBS because the sudden change in viscosity can cause the cuticle to collapse and damage the overall structure of the leg. Depending on the Gal4 driver, flies can be preserved for 1 to 3 weeks at 4 °C in mounting media until mounting.
2. Leg Mounting
- Place approximately 20 µL of 70% glycerol on the left-hand side of a microscope slide and cover with a square 22 x 22 mm2 coverslip (Figure 2A, B). Pipette about 10 µL of mounting medium along a line parallel to and at a small distance from the right edge of this coverslip. Add another 30 µL of mounting medium further on the right side of the slide (Figure 2C).
NOTE: When applying a coverslip over the legs (see below) the mounting medium will gently spread under the coverslip and around the legs without displacing them. - Using fine forceps lift the leg from the solution and gently put it on the mounting medium near the left coverslip. Do the same for each leg and align them from top to bottom (Figure 2D).
- Lift and transfer the legs in a drop of medium held between both tips of the forceps. Orient the legs in two ways: external side up or down.
- Once all the legs (up to 6–8 legs can be mounted) are properly aligned, put a second coverslip over the legs such that this coverslip rests slightly on the previously placed coverslip (Figure 2E) to allow for space between the coverslip and the tissue and to prevent the legs from getting damaged (Figure 2G).
NOTE: Alternatively, use sticker wells or orthodontic wax to create space between the coverslip and the slide. - Use a nail polish to secure the position of the coverslips at each corner (Figure 2F).
NOTE: The tissue is now ready to image.
3. Imaging
- Set up a single track using the 488 nm laser and two detectors simultaneously to obtain both the GFP fluorescence and cuticle auto-fluorescence. Using the range control or the slider display in the spectral window of the light path window of the software, set the detection range of one detector (detector 1) between 498–535 nm and that of the other one (detector 2) between 566-652 nm.
NOTE: Typically, the detector 1 should be a GaAsP detector and the detector 2 a photomultiplier tube. The 498-535 channel optimally detects GFP signal but also detects auto fluorescence from the cuticle. However, the 566–652 channel detects only the auto fluorescence from the cuticle (Figure 3A). - Use a 20X or 25X oil immersion objective, 1024 x 1024 pixels resolution, 12-bit depth, and set Z spacing as 1 µm. Set pixel dwell time as approximately 1.58 µs, and average 2 frames/image. Use objectives with high numerical aperture.
- Set all other settings, depending on the confocal microscope and imaging software being used.
- Make sure to obtain a brighter cuticle signal from the 566–652 detector rather than from the 498–535 detector. To do this, use the same laser power of the 488-laser for both detectors. Using the saturation markers, first adjust the gain of detector 1 to obtain a bright enough GFP signal (Figure 3B, D). Then adjust the gain of detector 2 to ensure that some areas with high cuticle signal (edges of legs, joints) produce a saturated signal in this detector (Figure 3C, E).
- If the leg is extended and too large to be imaged in a single frame, use the Tile or Posição option from the microscope imaging software.
- Reconstruct the final images either using the proprietary microscope imaging software or using ImageJ/FIJI freeware (see below).
4. Post Imaging Processing
- Open the confocal stack in ImageJ/FIJI.
- Use the Bioformats plugin (Plugins| Bio-Formats| Bio-formats Importer) in FIJI to open images that are not in .TIF format from proprietary imaging software packages9.
- Split the channels by selecting Image| Color| Split Channels.
NOTE: If images from several positions were made and must be recombined, use the pairwise stitching plugin in FIJI from (Plugins > Stitching > Pairwise Stitching)10,11. - To subtract the cuticle signal from the GFP signal, open the Image Calculator (Process| Image Calculator): select the stack from detector 1 as Image 1 (GFP + cuticle) (Figure 4A), on the operation window select subtract, and select the stack from detector 2 as Image 2 (cuticle) (Figure 4B). As a result, only the endogenous GFP signal (GFP) is obtained (Figure 4C).
- Merge back this stack (GFP) with the ‘cuticle-only’ stack obtained from detector 2 (Figure 4B Image| Color| Merge Channels) to obtain an RGB image comprising of the tissue-specific GFP signal as well as the cuticle signal, which helps identifying the axon arbors within the leg segments (Figure 4D).
- Adjust contrast and brightness of each image (Image| Adjust| Brightness/Contrast) and then generate a single RGB image (Image| Type| RGB Color).
NOTE: To generate a maximum projection of the Z-stack (Image| Stacks| Z Project…), use maximum intensity projection for the GFP signal and average intensity for the cuticle, which can then be adjusted for brightness prior to merging the two channels.
- Alternatively, use a macro for automatic subtraction and processing of images in ImageJ/FIJI. Copy the text in Supplemental File 1 in the macro editor (Plugins| New| Macro), save the macro in the Plugins folder, and restart ImageJ/FIJI once to be able to use the macro.
- To use the macro, open the confocal stack, and open the Brightness/Contrast window (Image| Adjust| Brightness/Contrast). Then run the macro (Plugin| Macro| Run) and follow instructions.
- When asked to specify the operation (Image calculator window), choose Image 1 as stack 1 (GFP), Image 2 as stack 2 (cuticle), and Subtract.
Note: The macro generates a maximal projection image of the processed GFP signal (MAX_Result of stack1), an average projection of the cuticle (AVG_stack2), the result of the substraction of the cuticle stack from the GFP stack (Result of stack1), and the unprocessed cuticle stack (stack2). - When asked to adjust contrast, use the controls in the brightness/control window to adjust the brightness/contrast of the maximal projection image of GFP, and of the average projection of the cuticle, to generate an RGB merged image of both signals showing the GFP in green and the cuticle in gray. Merge Result of stack1, and stack2, to similarly generate a combined GFP and cuticle stack that can be used in the next stage.
- To visualize the legs in three dimensions, use specialized 3D software with the newly generated stacks (Figure 4E).
- Open the RGB stack with 3D software (see Table of Materials). In the pop-up dialog window, select all channels in the mode conversion section and enter the size of a voxel (volume of a pixel).
Note: All necessary information is contained in the image files from whatever proprietary microscope software being used. - On channel 2 module (GFP signal), right-click and select Display | volren. Then, left-click on the volren module. In the properties section (bottom left of the screen) click left on edit and select volrengreen.col. On channel 1 module (cuticle signal) right-click and select Display | volren. Then, left-click on the volren module. In the Properties section left-click on advanced and select ddr (a transparent radiograph-like display), then adjust the gamma value to see the cuticle background (Figure 4E).
- To generate a 3D rotation, right-click on the project stack module. Then select animate| rotate. Left-click on the rotate module.
- In the properties section click on use bbox center. On the rotate module right-click and select compute| movie maker. On the movie maker module click the left mouse button. In the properties section left-click left on Advanced (top right of the properties section).
- In the file name field fill the name of the movie rotation. In the quality field write 1 (max quality). Leave frame at 200 if an 8.3 s rotation is desired (this number can be decreased or increased to modify the speed of the rotation). Then press apply (green button, bottom left of the properties section (See Video 1)).
- Open the RGB stack with 3D software (see Table of Materials). In the pop-up dialog window, select all channels in the mode conversion section and enter the size of a voxel (volume of a pixel).
Representative Results
As shown in Figure 4, this procedure allows excellent imaging of GFP-labeled axons in adult Drosophila legs, together with their terminal arbors. Importantly a clean GFP signal is obtained without any contamination from the fluorescence emitted by the leg cuticle. The signal from the cuticle can then be combined with the GFP signal to identify the positioning of axons in the legs (Figure 4E, Figure 1,and Video 1). Critically, it is important to obtain well-fixed legs. Figure 5 shows examples of a well-fixed (Figure 5A) and a badly-fixed leg (Figure 5B). In the former case the internal structures inside the legs are of a uniform color and the tracheas, which are dark, are visible. A main tracheal tube runs in the center of each leg segment (adjacent to the main nerve trunk) and many thinner ramifications are also visible. In the latter, dark material is present in the tarsus and tibia and the tracheal system is not clearly visible in the femur and coxa: in such cases it is always observed that the signal from fluorescent proteins is degraded being of low intensity or absent altogether. Second, careful dissection of the legs is necessary to obtain all the leg segments (from coxa to tibia) and to avoid mechanical shock to the legs. Third, the legs must be left in mounting medium long enough for it to penetrate the inside of the legs. Sometimes leg segments, especially the femur, appear collapsed — this can be due to lack of penetration of the fixative and/or mounting medium. Finally, one must use high quality microscope objectives, corrected for flatness of field and specially designed for fluorescence and/or apochromatic.
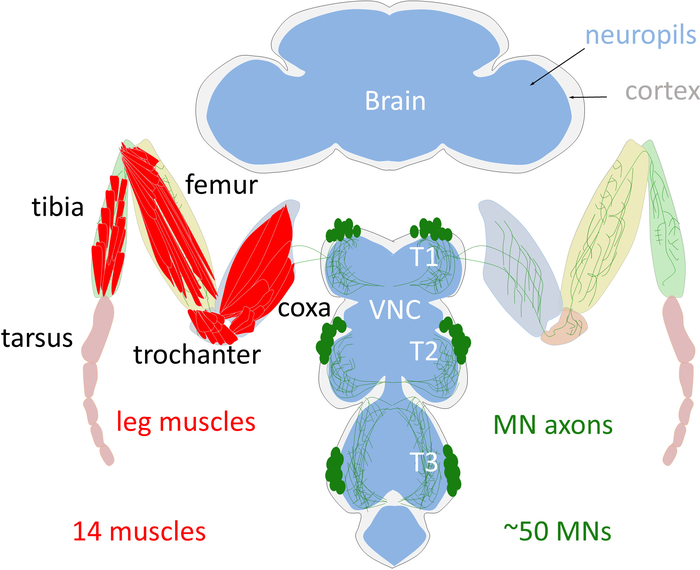
Figure 1: Schema of the adult Drosophila leg motor system. The cell bodies of the adult leg MNs (green) are localized in the cortex (grey) of the thoracic ganglion of the VNC. MNs arborize their dendrites in the leg neuropil (blue) and send their axons into the leg to innervate one of the 14 leg muscles (red). Note that only the T1 legs are schematized. Please click here to view a larger version of this figure.
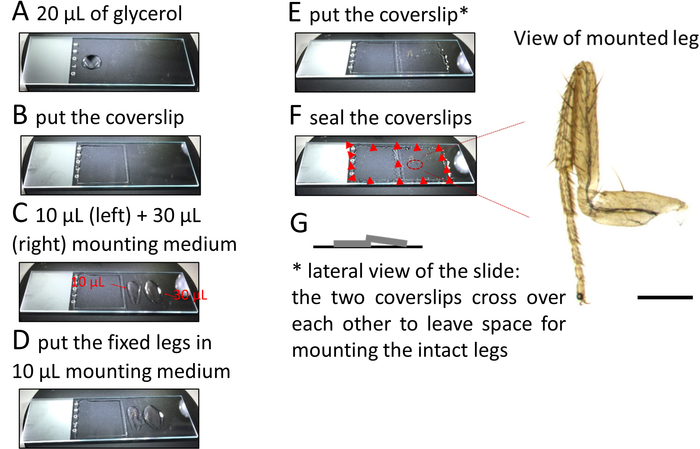
Figure 2: Procedure to mount legs on microscope slides. Please click here to view a larger version of this figure.
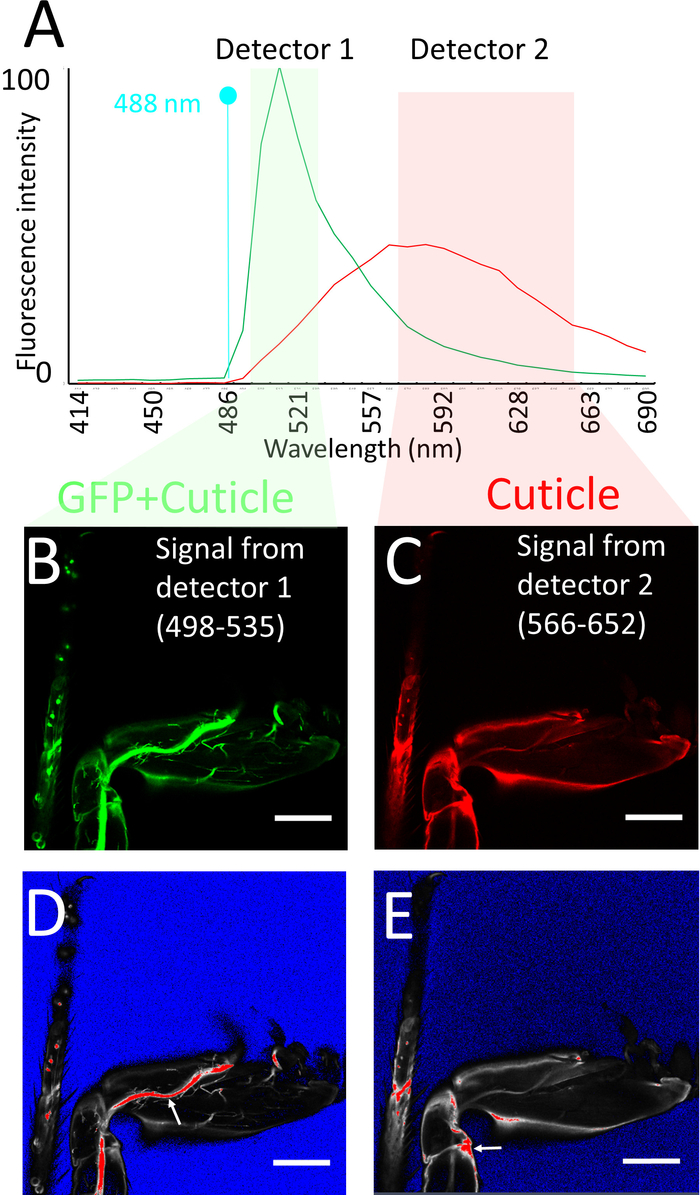
Figure 3: Imaging procedure. (A) Emission spectra of GFP and of leg cuticle using 488 nm Argon laser excitation, obtained using spectral imaging of sections of legs expressing GFP and of legs of Drosophila that do not express GFP respectively. Note that the fluorescence intensities have not been normalized, e.g., are from raw data using the same parameters (objective, mounting medium, laser power, confocal aperture, gain, offset) as for the leg imaging procedure. Also shown are the detector windows used for imaging the GFP + cuticle fluorescence (detector 1: green) and cuticle (detector 2: pink), based on the GFP vs cuticle background spectra. (B, C) Confocal section of legs labeled with mCD8::GFP under the control of DVGlut-Gal4 obtained from detector 1 (B) and detector 2 (C). (D, E) Saturation marker settings used to image (B, C) respectively (see text for explanation): blue no signal, red saturation. Note that on detector 1 the main nerve tracks are saturated, while on detector 2 some regions of the cuticle are saturated (see arrows). Scale bar = 100 µm. Please click here to view a larger version of this figure.
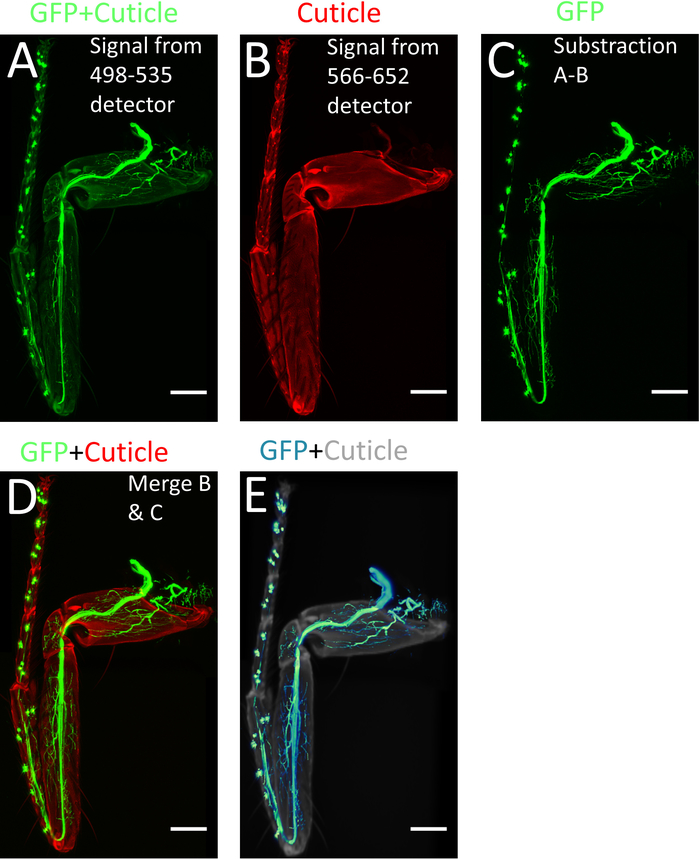
Figure 4: Processing of images using ImageJ/FIJI. (A) Max projection of the confocal stacks obtained from 498-535 nm detector. (B) Max projection of the confocal stack obtained from 566-652 nm detector. (C) Image with only GFP signal obtained by subtracting (A) from (B). (D) Merged images of (B) and (C). (E) 3-D reconstruction of (C). Scale bar = 100 µm. Please click here to view a larger version of this figure.
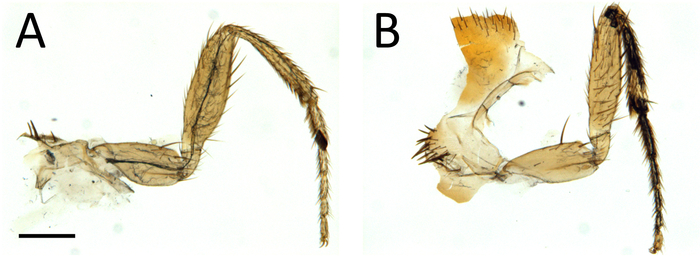
Figure 5: Low-power view of dissected legs showing examples of good (A) and bad (B) fixation. Scale bar = 200 µm. Please click here to view a larger version of this figure.
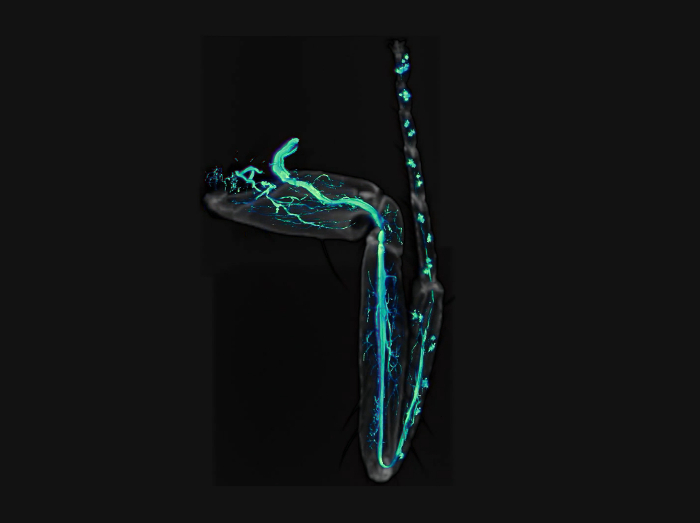
Video 1: Movie of GFP-labeled axons (green) together with cuticle (gray) of a leg. Please click here to view this video. (Right-click to download.)
Discussion
The cuticle of adult Drosophila and of other arthropods, which contains many dark pigments, is a major obstacle for viewing structures inside their body. In addition, it is strongly auto fluorescent which is made worse by fixation. These two features are very problematic for observations of fluorescent dyes or molecules inside the body of animals with an exoskeleton.
The procedure that we have described and that we routinely use in the lab yields clean and detailed images of axon trajectories and of their terminal endings in adult Drosophila legs. Importantly a clean GFP signal is obtained without any contamination from the fluorescence emitted by the leg cuticle. This feature is mandatory in order to be able to visualize and quantitate three-dimensional features of axon arbors using 3D-imaging programs. In this way data obtained from several legs can be compared. The procedure is easily adapted for observing signals from other fluorescent proteins and could be easily used to image axons in other adult arthropods.
The two critical aspects of the procedure are i) to obtain a strong GFP signal, and ii) proper fixation of the legs. For the latter we routinely obtain good fixation, nevertheless some legs are occasionally not fixed properly. Therefore, the procedure needs to be improved, perhaps by adding agents that promote penetration of reagents (such as dimethylsulfoxide), or other means of fixation (microwave fixation, if it preserves GFP fluorescence), but we have not explored this possibility apart from using a preincubation step in PBS containing Triton (which significantly improved fixation). In order to get a good GFP signal we use a strong DVglut-Gal4 driver (also called OK371-Gal4). It is also necessary to use a good reporter – we use mCD8-GFP and have also obtained good signals with cytoplasmic GFP or mCherry. Regardless, we use reporters that contain several copies of the primary reporter (hexameric) and several copies of LexO or UAS sites.
A limitation of this procedure is that it applies only to fixed tissue. We are currently developing procedures for in vivo observations and are testing various alternatives (mounting and microscopes). One limitation using confocal microscopy is that it is difficult to view through the entire leg: this is because for signals from deep-lying areas the signal from GFP is scattered through the overlying tissue. Alternately a biphoton microscope allows imaging through the thickness of the entire leg.
Finally, other methods use different types of mounting and fixation4,12. The significance and strength of our procedure is that a subtraction step separating true GFP signal from other (mainly cuticular) signals allows excellent 3-dimensional reconstruction and visualization of axons and their terminal arbors.
Declarações
The authors have nothing to disclose.
Acknowledgements
We thank Robert Renard for preparing fly food medium. This work was supported by an NIH grant NS070644 to R.S.M. and funding from the ALS Association (#256), FRM (#AJE20170537445) and ATIP-Avenir Program to J.E.
Materials
| Ethanol absolute | Fisher | E/6550DF/17 | Absolute analytical reagent grade |
| nonionic surfactant detergent | Sigma-Aldrich | T8787 | Triton X-100, for molecular biology |
| Fine forceps | Sigma-Aldrich | F6521 | Jewelers forceps, Dumont No. 5 |
| Glass multi-well plate | Electron Microscopy Sciences | 71563-01 | 9 cavity Pyrex, 100×85 mm |
| PFA | Thermofisher | 28908 | Pierc 16% Formaldehyde (w/v), Methanol-free |
| Glycerol | Fisher BioReagents | BP 229-1 | Glycerol (Molecular Biology) |
| Spacers | Sun Jin Lab Co | IS006 | iSpacer, four wells, around 12 μL working volume per well, 7 mm diameter, 0.18 mm deep |
| Square 22×22 mm coverslips | Fisher Scientific | FIS#12-541-B | No.1.5 -0.16 to 0.19mm thick |
| Mounting Medium | Vector Laboratories | H-1000 | Vectashield Antifade Mounting Medium |
| Confocal microscope | Carl Zeiss | LSM780; objective used LD LCI Plan-Apochromat 25x/0,8 Imm Korr DIC M27 (oil/ silicon/glycerol/water immersion) (420852-9871-000) |
|
| imaging software | Carl Zeiss | ZEN 2011 | |
| 3D-Image software | ThermoFisher Scientific | Amira 6.4 | |
| ImageJ | National Institutes of Health | https://imagej.nih.gov/ij/ | ImageJ/FIJI |
Referências
- Miller, A., Demerec, M. The internal anatomy and histology of the imago of Drosophila melanogaster. Biology of Drosophila. , 420-531 (1950).
- Soler, C., Ladddada, L., Jagla, K. Coordinated development of muscles and tendons of the Drosophila leg. Development. 131 (24), 6041-6051 (2004).
- Baek, M., Mann, R. S. Lineage and Birth Date Specify Motor Neuron Targeting and Dendritic Architecture in adult Drosophila. Journal of Neuroscience. 29 (21), 6904-6916 (2009).
- Brierley, D. J., Rathore, K., VijayRaghavan, K., Williams, D. W. Developmental origins and architecture of Drosophila leg motoneurons. Journal of Comparative Neurology. 520 (8), 1629-1649 (2012).
- Enriquez, J., Mann, R. S. Specification of Individual Adult Motor Neuron Morphologies by Combinatorial Transcription Factor Codes. Neuron. 86 (4), 955-970 (2015).
- Mahr, A., Aberle, H. The expression pattern of the Drosophila vesicular glutamate transporter: a marker protein for motoneurons and glutamatergic centers in the brain. Gene Expression Patterns. 6 (3), 299-309 (2006).
- Lee, T., Luo, L. Mosaic analysis with a repressible cell marker (MARCM) for Drosophila neural development. Trends in Neuroscience. 24 (5), 251-254 (2001).
- Enriquez, J., Rio, L. Q., Blazeski, R., Bellemin, S., Godement, P., Mason, C. A., Mann, R. S. Differing Strategies Despite Shared Lineages of Motor Neurons and Glia to Achieve Robust Development of an Adult Neuropil in Drosophila. Neuron. 97 (3), 538-554 (2018).
- Preibisch, S., Saalfeld, S., Tomancak, P. Globally optimal stitching of tiled 3D microscopic image acquisitions. Bioinformatics. 25 (11), 1463-1465 (2009).
- Brierley, D. J., Blanc, E., Reddy, O. V., Vijayraghavan, K., Williams, D. W. Dendritic targeting in the leg neuropil of Drosophila: the role of midline signalling molecules in generating a myotopic map. PLoS Biology. 7 (9), e1000199 (2009).

