Measuring Neuromuscular Junction Functionality
Summary
A functional assessment of the neuromuscular junction (NMJ) can provide essential information on the communication between muscle and nerve. Here we describe a protocol to comprehensively evaluate both the NMJ and muscle functionality using two different muscle-nerve preparations, i.e. soleus-sciatic and diaphragm-phrenic.
Abstract
Neuromuscular junction (NMJ) functionality plays a pivotal role when studying diseases in which the communication between motor neuron and muscle is impaired, such as aging and amyotrophic lateral sclerosis (ALS). Here we describe an experimental protocol that can be used to measure NMJ functionality by combining two types of electrical stimulation: direct muscle membrane stimulation and the stimulation through the nerve. The comparison of the muscle response to these two different stimulations can help to define, at the functional level, potential alterations in the NMJ that lead to functional decline in muscle.
Ex vivo preparations are suited to well-controlled studies. Here we describe an intensive protocol to measure several parameters of muscle and NMJ functionality for the soleus-sciatic nerve preparation and for the diaphragm-phrenic nerve preparation. The protocol lasts approximately 60 min and is conducted uninterruptedly by means of a custom-made software that measures the twitch kinetics properties, the force-frequency relationship for both muscle and nerve stimulations, and two parameters specific to NMJ functionality, i.e. neurotransmission failure and intratetanic fatigue. This methodology was used to detect damages in soleus and diaphragm muscle-nerve preparations by using SOD1G93A transgenic mouse, an experimental model of ALS that ubiquitously overexpresses the mutant antioxidant enzyme superoxide dismutase 1 (SOD1).
Introduction
The neuromuscular junction (NMJ) is a chemical synapse formed by the connection between the motor endplate of the muscle fiber and the motor neuron axon terminal. The NMJ has been shown to play a crucial role when communication between muscle and nerve is impaired, as occurs in aging or amyotrophic lateral sclerosis (ALS). As muscle and nerve communicate in a bidirectional way1,2, being able to measure NMJ defects separately from muscle defects may provide new insights into their physiopathological interplay. Indeed, this functional evaluation may help to assess whether morphological or biochemical alterations reduce neurotransmission signaling functionality.
The comparison of muscle contractile response elicited by nerve stimulation and the response of the same muscle evoked by direct stimulation of its membrane has been proposed as an indirect measurement of NMJ functionality. Indeed, since membrane stimulation by-passes neurotransmission signaling, any differences in the two contractile responses may be ascribed to changes in the NMJ. This approach has been extensively proposed for rats3,4,5,6,7, and also used to gather information on mouse models8,9,10,11,12.
Here, we describe in detail a procedure to excise and test two muscle-nerve preparations, i. e. the soleus-sciatic and diaphragm-phrenic preparations. Using a custom-made software, we designed a continuous testing protocol that combines the measurement of several parameters that characterize both NMJ and muscle functionality, thereby yielding a comprehensive evaluation of NMJ damage separately from that of muscle. In particular, the protocol measures the twitch force, the muscle kinetics, the force-frequency curve for direct and nerve stimulations, the neurotransmission failure13 for both a firing and the tetanic frequencies, and the intratetanic fatigue7.
Protocol
All the animal experiments were approved by the ethics committee of Sapienza University of Rome-Unit of Histology and Medical Embryology and were performed in accordance with the current version of the Italian Law on the Protection of Animals.
1. Experimental set-up
- Set-up the experimental system composed of 1 actuator/transducer, 2 stimulators, 1 in-vitro muscle apparatus, 1 preparatory tissue bath, 1 suction electrode, 1 digital oscilloscope, 1 stereomicroscope, 1 cold light illuminator, 1 acquisition board, 1 connector block and a personal computer.
NOTE: Here the command software was programmed in LabView and was designed to guarantee high flexibility, accuracy, and repeatability of the stimulations. For each stimulation, the user can select the pulse width, frequency, duration, and decide whether it is delivered to the membrane or through the nerve. The user can also select the length of the rest period before each stimulation.
2. Evaluations of the NMJ contractile properties of soleus and diaphragm muscles
- System warm-up
- Prepare the Krebs Ringer buffer14 and place it in a bath of the mounting apparatus and the preparatory tissue bath. Place a 60 mm dish prepared with 4 ml of silicon in the preparatory tissue bath.
- Turn on the circulating water bath and set the temperature to 30 °C for the soleus muscle and to 27 °C for the diaphragm muscle.
- Allow 95% O2 – 5% CO2 mixture to flow into both the baths.
- Turn on the actuator/transducer and the two pulse stimulators and set the current values to 300 mA for membrane stimulation and to 5 mA for nerve stimulation.
NOTE: The 300 mA current value has previously been shown not to induce any significant contraction on the nerve branches when D-tubocurarine is added to the solution15. The 5 mA current value corresponds to the amount of current required to stimulate the muscle through the nerve without creating an overlap with the membrane stimulation induced by means of the solution. Since the distance between the suction electrode and the muscle is dependent on the nerve length, this current value must be carefully adjusted before each experiment, as described below.
- Soleus and diaphragm dissection
- Sacrifice the mouse by cervical dislocation to minimize suffering, and immediately excise the muscles for testing as follows.
- Soleus-sciatic preparation, dissection, and set-up
- Spray 70% ethanol on the mouse leg and remove the skin covering the leg. Make an incision in the upper part of the leg with a pair of scissors and then pull the skin firmly. Isolate the Achilles' tendon from the tibia and then cut the Achilles' tendon with a pair of scissors.
- Tightly clamp the tendon with a pair of forceps and gently pull the gastrocnemius muscle together with the soleus. Once the proximal tendon of the soleus is exposed, cut the entire calf with a pair of scissors while still holding the Achilles' tendon. Immediately place the tissue sample in the preparatory tissue bath.
- Place the preparatory bath under the stereomicroscope and fix the calf to the silicon dish using 0.20 mm diameter stainless steel pins. Using a pair of forceps clamp the proximal tendon of the soleus and gently pull it to expose the sciatic innervation.
- Once the innervation is exposed (Figure 1), carefully remove the surrounding tissue to expose about 5 mm of the nerve. Use a fine pair of scissors to cut the nerve. While tightly clamping the soleus on the proximal tendon with a pair of forceps, pull it again and excise it by cutting the Achilles' tendon with a pair of scissors.
- Pass a nylon wire through the hole of the lever arm of the actuator/transducer. Create a noose at the end of the wire and grasp the Achilles' tendon before pulling the wire back until the muscle reaches the bath of the mounting apparatus. Clamp the proximal tendon within the fixed clamp and tie the nylon wire around the lever arm. Allow the muscle to equilibrate in the solution.
- Determine the initial optimal length (L0).
- First, stretch the muscle to preload it at 10 mN (this value guarantees the maximum twitch force (based on experience)). Then, gently stretch the muscle to change the preload and stimulate it with a series of single pulses. The optimal length is achieved when the maximum twitch force is measured.
- Diaphragm-phrenic preparation, dissection, and set-up
- Spray 70% ethanol on the mouse skin. Remove the skin covering the diaphragm muscle by making an incision over the sternum with a pair of scissors and by pulling the skin firmly.
- With a pair of scissors, cut the abdomen horizontally below the sternum and gently remove the intestine and the organs with a pair of forceps. Use a pair of thick scissors to cut the spine.
- Cut the ribs about 1 cm over the sternum and proceed horizontally. Gently remove the outer organs with a pair of forceps and cut the spine to obtain a circular ring of ribs containing the diaphragm.
- Wash the preparation in a dish containing the Krebs Ringer buffer and then place it in the silicon dish inside the preparatory tissue bath, with the upper side facing up and the sternum facing forward.
- Using the stereomicroscope, carefully remove the lungs and the remaining organs; the phrenic nerve will be visible on the right side (Figure 2A).
- Trim the ribs to leave a ring of about 2 mm all along the diaphragm.
- Using forceps, fix one 0.20 mm diameter stainless steel pin on the diaphragm central tendon at the point corresponding to the phrenic nerve innervation, and another pin on the ribs on the same axis to identify the diaphragm strip of interest.
- Fix two additional pins on the central tendon and another two pins on the ribs on either side of the selected strip to lay out the diaphragm. If necessary, clean the phrenic nerve from the surrounding connective tissue using forceps.
- Using a curved blade, cut the diaphragm on either sides of the innervation to identify a tendon-muscle-rib strip as shown in Figure 2B.
- Pass a nylon wire through the hole of the lever arm of the actuator/transducer. Create a noose at the end of the wire and grasp the tendon before pulling the wire back until the muscle reaches the bath of the mounting apparatus.
- Clamp the ribs within the fixed clamp and tie the nylon wire around the lever arm.
- Allow the muscle to equilibrate in the solution and determine the initial optimal length (L0).
- Stretch the muscle to preload it at 5 mN. Gently stretch the muscle to change the preload and stimulate it with a series of single pulses. The optimal length is achieved when the maximum twitch force is measured.
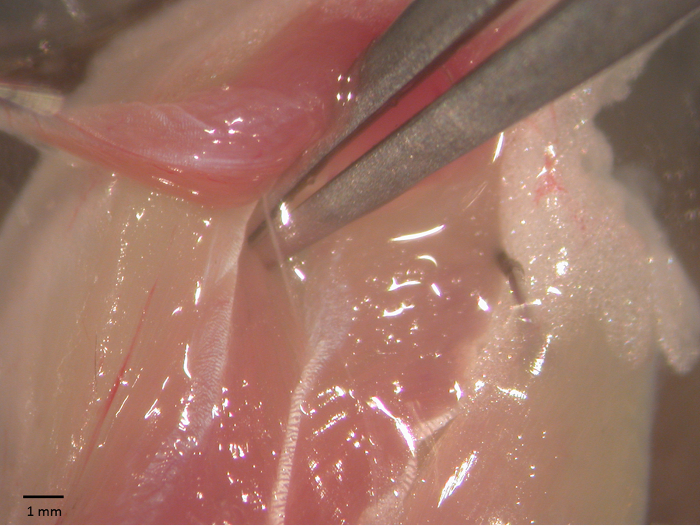
Figure 1 – Soleus-sciatic nerve preparation. Soleus-sciatic nerve during surgical operation for the functional tests. The sciatic is exposed using a pair of forceps. Please click here to view a larger version of this figure.
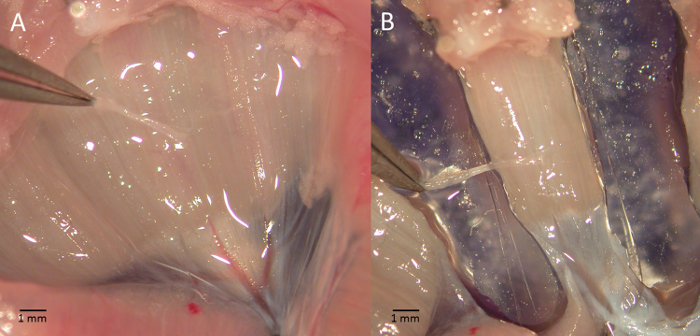
Figure 2 – Diaphragm-phrenic nerve preparation. Picture shows a phase of the diaphram-phrenic nerve preparation excision (A) and the strip to be mounted for functional tests (B). Please click here to view a larger version of this figure.
- Measuring NMJ properties separately from muscle contractility
- Set the best current intensity for the stimulation trough the nerve and verify that the current pulses delivered through the suction electrode do not elicit muscle contraction by the spread of current in the bath.
- Place the suction electrode near the muscle and pull the nerve in. While gently increasing the current intensity (starting from 5 mA), stimulate the muscle with a series of single pulses. The optimal current value is determined when the twitch force is maximum.
- Push the nerve out of the electrode and deliver a few single pulses. Ensure that the muscle does not contract due to overlap with the membrane stimulation by means of the solution. Pull the nerve in again.
- Launch the program and select the input file to run the desired testing protocol.
NOTE: The input file includes all the stimulation parameters needed to run the entire protocol. Although the same protocol structure is used for the two muscles the stimulation parameters differ depending on the protocol refers to the soleus or diaphragm muscles.- Soleus-sciatic nerve stimulation (see Table 1)
- Use the following pulse widths for all the electrical stimulations: 1.4 ms for sciatic nerve stimulation and 0.1 ms for direct soleus stimulation. The full protocol lasts approximately 65 min.
- Diaphragm-phrenic nerve stimulation (see Table 2)
- Use the following pulse widths for all the electrical stimulations: 1.8 ms for phrenic nerve stimulation and 0.2 ms for direct diaphragm stimulation. The full protocol lasts approximately 55 min.
- At the end of the experimental protocol, measure the length and the wet weight of the muscle using an analog caliper with an 0.05 mm accuracy and a precision scale with an 0.1 mg accuracy, respectively.
- Compute the cross sectional area (CSA) by dividing the muscle mass by the product of optimal fiber length (Lf) and the density of mammalian skeletal muscle (1.06 mg/mm3)16.
NOTE: Lf is obtained by multiplying L0 by the fiber length/muscle length ratio (0.71 for soleus muscle16 and 1 for the diaphragm muscle17).
- Compute the cross sectional area (CSA) by dividing the muscle mass by the product of optimal fiber length (Lf) and the density of mammalian skeletal muscle (1.06 mg/mm3)16.
- Soleus-sciatic nerve stimulation (see Table 1)
- Set the best current intensity for the stimulation trough the nerve and verify that the current pulses delivered through the suction electrode do not elicit muscle contraction by the spread of current in the bath.
| Type of experiment | Frequency | Duration | Repetitions | Muscle or Nerve stimulation | Purpose |
| (Hz) | (s) | ||||
| Twitch | Single pulse | 1 | Muscle | Twitch force and kinetics | |
| Rest | 30 | ||||
| Twitch | Single pulse | 1 | Nerve | ||
| Rest | 30 | ||||
| Twitch | Single pulse | 1 | Muscle | ||
| Rest | 30 | ||||
| Twitch | Single pulse | 1 | Nerve | ||
| Rest | 120 | ||||
| Unfused tetanus | 40 | 0.8 | 1 | Nerve | Force/frequency curves for nerve and muscle stimulations |
| Rest | 180 | ||||
| Unfused tetanus | 60 | 0.8 | 1 | Muscle | |
| Rest | 180 | ||||
| Fused tetanus | 80 | 0.8 | 1 | Nerve | |
| Rest | 180 | ||||
| Unfused tetanus | 20 | 0.8 | 1 | Muscle | |
| Rest | 180 | ||||
| Unfused tetanus | 60 | 0.8 | 1 | Nerve | |
| Rest | 180 | ||||
| Fused tetanus | 80 | 0.8 | 1 | Muscle | |
| Rest | 180 | ||||
| Unfused tetanus | 20 | 0.8 | 1 | Nerve | |
| Rest | 180 | ||||
| Unfused tetanus | 40 | 0.8 | 1 | Muscle | |
| Rest | 300 | ||||
| Fatigue paradigm | 35 | 0.8 | 1 muscle stimulation followed by 14 nerve stimulations with a rest time of 1.2 s each, repeated 20 times | Neurotransmission failure (NF) | |
| Rest | 900 | ||||
| Fatigue paradigm | 80 | 0.8 | 1 muscle stimulation followed by 14 nerve stimulations with a rest time of 1.2 s each, repeated 20 times | Neurotransmission failure (NF) and Intratetanic fatigue (IF) | |
Table 1 – Soleus-sciatic nerve stimulation protocol. The table lists the sequence of tests that form the complete protocol for testing soleus-sciatic nerve preparations.
| Type of experiment | Frequency | Duration | Repetitions | Muscle or Nerve stimulation | Purpose |
| (Hz) | (s) | ||||
| Twitch | Single pulse | 1 | Muscle | Twitch force and kinetics | |
| Rest | 30 | ||||
| Twitch | Single pulse | 1 | Nerve | ||
| Rest | 30 | ||||
| Twitch | Single pulse | 1 | Muscle | ||
| Rest | 30 | ||||
| Twitch | Single pulse | 1 | Nerve | ||
| Rest | 120 | ||||
| Unfused tetanus | 60 | 0.5 | 1 | Nerve | Force/frequency curves for nerve and muscle stimulations |
| Rest | 120 | ||||
| Fused tetanus | 100 | 0.5 | 1 | Muscle | |
| Rest | 180 | ||||
| Unfused tetanus | 40 | 0.5 | 1 | Nerve | |
| Rest | 120 | ||||
| Unfused tetanus | 20 | 0.5 | 1 | Muscle | |
| Rest | 120 | ||||
| Unfused tetanus | 80 | 0.5 | 1 | Nerve | |
| Rest | 150 | ||||
| Unfused tetanus | 80 | 0.5 | 1 | Muscle | |
| Rest | 150 | ||||
| Unfused tetanus | 20 | 0.5 | 1 | Nerve | |
| Rest | 120 | ||||
| Fused tetanus | 100 | 0.5 | 1 | Muscle | |
| Rest | 150 | ||||
| Fused tetanus | 100 | 0.5 | 1 | Nerve | |
| Rest | 180 | ||||
| Unfused tetanus | 60 | 0.5 | 1 | Muscle | |
| Rest | 300 | ||||
| Fatigue paradigm | 35 | 0.33 | 1 muscle stimulation followed by 14 nerve stimulations with a rest time of 0.67 s each, repeated 20 times | Neurotransmission failure (NF) | |
| Rest | 900 | ||||
| Fatigue paradigm | 80 | 0.33 | 1 muscle stimulation followed by 14 nerve stimulations with a rest time of 0.67 s each, repeated 20 times | Neurotransmission failure (NF) and Intratetanic fatigue (IF) | |
Table 2 – Diaphragm-phrenic nerve stimulation protocol. The table lists the sequence of tests that form the complete protocol for testing diaphragm-phrenic nerve preparations.
3. Data analysis
NOTE: At the end of the protocol compute all the desired parameters as follow.
- From single pulse stimulation
- Compute twitch force (mN; maximum active force generated during twitch) and specific twitch force (mN/mm2). Compute it by subtracting the initial preload value to the maximum force generated by the muscle. Compute the specific twitch force as twitch force divided by the muscle CSA.
- Compute time to peak tension (TTP) (ms) as the time from pulse release to twitch force.
- Compute half relaxation time (1/2RT) (ms) as the time from twitch force to 50% of twitch force.
- Compute dF/dt (mN/ms) as the maximum value of force derivative during the contractile phase.
- Compute -dF/dt (mN/ms) as the maximum value of force derivative during the relaxing phase.
- From pulse train stimulations
- Compute unfused force (mN) and specific unfused force (mN/mm2). Compute it by subtracting the initial preload value to the maximum force generated by the muscle. Compute the specific unfused force as the unfused force divided by the muscle CSA.
NOTE: The unfused force is the maximum active force generated during a pulse train with a frequency lower than the tetanic frequency. - Compute tetanic force (mN) and specific tetanic force (mN/mm2); the maximum force is the maximum active force generated during a pulse train delivered at tetanic frequency. Compute it by subtracting the initial preload value to the maximum force generated by the muscle. Compute the specific tetanic force as the tetanic force divided by the muscle CSA.
- Compute force-frequency curve. Plot the value of force (or specific force) obtained for each stimulation versus the increasing frequency of stimulation. Typically, it begins with the single pulse stimulation and ends up with the tetanic frequency.
- Compute unfused force (mN) and specific unfused force (mN/mm2). Compute it by subtracting the initial preload value to the maximum force generated by the muscle. Compute the specific unfused force as the unfused force divided by the muscle CSA.
- From fatigue paradigms
- Calculate neurotransmission failure (NF) as:

where MF is the force decrease following muscle stimulation and F is the force decrease following nerve stimulation, measured on the first pulse train after muscle stimulation. - Calculate intratetanic fatigue (IF) as:

where Flp is the force generated by the muscle at the last pulse of stimulation, and Fm is the maximum force generated by the muscle during the same pulse train. Regarding to the nerve stimulation, compute the intratetanic fatigue on the first pulse train immediately after the direct stimulation.
- Calculate neurotransmission failure (NF) as:
4. Statistical analysis
NOTE: The statistical analysis models must be chosen according to whether muscle response to both nerve and membrane stimulations is compared within the same animal model or between 2 different animal models18,19.
- Use the Student's t test for TTP, 1/2RT, dF/dt, -dF/dt if comparing only muscle responses to direct and indirect stimulations. If comparing muscle preparations obtained from 2 different mouse strains, use 2-way ANOVA with stimulation type and mouse strain as fixed factors. When the 2-way ANOVA returns a significant outcome, use multiple comparison tests to search for statistical differences.
- For force-frequency curve (if comparing only muscle responses to direct and indirect stimulations), use 2-way ANOVA with stimulation type and frequency of stimulation as fixed factors. Use multiple comparison tests if required.
- If comparing muscle preparations obtained from 2 different mouse strains, use 3-way ANOVA with stimulation type, frequency of stimulation and mouse strain as fixed factors.
- When the 3-way ANOVA yields a significant effect of the factors animal strain and stimulation type, use 2-way ANOVA to identify significant differences between 2 groups at a time. For example, differences between the muscle response of the 2 groups to membrane stimulation, or between muscle response to direct and indirect stimulations within one group can be assessed.
- If comparing muscle preparations obtained from 2 different mouse strains, use 3-way ANOVA with stimulation type, frequency of stimulation and mouse strain as fixed factors.
- Intratetanic fatigue
NOTE: Since the protocol was designed to induce fatigue in response to nerve stimulation even in control mice, this parameter can only be used to investigate differences between 2 mouse strains, and a statistical analysis within a single group would always yield significant differences.- To compare two groups, use 3-way ANOVA with stimulation type, time, and mouse strain as fixed factors. When the 3-way ANOVA yields a significant effect of the factors animal strain and stimulation type, use 2-way ANOVA to identify significant differences between 2 groups at a time, as for the force-frequency curve.
- For neurotransmission failure, use 2-way ANOVA with animal strain and time as fixed factors. If it returns significant outcomes, use multiple comparison tests to search for statistical differences.
NOTE: Since this parameter only returns one value for each mouse strain, it allows different mouse models to be compared. - For muscle weight, length, and CSA, use Student's t test to investigate differences when comparing muscle-nerve preparations from different animal models.
Representative Results
The protocol we described provides information on functional denervation in several neuromuscular diseases or aging-sarcopenia. This protocol can be used to determine whether (and, if so, at which level) muscle alterations are due to selective changes that occur in the muscle itself or in neuromuscular transmission. The data shown below are the results of a previous work by our group18, conducted on the SOD1G93A transgenic mouse model of amyotrophic lateral sclerosis at the end-stage of the disease20. The SOD1G93A transgenic mouse ubiquitously overexpresses the mutant antioxidant enzyme superoxide dismutase 1 (SOD1). Figures 3 and 4 show the dF/dt and tetanic force values for the soleus-sciatic nerve (left) and for the diaphragm-phrenic nerve (right) preparations. These results demonstrate the ability of the technique proposed here to detect the functional defects in transgenic muscles that are related to NMJ as opposed to those strictly related to the muscle itself. Indeed, for both dF/dt and tetanic force, the SOD1G93A soleus muscles displayed a reduced contractile response, compared with control muscle, when directly stimulated, and displayed a further reduction when stimulated through the nerve. By contrast, mild alterations were observed in these two parameters when diaphragm muscle strips were stimulated through the membrane, whereas significant alterations were detected when the diaphragm muscle was stimulated through the nerve.
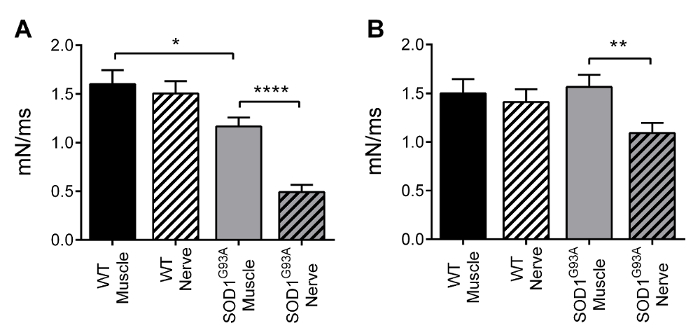
Figure 3 – Contractile kinetics. Mean ± SEM of dF/dt for the soleus (A) and diaphragm (B) preparations. Soleus specimens displayed a significant slowing down when directly stimulated (-27%), and a further decrease when stimulated through the nerve (-58%). Diaphragm specimens displayed a slowing down only when stimulated through the nerve (-30%). Adapted from Rizzuto et al. 18. Please click here to view a larger version of this figure.
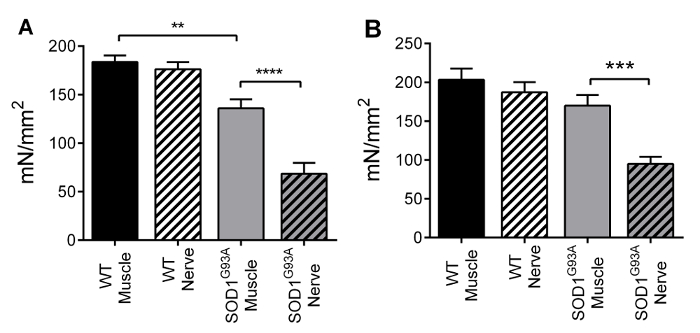
Figure 4 – Tetanic force. Mean ± SEM of tetanic specific force for the soleus (A) and diaphragm (B) preparations. Soleus specimens displayed a significant slowing down when directly stimulated (-26%), and a further decrease when stimulated through the nerve (-50%). Diaphragm specimens displayed a force decrease only when stimulated through the nerve (-44%). Adapted from Rizzuto et al. 18. Please click here to view a larger version of this figure.
The evaluation of intratetanic fatigue and of neurotransmission failure allowed NMJ specific parameters to be measured. Figure 5 shows the average values of intratetanic fatigue (IF) measured during the tetanic fatigue paradigm for soleus muscles (Figure 5A) and diaphragm strips (Figure 5B). As reported in the Protocol section, the fatigue paradigm we applied was developed in such a way to stress the NMJ though not the muscle. As a result, the IF measured for the direct muscle stimulation was never altered. Indeed, the IF computed for the nerve stimulation is the parameter that must be considered for comparisons between different mouse strains. Our results show the IF was significantly lower in both transgenic soleus and diaphragm muscles than in the control counterparts. This difference was greater in the diaphragm, in which a small muscle defect was detected, and smaller in the soleus, in which significant muscle damage had already measured. It should be borne in mind that since the transgenic soleus muscle was significantly damaged, the NMJ evaluation was only correct for up to 8 min of stimulation, which is the time it takes for transgenic muscle to return the null value of force when stimulated. Transgenic soleus IF values after 8 min of stimulation basically express noise.
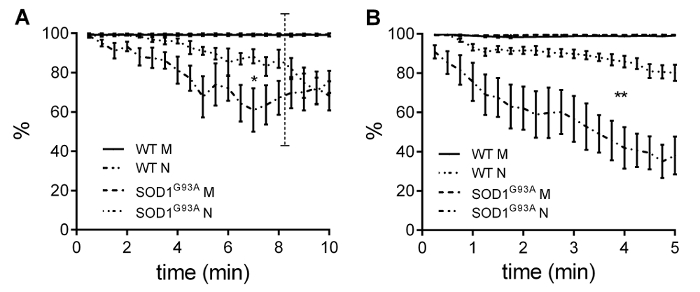
Figure 5 – Intratetanic fatigue. Intratetanic fatigue for the soleus (A) and diaphragm (B) muscles displayed a significant decrease in transgenic NMJ functionality. Values are Mean ± SEM. Adapted from Rizzuto et al. 18. Please click here to view a larger version of this figure.
Figure 6 shows the neurotransmission failure at the tetanic frequency measured in the soleus (Figure 6A) and diaphragm (Figure 6B) specimens. In keeping with the IF results, no defect in neurotransmission was detected in the soleus muscle, whereas the diaphragm muscle specimens displayed a significant increase in neuromuscular junction fatigability.
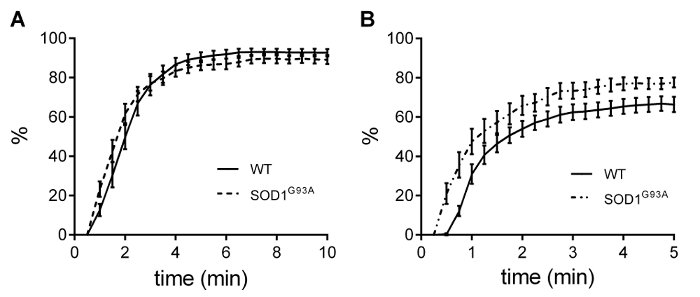
Figure 6 – Neurotransmission failure. Neurotransmission failure did not display any alterations in the soleus muscles (A), while highlighted a significant decrease in NMJ functionality in transgenic diaphragm strips (B).Values are Mean ± SEM. Adapted from Rizzuto et al. 18. Please click here to view a larger version of this figure.
Discussion
The experimental protocol described above provides an ideal way of measuring and discriminating any functional alterations that have occurred directly in the muscle or indirectly at the neuromuscular junction level. Since this technique is based on an indirect measurement of NMJ functionality, it cannot be used to establish if any defect is related to morphological changes or to biochemical changes. By contrast, it does provide an effective way of determining whether any morphological or biochemical alterations have reduced neurotransmission signaling functionality. However, after force measurements are completed, the muscle can be removed from the bath, blotted, pinned at optimum length, surrounded by embedding compound, and rapidly frozen in melting isopentane. Muscles can be stored at -80 °C for subsequent evaluation, such as for immunohistochemical and morphological analysis.
The technique we propose here is based on an experimental testing protocol that combines, for the first time, the measurement of several parameters characterizing NMJ and muscle functionality. Three crucial points ensure that this technique yields reliable results.
First, although skeletal muscle excision is now a relatively common technique, extra care must be taken when performing the surgical procedure in order to keep the nerve intact with the muscle. The operator’s ability must thus be tested on control mice before any other experimental model is attempted. In control mice, the muscle contractile responses to direct and indirect stimulations are expected to be the same, thus providing a control to operator’s surgical ability.
Another crucial point is the need to ensure that direct pulses do not activate the muscle by stimulating intra-muscular branches of the nerve and that the pulses applied to the nerve do not activate the muscle in an artefactual way by spreading current in the bath. The first point can be tested by performing a separate set of experiments in which the muscle is stimulated directly on the membrane both before and after D-tubocurarine (25 µM) has been added to the physiological bath. Once the supramaximal current value has been fixed, the muscle response should not be altered by the addition of D-tubocurarine. The second point is related to the length of the excised nerve, and is thus more susceptible to variation. The current at the suction electrode must be evaluated before the beginning of each test, as described in the protocol section.
Lastly, since NMJ functionality is assessed by comparing the muscle response to direct and indirect stimulation, the electrical pulses must be synchronized very precisely. This point is particularly important for the two fatigue paradigms at the end of the protocol during which the muscle is stimulated once on the membrane and 14 times through the nerve. Since both the stimulation phases and the rest times are very low (0.33 s and 0.67 s for the diaphragm), even a very low lag would lead to an unbalanced stimulation of one of the two compartments.
Declarações
The authors have nothing to disclose.
Acknowledgements
Work in the authors’ laboratory was supported by Fondazione Roma and Telethon (grant no. GGP14066).
Materials
| Dual-Mode Lever System | Aurora Scientific Inc. | 300B | actuator/transducer |
| High-Power Bi-Phase Stimulator | Aurora Scientific Inc. | 701B | pulse stimulator (nerve) |
| High-Power Bi-Phase Stimulator | Aurora Scientific Inc. | 701C | pulse stimulator (muscle) |
| In vitro Muscle Apparatus | Aurora Scientific Inc. | 800A | |
| Preparatory tissue bath | Radnoti | 158400 | |
| Monopolar Suction Electrode | A-M Systems | 573000 | with a home-made reference |
| Oscilloscope | Tektronix | TDS2014 | |
| Stereomicroscope | Nikon | SMZ 800 | |
| Cold light illuminator | Photonic Optics | PL 3000 | |
| Acquisition board | National Instruments | NI PCIe-6353 | |
| Connector block | National Instruments | NI 2110 | |
| Personal computer | AMD Phenom II x4 970 | Processor 3.50 Ghz with Windows 7 | |
| LabView 2012 software | National Instruments | ||
| Krebs-Ringer Bicarbonate Buffer | Sigma-Aldrich | K4002 | physiological buffer |
| Sodium bicarbonate | Sigma-Aldrich | S5761 | |
| Calcium chloride CaCl2 | Sigma-Aldrich | C4901 | anhydrous, powder, ≥97% |
| Potassium dihydrogen phosphate KH₂PO₄ | AnalaR | 7778-77-0 | |
| Magnesium sulphate MgSO₄ | AnalaR | 7487-88-9 | |
| Buffer HEPES | Sigma-Aldrich | H3375 | ≥99.5% (titration) |
| Dishes 60mm x 15mm | Falcon | 353004 | Polystyrene |
| Silicone | Sylgard | 184 Silicone | Elastomer Kit 0.5Kg. |
| Thermostat | Dennerle | DigitalDuomat 1200 | |
| Pump | Newa Mini | MN 606 | for aquarium |
| Heat resistance Thermocable | Lucky Reptile | 61403-1 | 50/60Hz 50W |
| Bucket | any 10 liters | Polypropylene | |
| O2 + 5%CO2 | siad | Mix gas | |
| #5 Forceps | Fine Science Tools | 11252-20 | 2 items |
| Spring Scissors – 8 mm Blades | Fine Science Tools | 15024-10 | nerve excision |
| Sharp Scissors | Fine Science Tools | 14059-11 | muscle removal |
| Delicate Scissors | Wagner | 02.06.32 | external of the animal |
| Student Scalpel Handle #3 | Fine Science Tools | 91003-12 | |
| Scalpel Blades #10 | Fine Science Tools | 10010-00 | |
| Scalpel Blades #11 | Fine Science Tools | 10011-00 | |
| nylon wire Ø0.16 mm | any |
Referências
- Dadon-Nachum, M., Melamed, E., Offen, D. The "dying-back" phenomenon of motor neurons in ALS. J Mol Neurosci. 43 (3), 470-477 (2011).
- Dobrowolny, G., et al. Skeletal Muscle Is a Primary Target of SOD1G93A-Mediated Toxicity. Cell Metab. 8 (5), 425-436 (2008).
- Mantilla, C. B., Zhan, W. Z., Sieck, G. C. Neurotrophins improve neuromuscular transmission in the adult rat diaphragm. Muscle Nerve. 29 (3), 381-386 (2004).
- Prakash, Y. S., Miyata, H., Zhan, W. Z., Sieck, G. C. Inactivity-induced remodeling of neuromuscular junctions in rat diaphragmatic muscle. Muscle Nerve. 22 (3), 307-319 (1999).
- Sieck, D. C., Zhan, W. Z., Fang, Y. H., Ermilov, L. G., Sieck, G. C., Mantilla, C. B. Structure-activity relationships in rodent diaphragm muscle fibers vs. neuromuscular junctions. Respir Physiol Neurobiol. 180 (1), 88-96 (2012).
- Van Lunteren, E., Moyer, M. Effects of DAP on diaphragm force and fatigue, including fatigue due to neurotransmission failure. J Appl Physiol. 81 (5), 2214-2220 (1996).
- Van Lunteren, E., Moyer, M., Kaminski, H. J. Adverse effects of myasthenia gravis on rat phrenic diaphragm contractile performance. J Appl Physiol. 97 (3), 895-901 (2004).
- Lee, Y., Mikesh, M., Smith, I., Rimer, M., Thompson, W. Muscles in a mouse model of spinal muscular atrophy show profound defects in neuromuscular development even in the absence of failure in neuromuscular transmission or loss of motor neurons. Dev Biol. 356 (2), 432-444 (2011).
- Personius, K. E., Sawyer, R. P. Variability and failure of neurotransmission in the diaphragm of mdx mice. Neuromuscular Disord. 16 (3), 168-177 (2006).
- Röder, I. V., Petersen, Y., Choi, K. R., Witzemann, V., Hammer, J. A., Rudolf, R. Role of myosin Va in the plasticity of the vertebrate neuromuscular junction in vivo. PLoS ONE. 3 (12), e3871 (2008).
- Chevessier, F., et al. A mouse model for congenital myasthenic syndrome due to MuSK mutations reveals defects in structure and function of neuromuscular junctions. Hum Mol Genet. 17 (22), 3577-3595 (2008).
- Farchi, N., Soreq, H., Hochner, B. Chronic acetylcholinesterase overexpression induces multilevelled aberrations in mouse neuromuscular physiology. J Physiol. 546 (1), 165-173 (2002).
- Kuei, J. H., Shadmehr, R., Sieck, G. C. Relative contribution of neurotransmission failure to diaphragm fatigue. J Appl Physiol (Bethesda, Md: 1985). 68 (1), 174-180 (1990).
- Del Prete, Z., Musarò, A., Rizzuto, E. Measuring mechanical properties, including isotonic fatigue, of fast and slow MLC/mIgf-1 transgenic skeletal muscle. Ann Biomed Eng. 36 (7), 1281-1290 (2008).
- Lynch, G. S., Hinkle, R. T., Chamberlain, J. S., Brooks, S. V., Faulkner, J. A. Force and power output of fast and slow skeletal muscles from mdx mice 6-28 months old. J Physiol. 535 (2), 591-600 (2001).
- Brooks, S. V., Faulkner, J. A. Contractile properties of skeletal muscles from young, adult and aged mice. J Physiol. 404, 71-82 (1988).
- Lynch, G. S., Hinkle, R. T., Faulkner, J. A. Force and power output of diaphragm muscle strips from mdx and control mice after clenbuterol treatment. Neuromuscul Disord. 11 (2), 192-196 (2001).
- Rizzuto, E., Pisu, S., Musar, A., Del Prete, Z. Measuring Neuromuscular Junction Functionality in the SOD1 G93A Animal Model of Amyotrophic Lateral Sclerosis. Ann Biomed Eng . 43, (2015).
- Soliani, L. . Manuale di statistica per la ricerca e la professione statistica univariata e bivariata parametrica e non-parametrica per le discipline ambientali e biologiche. , (2004).
- Gurney, M. E., Pu, H., et al. Motor neuron degeneration in mice that express a human Cu,Zn superoxide dismutase mutation. Science (New York, N.Y). 264 (5166), 1772-1775 (1994).

