Synthesis and Operation of Fluorescent-core Microcavities for Refractometric Sensing
概要
Fluorescent-core microcavity sensors employ a high-index quantum-dot coating in the channel of silica microcapillaries. Changes in the refractive index of fluids pumped into the capillary channel cause shifts in the microcavity fluorescence spectrum that can be used to analyze the channel medium.
Abstract
This paper discusses fluorescent core microcavity-based sensors that can operate in a microfluidic analysis setup. These structures are based on the formation of a fluorescent quantum-dot (QD) coating on the channel surface of a conventional microcapillary. Silicon QDs are especially attractive for this application, owing in part to their negligible toxicity compared to the II-VI and II-VI compound QDs, which are legislatively controlled substances in many countries. While the ensemble emission spectrum is broad and featureless, an Si-QD film on the channel wall of a capillary features a set of sharp, narrow peaks in the fluorescence spectrum, corresponding to the electromagnetic resonances for light trapped within the film. The peak wavelength of these resonances is sensitive to the external medium, thus permitting the device to function as a refractometric sensor in which the QDs never come into physical contact with the analyte. The experimental methods associated with the fabrication of the fluorescent-core microcapillaries are discussed in detail, as well as the analysis methods. Finally, a comparison is made between these structures and the more widely investigated liquid-core optical ring resonators, in terms of microfluidic sensing capabilities.
Introduction
Chemical sensing systems that require only small sample volumes and that can be incorporated into hand-held or field-operable devices could lead to the development of a wide range of new technologies. Such technologies could include field diagnostics for diseases and pathogens,1 environmental contaminants,2 and food safety.3 Several technologies are being actively explored for microfluidic chemical sensors, with devices based on the physics of surface plasmon resonances (SPR) among the most advanced.4 These sensors are now capable of detecting many specific biomolecules and have achieved commercial success, although mainly as larger-scale lab equipment.5
In recent years, optical microcavities have risen to compete with SPR-based systems. Microcavities can be amazingly sensitive, with demonstrated ability to detect single viruses6 and perhaps even single biomolecules7 (the latter remains the subject of some debate,8 however there is no doubt that the mass detection limits are small9 ). In microcavities, the detection mechanism relies upon changes in the optical resonances caused by the presence of an analyte within the electric field profile of the resonance. Typically, a given analyte will cause the resonance to change in in central frequency, visibility, or linewidth. As with SPR systems, microcavities can act as non-specific refractometric sensors, or as biosensors functionalized for a specific analysis.
Dielectric microstructures with a circular cross section (e.g. microspheres, disks, or cylinders) are characterized by electromagnetic resonances known as the whispering gallery modes, or WGMs, a term dating back to Lord Rayleigh’s investigations of analogous acoustic effects.10 Essentially, an optical WGM occurs when a wave circumnavigates the circular cross section by total internal reflection, and returns to its starting point in phase. An example of an electromagnetic resonance for a silica microsphere is illustrated in Figure 1a. This resonance is characterized by one maximum in the radial direction (n = 1), while a total of 53 wavelengths fit around the equator (l = 53), only some of which are shown. The evanescent part of the field intensity extends into the medium outside the sphere boundary; thus the microsphere WGM can sense the external medium.
Capillaries are an especially interesting example of a WGM-based sensor. In a capillary, cylindrical WGMs can form around the circular cross section, similar to the case for a sphere. If the capillary wall is very thin, part of the electromagnetic field extends into the capillary channel (Figure 1b). Thus, a capillary can be a microfluidic sensor for analytes injected into the channel. This is the basis of operation of the liquid core optical ring resonator (LCORR).11 LCORRs rely on the evanescent coupling of light from a precision tuneable laser source to probe the WGMs. An important aspect of the LCORR is that the capillary walls must be thin (~1 μm) to ensure that the mode samples the channel medium. This places some difficulties on their fabrication and causes them to be mechanically fragile.
In our work, we have developed an alternative structure we call a fluorescent core microcavity (FCM).12,13 To form an FCM, we coat the channel walls of a capillary with a high-refractive-index fluorophore (specifically, a layer of oxide-embedded silicon quantum dots). The high index of the film is required to confine the emitted radiation, thereby building up the WGMs (Figure 1c). In contrast to the LCORR, in an FCM the modes appear as sharp maxima in an emitted fluorescence spectrum. The thickness of the film is critically important; if it is too thick the WGM does not sample the medium in the capillary channel, and if it is too thin the optical confinement is lost and the WGMs become weak. Thus, the fabrication of an FCM is a difficult process, requiring careful preparation. This is the main topic of the current paper.
Protocol
1. Preparation of Materials
- Microcapillaries Obtain silica capillaries from a commercial supplier. We purchase our capillaries from Polymicro Technologies . Choose a small inner diameter (~25 – 30 μm) for more widely separated spectral resonances (i.e. a larger free spectral range) or a larger inner diameter (~100 μm) for more closely spaced resonances with higher quality factors. A large outer diameter ensures the FCMs are durable and easily manipulated.
- The capillaries come with a colored polyimide jacket, which must first be removed. Cut approximately 10-cm pieces of capillary from the roll, using diamond fiber cleaver. Each piece constitutes a single sample. Heat these in a tube furnace at 650 °C for one hour in oxygen to burn off the coating. This process removes the jacket material, exposing the silica capillary inside. After cooling to room temperature, remove the capillaries from the heating boat.
- Hydrogen silsesquioxane solutions Hydrogen silsesquioxane (HSQ) is reported to consist of H12Si8O12 molecules with a cage-like structure.14 This material is commercially available from Dow Corning. Purchase the HSQ in one of its FOx-series (flowable oxide) solutions, such as FOx-15. These solutions are expensive and have a limited shelf life, so careful planning is needed. Evaporation of the MIBK solvent provides an HSQ concentration of approximately 18% by weight. If the HSQ concentration is too low, quantum dots may not form in the film. If it is too high, the films may be too thick and delaminate from the capillary channel surface. In our experience, for a capillary with a 25-30 μm inner diameter, a FOx solution containing ~25 wt.% HSQ is best. Thus, it may be necessary to evaporate or add more HSQ solvent (making sure that it is dry) in order to adjust the concentration. Whether a dilution or concentration is necessary is difficult to determine without trial and error; i.e. make some samples and examine the results, as discussed below.
2. Fabrication of Coated Capillaries
- Filling the capillary Take the pieces of capillary prepared in step 1.1 and dip them into the FOx solution. When a capillary is dipped into the solution, you should be able to visually follow the meniscus up the channel, as the solution is drawn into the capillary (Figure 2a).
- When the meniscus reaches the top, remove the capillary and place it in a glass annealing crucible. It should now be completely filled with FOx solution. Repeat this for as many samples as possible, to increase the chances of success. We typically run batches of 20-30 and use two different concentrations of HSQ solutions by weight. We fill the capillaries in air, but keeping the FOx solution chilled in a glovebox is recommended if possible, in order to minimize exposure of the solution to oxygen and water vapor. Even small exposures can result in gelation of the solution.
- Annealing Anneal the capillaries in a two stage process. Annealing evaporates the solvent and collapses the HSQ cage structure, forming an SiOx film adhering to the channel walls. Annealing at higher temperatures disproportionates the SiOx film into Si quantum dots dispersed in a silica matrix. The annealing steps include a 30-minute ramp from room temperature to 300 °C, a dwell for 3 hr to evaporate the solvent, then a ramp to 1,100 °C in 45 min, and a dwell for one hour to precipitate the QDs.
- Let the capillaries slowly cool (~12 hr) back to room temperature. This helps to minimize stress-related cracking of the film deposited on the capillary wall. Other annealing protocols could probably be followed and may be more reliable, but a high-temperature anneal stage at 1,000-1,100 °C is always necessary to form the QDs. At the end of this step, one should (hopefully) have 20-30 capillaries with a layer of fluorescent QDs embedded in a silica matrix coating the channel walls.
3. Characterization
- Sample check The fluorescence microscope on which the capillaries are mounted must perform both imaging and spectroscopy in the 700-900 nm wavelength range. Epifluorescence or confocal setups are suitable for this purpose. Place a row of the candidate capillaries on the stage so that it is easy to move between them for quick visual analysis (Figure 2b). Excite the capillary with blue or UV radiation either in free space on the microscope stage, or directly through the objective lens using a dichroic filter, and observe the fluorescence image using the eyepieces or a color camera.
- Observe the capillary fluorescence. If the fabrication was successful, the capillaries will exhibit a bright red fluorescence. This is the first indication of a favorable sample. Capillaries exhibiting orange-yellow fluorescence (instead of the red color associated with the QDs) in general do not have the desired optical characteristics. These samples also tend to form more often in solutions with a low HSQ concentration. Some capillaries may show no fluorescence at all; in this case the QD film did not form and the capillary can be discarded (glass sharps). This is an indication that the solution may not have been drawn into the capillary, or it may have been deficient in HSQ. Finally, some samples may show a cracked or textured film; these can also be discarded.
- Discard all the samples mentioned in the previous step except those that show the bright red fluorescence characteristic of silicon QDs.
- Check for the presence of WGMs in the fluorescence spectra Ensure the image is aligned as desired on the entrance slit of the spectrometer and collect a fluorescence spectrum. Adjust the collection time so as to produce an acceptable signal-to-noise ratio. Perform wavelength and intensity calibrations as required. The QD spectra should be intense in the wavelength range from 700 to 900 nm. Spectra taken from the region corresponding to the capillary inner wall should show strong oscillations due to the presence of the cylindrical whispering gallery modes (WGMs); this is the second-to-last requirement of a successful refractometric sensor.
- Some samples may have a bright red QD fluorescence but lack WGM oscillations in the spectrum. This is an indication the QD film cracked or delaminated from the capillary wall, which destroys the optical resonances. Discard capillaries without WGMs. At this point, only the (typically small) fraction of samples that meet the sensor requirements remain. There is one final test to be performed.
- Refractometric analysis Attach the candidate capillaries to polyethylene, tygon, teflon, or other tubing chemically compatible with the intended analyte solutions whose inner diameter should be slightly larger than the capillary outer diameter. The choice of tubing should be made so as not to react with the solutions to be pumped into the capillary.
- Use a good adhesive to attach the glass capillary to the tubing; otherwise the capillary-tubing interface will leak. We have reasonably good success using Norland NOA-76 or Mascot instant adhesive gel. The choice of glue depends on its adhesion to the glass capillary and the tubing, and a lack of reaction with the channel fluids. Use care to prevent the adhesive from seeping into the capillary channel and blocking it.
- Interface the tubing via a syringe to a micropumping system. Compounds with well-known refractive indices such as methanol, ethanol, and water can be used to determine the refractometric sensitivity of the device. This is the final test of a successful sensor. Pump each fluid, one at a time, into the capillary, making sure not to burst the adhesive seal between the capillary and the tubing (Figure 2c).
- Collect spectra with each liquid inside the capillary. Use an analyzer in the light path to distinguish between TE-polarized WGMs (analyzer parallel to capillary axis) and TM-polarized WGMs (analyzer perpendicular to capillary axis). There should be a shift in the wavelength of the WGM resonances, either TE or TM, with each different solution in the capillary. If there is no observable shift, the quantum-dot film is too thick and the WGMs do not sufficiently sample the channel medium. In successful samples we observe sensitivities typically between 5 and 15 nm per solution refractive index unit (RIU). Almost all the samples that do show WGMs demonstrate a measurable sensitivity; however, typically only a small fraction of prepared capillaries will show WGMs.
4. Data Analysis
- Obtaining the fluorescence spectra Take a spectrum of the fluorescence of your sample. For biosensing applications, the channel surface has first to be functionalized for specific analytes. The surface of the QD film is essentially silica, so many surface modification recipes exist. Regardless of the application, the final step is the data processing and analysis.
- Achieving low detection limits requires measuring small spectral shifts- ideally the “shift resolution” should be significantly smaller than the nominal spectrometer resolution or pitch. Care must be exercised in the spectral processing due to this. In particular, on many imaging spectrometers the spectrum may not be projected perfectly horizontally onto the CCD; thus if, between analyses, the sample image drifts vertically on the slit, false spectral shifts may be obtained. Use whatever means are necessary to ensure that this doesn’t happen; e.g. use a calibration standard to determine the angle of the projected spectrum and correct for it, minimize sample drift, and ensure that the same CCD pixels are used to obtain all the spectra.
An example spectral image is shown in Figure 3, where the modes appear as strong oscillations at locations corresponding to the channel walls. Use a Mathematica computer code (or what your group prefers) to import the spectral images, output the 1D spectral data, and perform curve fitting and Fourier analysis of the WGM shifts, as described below.
- Achieving low detection limits requires measuring small spectral shifts- ideally the “shift resolution” should be significantly smaller than the nominal spectrometer resolution or pitch. Care must be exercised in the spectral processing due to this. In particular, on many imaging spectrometers the spectrum may not be projected perfectly horizontally onto the CCD; thus if, between analyses, the sample image drifts vertically on the slit, false spectral shifts may be obtained. Use whatever means are necessary to ensure that this doesn’t happen; e.g. use a calibration standard to determine the angle of the projected spectrum and correct for it, minimize sample drift, and ensure that the same CCD pixels are used to obtain all the spectra.
- Curve fitting Determine the WGM peak wavelength to measure small spectral shifts due to analytes in the FCM channel. Fit a single mode to a function that describes the spectral shape – this is a common way to obtain the peak position. In the ideal case, this will be a Lorentzian function (with proper conversion from wavelength to frequency units via δλ = │-cδf/f2│ where c is the speed of light):

In Eq. 1, A is a scaling parameter and f0 is the central frequency. Unfortunately, FCMs are not an ideal case.- In cylindrical cavities the WGMs are skewed toward higher frequencies, likely owing to the development of spiraling resonances (WGMs with a non-zero axial component of the wavevector).15 Lorentzian fits therefore perform poorly for determining the peak position. Unfortunately, there is no function that will fit a distribution of overlapping Lorentzians from the spiraling WGMs. In previous work 16 we suggested that a skewed Lorentzian 17 would give a better fit:

Here, a and B are skewing parameters. As can be seen in Figure 4, Eq. 2 does give a better fit to the data than Eq. 1, but unfortunately it has no physical basis in the theory of WGMs.
- In cylindrical cavities the WGMs are skewed toward higher frequencies, likely owing to the development of spiraling resonances (WGMs with a non-zero axial component of the wavevector).15 Lorentzian fits therefore perform poorly for determining the peak position. Unfortunately, there is no function that will fit a distribution of overlapping Lorentzians from the spiraling WGMs. In previous work 16 we suggested that a skewed Lorentzian 17 would give a better fit:
- Fourier shift analysis Alternatively, the data can be processed using a discrete Fourier transform, and the corresponding phase shifts measured from the Fourier spectrum. This method takes advantage of the periodicity of the whole spectrum, as opposed to using a single arbitrary WGM. It does not measure the peak wavelength position, but instead measures an overall shift of a given WGM spectrum with respect to an arbitrary reference spectrum.
- Use the phase difference Δφ for the high-power Fourier component that corresponds to the main WGM spectral oscillation to obtain the spectral shift. This corresponds to a real WGM frequency shift of:
δf = Δφ(fmax – fmin)/(2πk),
where fmin and fmax are the minimum and maximum frequency in the spectra. However, much information can be discarded if only the main component is used; additionally, truncation issues may make it difficult to determine which component is the main one. Often, the best results require some trial and error as to which Fourier components to select. - The shift theorem instead uses all of the Fourier components. Accordingly, for a pure shift, each individual component is shifted proportional to k (with k being the component number). In other words, δφk = mk, where the proportionality m is a measure of the real shift. The total frequency shift is thus given by:
δf = m(fmax – fmin)/(2π) .
This requires m to be obtained from a linear fit to the phase differences ΔΦk for some or all of the Fourier components. - For real data, the linear relation ΔΦk = mk will have uncertainty due to noise and background signal, which can have a significant effect in the low-power Fourier components. Thus, we recommend a weighted linear fit, in which the weight for each component is proportional to its power, in order to obtain the slope of the ΔΦk vs. k graph. The spectrum can be filtered around the main component prior to fitting, to remove both high frequencies (noise) and low frequencies (uncoupled fluorescence background). The frequency shifts from Eq. 4 are then converted into wavelength units.
- Unlike the case for curve fitting, a WGM “wavelength” is never obtained, but instead a wavelength shift is measured over the whole spectrum with respect to an arbitrary reference spectrum. The procedure is then repeated for every spectrum to be analyzed. The steps for this procedure are as follows:
- Convert the spectra into frequency units to ensure a constant free spectral range.
- Choose the reference dataset (i.e. the first WGM fluorescence spectrum) from which all shifts will be measured.
- Interpolate the spectra to obtain uniform frequency spacing.18
- Perform a discrete Fourier transform to obtain the power and phase components of each spectrum.
- Find the phase differences for all k components of a given WGM spectrum for which the shift value is desired, with respect to the reference spectrum.
- Find the phase shift using the phase difference of either the main Fourier component only, or a weighted linear fit to the selected components. This will give the phase shift δf or δλ between the WGM spectrum and the reference spectrum.
- The errors in the spectral shifts (the detection limit) can be measured by collecting repeated spectra for the same analyte. An uncertainty in the sensitivity can be obtained from the error in the weighted linear fits, if multiple components are used.
- Use the phase difference Δφ for the high-power Fourier component that corresponds to the main WGM spectral oscillation to obtain the spectral shift. This corresponds to a real WGM frequency shift of:
Repeat Steps 1-7 for every analysis. While this procedure sounds complicated, after the initial implementation the procedure is simple to automate, so that large data sets can be batch processed to find the shifts. We use a Mathematica code written specifically for this procedure, so that complete data sets can be batch processed “with the press of a button”. In principle, the spectral shifts can even calculated “live”, although we have not done this yet.
Representative Results
Small deviations in the capillary fabrication procedure can lead to significant changes in the sample success rate. In Figure 5(a-d), we show representative examples of failed capillaries as well as a successful one. Generally, the visual indication of a successful sample is a red fluorescence combined with a high intensity at the capillary walls and a featureless interior. The fluorescence spectrum also clearly indicates the difference between success and failure (Figure 5e). A good sample should show well-defined (visibility ≈ 0.5) WGM oscillations in the spectrum.
The setup can be programmed to take spectra continuously as analytes are pumped into the capillary channel (Figure 6a). Using the technique described above, the data analysis can be performed as a batch job on all the WGM spectra, which should shift as different analytes are injected into the capillary. Here, we show the results for a continuous time series (i.e. a sensorgram) as water, methanol, and finally ethanol are pumped sequentially into the channel. Only the main Fourier component was chosen in this case (Figure 6b), since the results were considered satisfactory even for this simple analysis. The error bars represent one standard deviation of the peak position for the first 100 measurements (with water in the channel).
Sensorgram operation of these devices (i.e. continuous time series as opposed to single static measurements) avoids missing potentially interesting features of an analysis. For example, we see a “bump” in the WGM shift data between water and methanol, indicating analyte with a higher refractive index than either pure component. In fact, water-methanol mixtures are known to have a higher refractive index than either pure phase,19 suggesting the presence of a small mixing region between the two solutions. For biosensing measurements, we anticipate that sensorgram measurements will be crucial for determining the nature and specificity of the analyte binding. In Figure 6c, we also see that the uncertainty in the peak position is ~10 pm, which is considerably smaller than the 110 pm pitch of the spectrometer. This improvement is achievable because of the data analysis method, which here can detect shifts an order of magnitude smaller than the spectrometer pitch.
Finally, the average sensitivity of the capillary can be obtained from the net shift for the three solutions, over the corresponding analyte refractive index range. This will depend mainly on the film thickness and refractive index. The latter is known to be ~1.67, from ellipsometric measurements on flat films prepared using similar methods.20 For a 30-μm inner diameter, the theoretical maximum sensitivity can be calculated using the perturbation theory approach developed in Ref.21, using the cylindrical solutions instead of the spherical ones. With this method, for channel index of 1.33, the maximum sensitivity of the (n, l) = (1, 190) mode near λ = 780 nm is equal to 25.7 nm/RIU for a film thickness of 265 nm. The experimental average sensitivity is 16.0 nm/RIU in this wavelength range, indicating that the film thickness is sub-optimal.
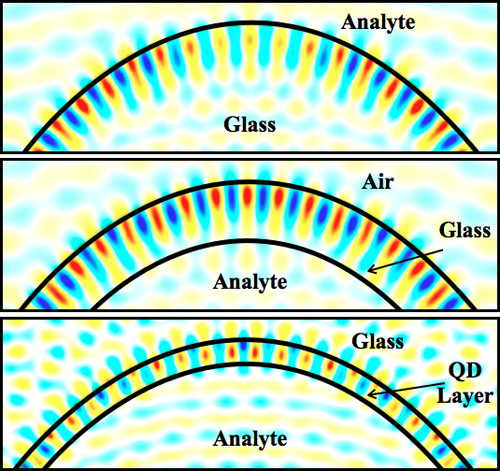
Figure 1. Electric field amplitude for the whispering gallery modes of a microsphere (a), an LCORR (b), and an FCM (c). In the latter two cases the analyte is inside the channel; for a microsphere, the analyte is outside and therefore needs a separate chamber. The radial mode order is 1, while the angular order is 53, 52, and 65, respectively.
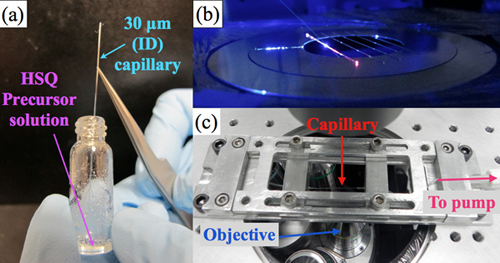
Figure 2. (a) A capillary being dipped into a solution of FOx-15. Although it is not possible to see the meniscus in the photograph, the experimenter can observe it rising up the channel. (b) A set of final capillaries on the microscope stage for preliminary analysis. A 445-nm laser is incident near the center of the leftmost capillary; the red glow is the Si-QD fluorescence. This appears especially intense at the end of the capillary, due to waveguiding within the glass capillary walls. (c) A successful capillary held in the microfluidic analysis setup. Fluid injected into the capillary from the micropump (not shown) flows right-to-left through the channel, and enters another tube for disposal.
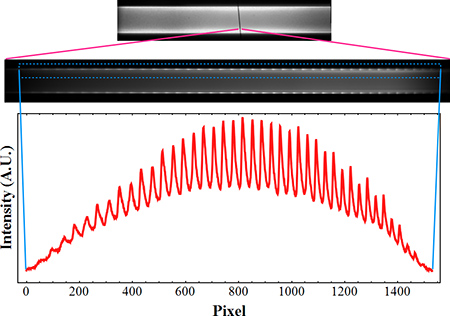
Figure 3. A typical WGM spectrum. The top fluorescence image shows the position of the spectrometer entrance slit, along with the corresponding 2D spectral image. The final 1D spectrum extracted is from the boxed region.
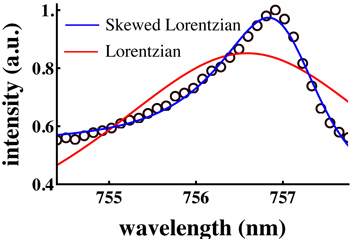
Figure 4. A single mode extracted from a capillary WGM spectrum and fit with a pure Lorentzian (Eq. 1; red line) and a skewed Lorentzian (Eq. 2; blue line). While the latter obviously provides a better fit, peak fitting is generally not the best option for identifying very small spectral shifts, as required to achieve low detection limits.
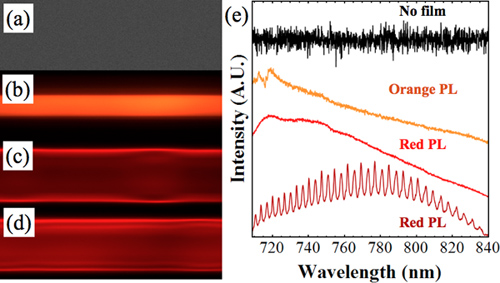
Figure 5. (a-d) show a set of fluorescence images of failed and a successful FCM. (a): no luminescence; this capillary did not properly fill or the solution was entirely evaporated. (b) yellow-orange fluorescence in the capillary channel. Here, the fluorescent region is not on the walls of the capillary but rather in the center. In some samples, the film appears to shrivel up in the middle of the channel. (c) shows strong red fluorescence but lacks WGMs in the spectrum. Some irregularities are observable in the film structure. (d) was a successful capillary with good WGMs. One signature of successful films is channel uniformity and a lack of irregular features. The corresponding fluorescence spectra are shown in (e).
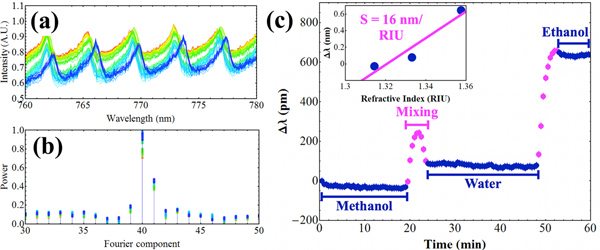
Figure 6. (a) a set of spectra taken as methanol, then water, then ethanol were pumped into the capillary. The spectra were taken sequentially from red to blue. (b) shows the Fourier power spectrum of each fluorescence spectrum. The 40th component represents the main observable WGM oscillation. The corresponding phase differences were taken for this component only, and are plotted in (c), after conversion into wavelength shifts via Eq. 4. The error bars represent one standard deviation of the peak shift for 60 measurements. The inset shows the average sensitivity over the refractive index range from methanol to ethanol. Theoretically, the wavelength shifts increase with increasing refractive index and are not therefore strictly linear, in agreement with the observed shift data.
Discussion
Fluorescent-core microcavities can be used as refractometric sensors. While there are isolated examples of “rolled up” microtubes that could act as microfluidic sensors,22 compared to microtubes, capillaries will be easier to integrate into microfluidic setups and have considerable practical advantages, since they are easily handled and simple to interface with an analysis setup. Using conventional Fourier analysis methods, wavelength shifts that are at least an order of magnitude smaller than the pitch of the spectroscopy system can be detected. This method also permits integration into sensorgram-type measurement systems.
These FCMs would mainly compete with liquid-core optical ring resonators (LCORRs).23,24,25 LCORRS are glass capillaries that have been thinned by heating and pulling, pumping HF into the channel to dissolve the inner capillary surface, or heating and inflation with pressurized gas.26 These treatments result in a capillary with micrometer-thin walls, as required to support WGMs having an evanescent tail extending into the capillary channel. LCORR biosensors have been demonstrated for the detection of a variety of different target analytes.27,28,29,30
FCMs have several clear advantages and limitations in comparison with LCORRs. Both devices rely on the flow of an analyte through a capillary channel. Both are based on silica chemistry and can be functionalized using similar methods. However the resolution and detection limit of the LCORR will be better, assuming equivalent data analysis methods are used. This is because LCORRs are based on precision tunable laser measurements that have a very high sampling rate, whereas FCMs use a conventional spectrometer. This decreases the detection limits (and potentially the sensitivity31) of the FCM. We have so far achieved, at best, a detection limit of around 10-5 RIU using variations of this technique, whereas a value of 10-6 RIU is standard in LCORRs. One additional issue concerns the use of a spectrometer in the overall system cost. The fluorescence from Si-QDs can easily be measured with small-footprint, non-cooled hand-held spectrometer devices such as the Ocean Optics USB2000 series (currently an expense of ~$2,000). However, use of such a device with FCMs will require consideration and testing of the experimental setup, since it may not be simple to obtain WGM spectra from a small region of the capillary without using a microscope objective and an imaging spectrometer.
LCORRs require the use of apparatus that is both expensive and difficult to operate “in the field”, such as a tunable laser and precise nanopositioning equipment. Furthermore, the thin-walled capillary is both fragile and difficult to handle. FCMs, in contrast, need a blue light source such as a simple diode laser or LED, and optics to project the fluorescence image onto the entrance slit of a spectrometer. The FCM is also much more robust than the thin-walled LCORR. The method could also be extended to different types of fluorescent layers that could have higher efficiencies and different peak wavelengths, as compared to Si-QDs. Thus, the choice of a preferred sensor (LCORR vs. FCM) would probably depend on the intended application. If very low concentrations of analyte are present, the low detection limits of the LCORR would be advantageous. If ease of use, durability, and experimental cost is the main concern, then the FCM could be a better option if the spectrometer can be integrated without the use of a fluorescence microscope. Although having distinctly different advantages and limitations, both devices are promising for microfluidic analysis of a wide range of potential analytes.
開示
The authors have nothing to disclose.
Acknowledgements
This research was funded by NSERC, Canada.
Materials
| Table of Materials | Company | Catalog # | コメント |
| silica microcapillaries | |||
| flexible microbore tubing | polyethylene, tygon, etc | ||
| adhesive | Mascot, Norland NOA | ||
| HSQ dissolved in MIBK | e.g., FOx-15 | ||
| methanol | |||
| ethanol | |||
| distilled water |
Table 1. List of materials used.
参考文献
- Mairhofer, J., Roppert, K., Ertl, P. Microfluidic Systems for Pathogen Sensing. A Review. Sensors. 9, 4804-4823 (2009).
- Jokerst, J. J., Emory, J. M., Henry, C. S. Advances in microfluidics for environmental analysis. Analyst. 137, 24-34 (2012).
- Neethirajan, N., Kobayashi, K., et al. Microfluidics for food, agriculture and biosystems industries. Lab on a Chip. 11, 1574-1586 (2011).
- Amarie, D., Alileche, A., et al. Microfluidic Devices Integrating Microcavity Surface-Plasmon-Resonance Sensors: Glucose Oxidase Binding-Activity Detection. Analytical Chemistry. 82, 343-352 (2010).
- Vollmer, F., Arnold, S., Keng, D. Single virus detection from the reactive shift of a whispering-gallery mode. PNAS. 105, 20701-20704 (2008).
- Armani, A. M., Kulkarni, R. P., et al. Single-Molecule Detection with Optical Microcavities. Science. 317, 783-787 (2007).
- Arnold, S., Shopova, I., Holler, S. Whispering gallery mode bio-sensor for label-free detection of single molecules: thermo-optic vs. reactive mechanism. Optics Express. 18, 281-287 (2009).
- Vollmer, F., Braun, D., et al. Protein detection by optical shift of a resonant microcavity. Applied Physics Letters. 80, 4057-4059 (2002).
- Rayleigh, L. The problem of the whispering gallery. Philosophical Magazine. 20, 115-120 (1910).
- White, I. M., Oveys, H., Fan, X. Liquid-core optical ring-resonator sensors. Optics Letters. 9, 1319-1321 (2006).
- Rodriguez, J. R., Bianucci, P., et al. Whispering gallery modes in hollow cylindrical microcavities containing silicon nanocrystals. Applied Physics Letters. 92, 131119 (2008).
- Bianucci, P., Rodriguez, J. R., et al. Whispering gallery modes in silicon nanocrystal coated microcavities. Physica Status Solidi A. 206, 965 (2009).
- Hessel, C. M., Henderson, E. J., et al. Hydrogen Silsesquioxane: A Molecular Precursor for Nanocrystalline Si-SiO2 Composites and Freestanding Hydride-Surface-Terminated Silicon Nanoparticles. Chemistry of Materials. 18, 6139-6146 (2006).
- Poon, A. W., Chang, R. K., Lock, J. A. Spiral morphology-dependent resonances in an optical fiber: effects of fiber tilt and focused Gaussian beam illumination. Opt. Lett. 23, 1105-1107 (1998).
- Silverstone, J. W., McFarlane, S., Manchee, C. P. K., Meldrum, A. Ultimate resolution for sensing with microcavities. Optics Express. 20, 8284-8295 (2012).
- Stancik, A. L., Brauns, E. B. A simple asymmetric lineshape for fitting infrared absorption spectra. Vibrational Spectroscopy. 47, 66-69 (2008).
- Lomb, N. R. Least-squares frequency analysis of unequally spaced data. Astrophysics and Space Science. 39, 447-462 (1976).
- Scott, R. P. W. The thermodynamic properties of methanol-water association and its effect on solute retention in liquid chromatography. Analyst. 125, 1543-1547 (2000).
- Manchee, C. P. K., Zamora, V., et al. Refractometric sensing with fluorescent-core microcavities. Optics Express. 19, 21540-21551 (2011).
- Teraoka, I., Arnold, S. Enhancing Sensitivity of a Whispering Gallery Mode Microsphere Sensor by a High-Refractive Index Surface. Layer. J. Opt. Soc. Am. B. 23, 1434-1441 (2006).
- Huang, G., Bolanos Quinones, V. A., et al. Rolled-up optical microcavities with subwavelength wall thicknesses for enhanced liquid sensing applications. ACS Nano. 4, 3123-3130 (2010).
- Fan, X. D., White, I. M., et al. Overview of novel integrated optical ring resonator bio/chemical sensors. Proceedings of the Society of Photo-Optical Instrumentation Engineers (SPIE). 6452, M4520-M4520 (2007).
- White, I. M., Zhu, , et al. Refractometric sensors for lab-on-a-chip based on optical ring resonators. IEEE Sensors J. 7, 28-35 (2007).
- Li, H., Fan, X. Characterization of sensing capability of optofluidic ring resonator biosensors. Applied Physics Letters. 97, 011105 (2010).
- Zamora, V., Díez, A., et al. Refractometric sensor based on whispering gallery modes of thin capillaries. Optics Express. 15, 12011-12016 (2007).
- Suter, J. D., White, I. M., et al. Label-free quantitative DNA detection using the liquid core optical ring resonator. Biosensors and Bioelectronics. 23, 1003-1009 (2008).
- White, I. M., Oveys, H., et al. Integrated multiplexed biosensors based on liquid core optical ring resonators and antiresonant reflecting optical waveguides. Applied Physics Letters. 89, 191106 (2006).
- Yang, G., White, I. M., Fan, X. An opto-fluidic ring resonator biosensor for the detection of organophosphorus pesticides. Sensors and Actuators B: Chemical. 133, 105-112 (2008).
- Zhu, H., Dale, P. S. Rapid and Label-Free Detection of Breast Cancer Biomarker CA15-3 in Clinical Human Serum Samples with Optofluidic Ring Resonator Sensors. Anal. Chem. 81, 9858-9865 (2009).
- Redding, B., Marchena, E., et al. Comparison of raised-microdisk whispering-gallery-mode characterization techniques. Optics Letters. 35, 998-1000 (2010).

