Isolation and Cannulation of Cerebral Parenchymal Arterioles
Summary
This manuscript describes a simple and reproducible protocol for isolation of intracerebral arterioles (a group of blood vessels encompassing parenchymal arterioles, penetrating arterioles and pre-capillary arterioles) from mice, to be used in pressure myography, immunofluorescence, biochemistry, and molecular studies.
Abstract
Intracerebral parenchymal arterioles (PAs), which include parenchymal arterioles, penetrating arterioles and pre-capillary arterioles, are high resistance blood vessels branching out from pial arteries and arterioles and diving into the brain parenchyma. Individual PA perfuse a discrete cylindrical territory of the parenchyma and the neurons contained within. These arterioles are a central player in the regulation of cerebral blood flow both globally (cerebrovascular autoregulation) and locally (functional hyperemia). PAs are part of the neurovascular unit, a structure that matches regional blood flow to metabolic activity within the brain and also includes neurons, interneurons, and astrocytes. Perfusion through PAs is directly linked to the activity of neurons in that particular territory and increases in neuronal metabolism lead to an augmentation in local perfusion caused by dilation of the feed PA. Regulation of PAs differs from that of better-characterized pial arteries. Pressure-induced vasoconstriction is greater in PAs and vasodilatory mechanisms vary. In addition, PAs do not receive extrinsic innervation from perivascular nerves — innervation is intrinsic and indirect in nature through contact with astrocytic endfeet. Thus, data regarding contractile regulation accumulated by studies using pial arteries does not directly translate to understanding PA function. Further, it remains undetermined how pathological states, such as hypertension and diabetes, affect PA structure and reactivity. This knowledge gap is in part a consequence of the technical difficulties pertaining to PA isolation and cannulation. In this manuscript we present a protocol for isolation and cannulation of rodent PAs. Further, we show examples of experiments that can be performed with these arterioles, including agonist-induced constriction and myogenic reactivity. Although the focus of this manuscript is on PA cannulation and pressure myography, isolated PAs can also be used for biochemical, biophysical, molecular, and imaging studies.
Introduction
The cerebral circulation is uniquely organized to support the metabolic demands of central neurons, cells that have limited energy stores and are consequently highly sensitive to changes in oxygen pressure and supply of necessary nutrients. As particular neuronal subpopulations becomes active when specific tasks are performed, the vasculature promotes a highly localized increase in perfusion to prevent local hypoxia and depletion of nutrients 1. This is a form of functional hyperemia known as neurovascular coupling, and is dependent on the proper operation of the neurovascular unit, composed of active neurons, astrocytes, and cerebral arteries 2. Intracerebral parenchymal arterioles, a group of blood vessels encompassing parenchymal, penetrating and pre-capillary arterioles, are centrally important for this response and it is then critical to study them individually in order to investigate neurovascular coupling 3.
Parenchymal arterioles are small (20 – 70 µm internal diameter) high-resistance blood vessels that perfuse distinct neuronal populations within the brain. Branching out from pial arteries on the surface, parenchymal arterioles penetrate into the brain parenchyma at a nearly 90ᵒ angle to feed the subsurface microcirculation (Figure 1). These arterioles play a critical role in maintaining appropriate perfusion pressure as they are the most distal smooth muscle-containing vessels protecting the capillaries. In contrast to the surface pial circulation, parenchymal arterioles lack collateral branches and anastomoses, and consequently are "bottlenecks" of the cerebral circulation 4. As a result, dysfunction of parenchymal arterioles contributes to the development of cerebrovascular diseases such as vascular cognitive impairment and small ischemic strokes (also known as silent or lacunar strokes). Studies indicate that parenchymal arterioles dysfunction can be induced by essential hypertension 5, chronic stress 6, and is an early event in small vessel disease genetic mouse model 7. Further, experimentally-induced occlusion of single penetrating arterioles in rats is sufficient to cause small ischemic strokes that are cylindrical in shape, similar those observed in older humans 8.
In addition to these anatomical distinctions, mechanisms regulating contractile function differ between pial arteries and parenchymal arterioles. Myogenic vasoconstriction is greater in parenchymal arterioles 9, possibly because of the lack of extrinsic innervation 10, distinct modes of mechanotransduction 11, and differences in intracellular Ca2+ signaling 12,13 in vascular smooth muscle cells. Evidence suggests that endothelium-dependent vasodilator mechanisms also differ between these vascular segments, with parenchymal arteries exhibiting greater reliance on mechanisms involving Ca2+-activated K+ channels and electrotonic communication within the vascular wall compared with diffusible factors such as nitric oxide and prostacyclins 14. Therefore, data gathered in experiments using pial arteries may not necessarily apply to parenchymal arterioles, leaving a gap in our knowledge of local control of cerebral perfusion.
Despite their importance, parenchymal arterioles are vastly under-studied, primarily due to the technical challenges with isolation and mounting for ex vivo study. In this manuscript we describe a methodology to isolate and cannulate cerebral parenchymal arterioles, which can be used for pressure myography, or to isolate tissue for immunolabeling, electrophysiology, molecular biology, and biochemical analysis.
Protocol
1. Cannula and Chamber Preparation
- Insert clean borosilicate glass capillaries (outer diameter: 1.2 mm; internal diameter: 0.69 mm; 10 mm in length) into the grooves of a pipette puller with a platinum filament (diameter: 100 µm).
- Using appropriate settings, pull the capillary to generate a cannula with a long and thin tip (Figure 2) using a micropipette puller. The settings used are: Heat – 700, Pull – 100, Velocity – 50, Time – 10.
- Insert cannula into the holder of pressure myograph chamber. Align the cannulas appropriately.
- Carefully break the tips of the cannulas by using a forceps under the dissecting microscope to the desired diameter. Here we show a cannula with a 10 µm tip (Figure 2).
- Fill both cannulas with artificial cerebrospinal fluid (aCSF) containing 1.8 mM Ca2+; fill the chamber with Ca2+-free aCSF supplemented with 1% bovine serum albumin (BSA) + 10 µM Diltiazem (all solutions should be prepared fresh before the start of the experiment). Depending on the size of the chamber, vary the volume of aCSF between 5 to 20 ml. Store the chamber at 4 ᵒC until ready to start cannulation.
NOTE: Diltiazem is a reversible L-type voltage gated calcium inhibitor that will cause dilation of the arterioles, which facilitates cannulation
2. Isolation of Parenchymal Arterioles
- Euthanize the animal immediately prior to dissection using standard protocols in the laboratory that are approved by the institution's animal care committee. The use of barbiturates or carbon dioxide is preferred, as other commonly used anesthetics may have vasodilatory effects in the cerebral circulation 15. All animal procedures shown here have been approved by Institutional Animal Care and Use Committee from the University of Nevada School of Medicine, and are in agreement with the National Institutes of Health "Guiding Principles in the Care and Use of Animals".
- Euthanize the animal using carbon dioxide. Before decapitation, ensure that the animal has stopped breathing and is unresponsive when pinching its paws.
- Decapitate the animal using a sharp scissor (mouse) or guillotine (rat). Remove the skin from the animal's head and cut along the midline cranial suture using a fine tip scissor. Using a blunt forceps (mouse) or a bone plier carefully remove the cranial bones and expose the cerebrum. Remove the brain slowly and carefully as to not damage surface pial arteries. Place the brain into a container filled with 20 ml of Ca2+-free aCSF supplemented with 1% BSA on ice.
- Fill a dissection dish containing a pad with ice-cold Ca2+-free aCSF supplemented with 1% BSA and transfer the brain with the ventral surface facing upwards to this dish (Figure 2A). Place the dish under a dissecting microscope (Figure 3A). Pin the brain to the pad using 27-gauge needles. Be careful to avoid placing pins near the middle cerebral artery (MCA).
- Localize the Circle of Willis and the MCA branching from it. Using sharp and aligned Vannas spring scissors, cut a small rectangle around the MCA. Ensure that rectangle is close to 5 mm across through the entire length of the MCA. The top part of the rectangle should be past the branching point from the Circle of Willis (proximal to the Circle of Willis, Figure 2B, arrow).
- Using the Vannas spring scissors, perform an undercut into the depth of the tissue for approximately 2 – 3 mm.
NOTE: This part is critical for good isolation of parenchymal arterioles, and it may take a few trials to get it right. If the cut is note made deep enough, the isolated parenchymal arterioles will be short; if the cut is too deep, the arterioles will break at their branching point when the dissected tissue is removed. - Pin down the most distal end of the brain slice into the dissecting dish with the MCA facing upwards (distal from the Circle of Willis) using insect pins. Make a shallow incision to cut the pia near the pin, being careful not to cut too deep into the underlying cerebral cortex (otherwise the pins will not hold).
- Carefully grab each side of the pia with small forceps and start peeling the pia from cortex. If necessary, hold on to the MCA, ensuring that the surrounding pial membrane is not damaged.
- Keep peeling until the pia containing the MCA is free from the cortex. Note that the resistance against peeling will increase close to the Circle the Willis. Be extra careful at this point, because the longer parenchymal arterioles will be in this region.
- Once the pia is free, place it carefully on top of the pad on the dissecting dish with the surface opposite to parenchymal arterioles facing down (Figure 2B).
- Using Vannas spring scissors, cut out the dissected arterioles free from the MCA, making sure the ends of the vessel are cut bluntly.
- Collected arterioles can be used for pressure myography, molecular analysis, or isolation of native smooth muscle or endothelial cells.
3. Pressure Myography
- Prepare the suture ahead of time. Cut the dark green nylon thread into 5 mm pieces and place on the sticky side of a double-sided tape on a Petri dish. Under the dissecting microscope, separate each piece into its filaments using fine forceps, and loosely prepare a simple half-hitch knot by passing one end the filament into the other.
- Using forceps, pick a knot off the double-sided tape, making sure not to grab it with too much pressure. Pull the suture into bath solution, slide knot onto cannula and tighten it at a distance from the tip of the cannula. Repeat this process to have 2 sutures on each cannula.
- Coat a glass micropipette with a 10% BSA solution and then rinse off the excess with Ca2+-free aCSF supplemented with 1% BSA.
- Pull 50 µl of solution into the glass micropipette, pull up a parenchymal arteriole and transfer to the pressure myography chamber. Push plunger in one fluid motion to dispense the parenchymal arteriole into the chamber to prevent it from sticking to the internal chamber of the glass micropipette.
- Using two super fine forceps, open the lumen of the PA, being careful to only touch the very end of the vessel.
- Using the forceps to hold the edges of the parenchymal arteriole, carefully pull the vessel onto the cannula. Pull far enough on the cannula so that the vessel is not at the very tapered end of the cannula (Figure 3A).
- Loosen the 2 sutures on the cannula and tighten them on the vessel (Figure 3B). Space the sutures apart a little on the vessel, and pull toward the operator while tighten it. Make sure that any branches are tied off before closing the opposite end of the parenchymal arteriole.
- Turn chamber around and close the opposite end of the parenchymal arteriole as a blind-sac. To achieve that, open the ties on the opposite cannula and pass it onto the arteriole. Slowly close the knot in such a way that the parenchymal arteriole will be tied to the side of the cannula. Avoid longitudinal stretch of the arteriole. (Figure 3C).
NOTE: If the goal of the study is to perfuse drugs through the lumen, cannulate the opposite end instead of tying the parenchymal arteriole to the side of the cannula. Make sure the cannulas do not have any salt crystals or internal build-ups that block intraluminal flow. Regulate flow rate appropriately in order to maintain shear stress within physiological levels. A study by Shih et al. shows flow rates inside penetrating arterioles in rats 8, and can serve as an initial guide for pilot studies. - Carefully transfer the chamber to the stage of the microscope to be used for recording vessel diameter. Attach the chamber onto the microscope stage, connecting temperature probe and inlet and outlets for perfusion to the correct tubes. Pressurize the arteriole to 40 mmHg intraluminal pressure for mouse parenchymal arterioles or 50 mmHg for rat arterioles, using a pressure system available in the laboratory (water column, peristaltic pump coupled to a pressure transducer, etc.). Figure 4D shows an example of a peristaltic pump coupled to a pressure transducer to pressurize the cannulated arteriole.
- Turn on the system used to detect changes in diameter (Figure 3E). Adjust the settings on the microscope, such as illumination and contrast, in order to obtain the best detection possible. Ideally the walls of the arteriole should be dark and the lumen translucent. Once the detection is appropriate, start recording the experiment.
- Start the superfusion system. Wash the cannulated, pressurized parenchymal arteriole with warm (37 ᵒC) aCSF containing 1.8 mM Ca2+ for 15 to 20 min at a flow rate between 3 – 5 ml/min. This aCSF should not contain Diltiazem or BSA.
- Replace the regular aCSF with 60 mM KCl aCSF to evaluate the viability of the preparation. At this point PAs should exhibit 10 – 20% constriction to 60 mM KCl. If the arteriole does not constrict to that extent, remove and cannulate another arteriole.
- Wash out the 60 mM KCl with regular aCSF. Wait until generation of spontaneous myogenic tone, which could take up to one hour. If arteriole does not have myogenic tone by then, replace it with another arteriole.
NOTE: Myogenic tone is observed as a gradual, and sometimes slow, reduction in the lumen diameter of the vessel without stimulation by contractile agonists or high KCl solution. Myogenic tone is calculated by the following formula: (1 – (active lumen diameter/passive lumen diameter)) x 100 5. An appropriate amount of myogenic tone may vary according to treatments, strains, species, transgenics, etc. In general, physiological myogenic tone ranges from 15 – 30%5.
4. Example Pressure Myography Experiments: Agonist-induced Constriction and Myogenic Reactivity
- Prepare a series of dilutions of an agonist of choice in aCSF using appropriate concentrations. For the current example the thromboxane A2 receptor agonist U46619 was used. A stock solution of 1 ml of U46619 at a concentration of 1 mM was prepared. Transfer 100 µl of the 1 mM solution to a new tube containing 900 µl of aCSF to make a 10-fold dilution of the drug, resulting in a solution containing 100 µM U46619. Repeat this process for 6 dilutions, ranging from 1 mM to 100 nM to prepare a concentration-response constrictor curve.
- Add the entire volume of the solution containing the agonist (1 ml for the first dose, followed by 900 µl of all subsequent doses) to 100 ml of superfusing aCSF. This will lead to an extra 100-fold dilution of the agonist. Thus, the final concentrations of agonist in the bath range from 10 pM to 10 µM. Allow arterioles to incubate for ~10 min in each concentration, until luminal diameter reaches a steady-state.
- Wash out the agonist by superfusing PAs with aCSF without any drugs until the PA diameter is back to the original value. Incubate the parenchymal arteriole in Ca2+-free aCSF (without BSA) supplemented with 10 µM Diltiazem + 2 mM EGTA to induce maximum dilation and record passive diameter of the arteriole.
- Remove the parenchymal arteriole from the cannula by carefully pulling it out while holding into the end of the ties. Wash the vessel chamber with double deionized water to remove debris and excess of agonist. Fill the chamber with Ca2+-free aCSF + BSA and cannulate another arteriole. It is not recommended to perform more than one experiment per arteriole.
- To perform a myogenic reactivity experiment, allow the parenchymal arteriole to equilibrate at 40 mmHg intraluminal pressure until spontaneous myogenic tone is generated (described above). Reduce the intraluminal pressure to 5 mmHg and allow PA to equilibrate for ~5 – 10 min, until luminal diameter reaches steady state. Increase the intraluminal pressure stepwise using the interval of choice (for example from 5 to 140 mmHg in 20 mmHg increments).
- Do not expose the arteriole to intraluminal pressure below 5 mmHg, as that could cause collapse and damage the endothelium, thus altering the outcomes of the experiment.
- At the end of the pressure curve, superfuse the parenchymal arteriole with Ca2+-free aCSF (without BSA) supplemented with 10 µM Diltiazem + 2 mM EGTA and repeat the pressure steps, starting at the lowest pressure.
NOTE: This will give the passive diameters of the PA, which are necessary to calculate % myogenic tone, defined by the formula: % tone = (1 – (active diameter/passive diameter)) x 100.
Representative Results
Figure 5A shows a representative constriction of mouse PAs to 60 mM KCl aCSF to evaluate the integrity of the preparation. PAs should constrict between 15 – 30% in the presence of 60 mM KCl. If the constriction is below 15%, discard the PA and cannulate another one, as it suggests that the arteriole was damaged during the isolation and cannulation process.
Figure 5B illustrates PA constriction to increasing concentrations of the thromboxane A2 analogue U-46619 (10 pM to 1 µM) into the superfusing bath. The constriction was observed as a reduction in the lumen diameter after incubation with each concentration. The PA was allowed to equilibrate at each concentration for 10 minutes. These data can be analyzed and presented as a change in diameter (ΔDiameter) or as a % vasoconstriction to KCl, which normalizes the change in diameter by the maximum constriction to 60 mM KCl.
Figure 6 shows a representative tracing of the lumen diameter of a PA in a myogenic reactivity experiment. Stepwise increases in intraluminal pressure causes a graded constriction of PAs in the presence of 1.8 mM extracellular Ca2+ (Figure 6, lower tracing). Incubation of the same PA with aCSF without Ca2+ and supplemented with 10 µM Diltiazem + 2 mM EGTA abolishes myogenic tone generation, and the lumen diameter of the PA increases according to intraluminal pressure (Figure 5, upper tracing), which is the passive lumen diameter of the arteriole.
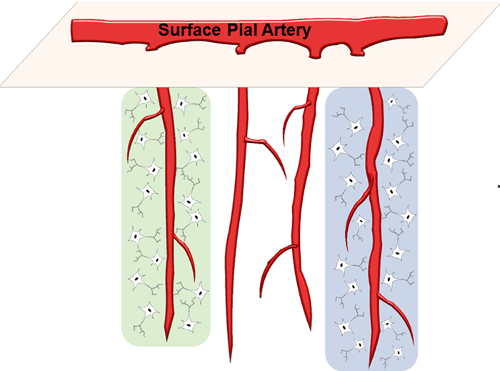
Figure 1: Schematic of Parenchymal Arterioles. PAs branch out of surface pial arteries and dive into the underlying brain parenchyma. Each PA perfuses a small neuronal population within its columnar territory (highlighted regions). Please click here to view a larger version of this figure.
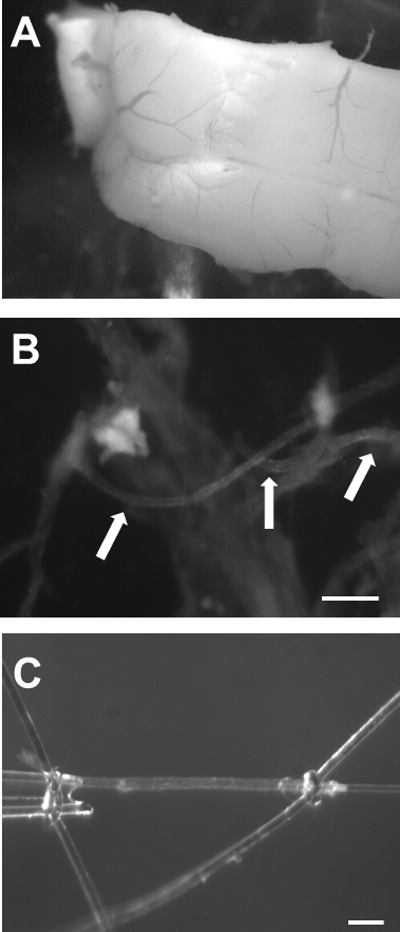
Figure 2: Isolation of Mouse Cerebral PAs. A) Image of the brain with the ventral surface facing upwards showing the Circle of Willis (arrow 1) and the MCA branching out from it (arrow 2). B) Image of the MCA with the underlying brain tissue. The arrow points to the most proximal region of the MCA from the Circle of Willis. C) PAs branching out of the MCA (arrows). Bar = 100 µm. Please click here to view a larger version of this figure.
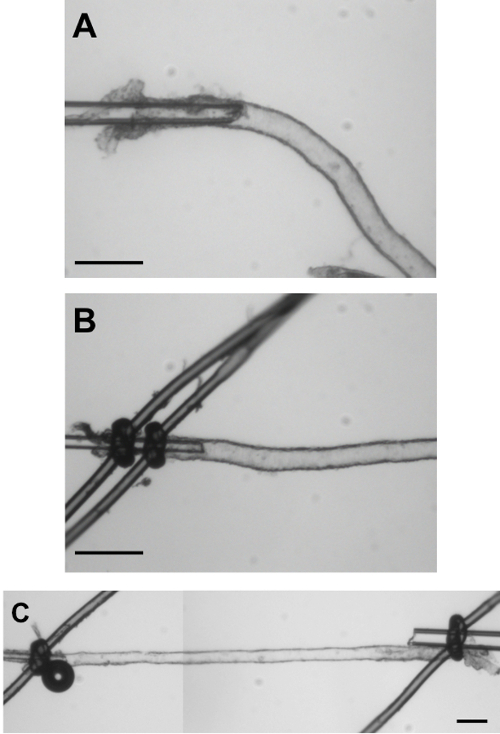
Figure 3: Cannulation of Isolated Mouse PAs. A) Image of a PA cannulated but not yet tied with the sutures. This image illustrates the length of the PA to be inserted on the cannula before closing it with the sutures. B) The PA is now closed on the cannula with 2 sutures to guarantee that it will not slide off the cannula after pressurization. C) Image of a cannulated, pressurized mouse PA in a blind-sac experimental configuration. Bar = 50 µm. Please click here to view a larger version of this figure.
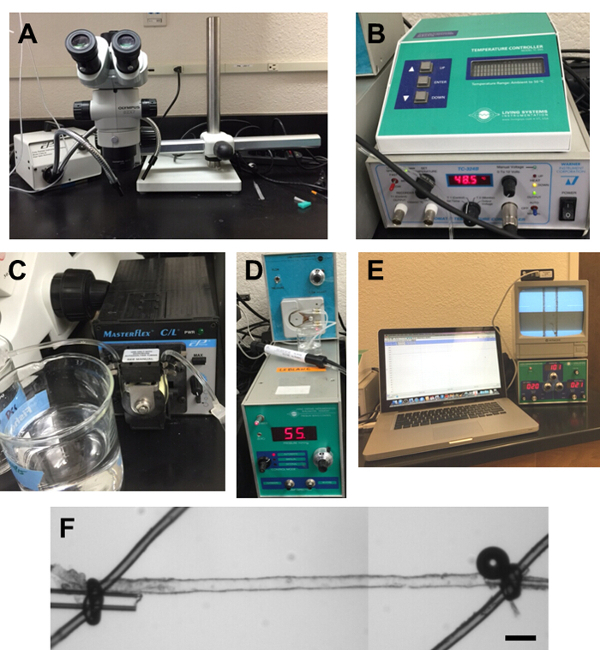
Figure 4: Equipment Used in Our Laboratory for PA Experiments. A) Dissection microscope with light source. B) Temperature controller. C) Peristaltic pump for bath superfusion of aCSF. D) Pressure Servo Control, Living Systems Instrumentation. E) Video Dimension Analyzer (bottom right), monitor (upper right) and Video Edge Detection system loaded on a laptop (left). F) Small vessel chamber (linear alignment chamber). Please click here to view a larger version of this figure.
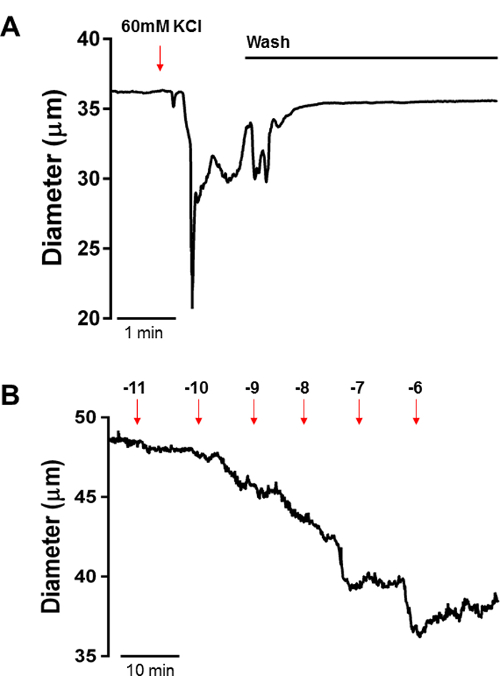
Figure 5: Constriction of PAs to KCl-induced Depolarization and the Thromboxane A2 Analogue U46619. A) Representative constriction of mouse PAs to 60 mM KCl aCSF to evaluate the integrity of the preparation. PAs should constrict between 15 – 30% in the presence of 60 mM KCl. B) U46619 induced constriction of PAs; as observed in the tracing, U46619 causes a concentration-dependent constriction of PAs, observed as a reduction in the lumen diameter after incubation with each concentration. Please click here to view a larger version of this figure.
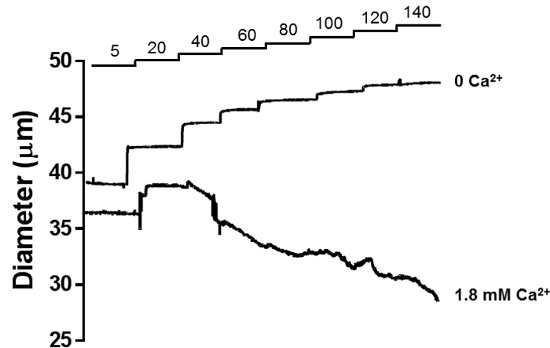
Figure 6: Myogenic Reactivity of PAs. Stepwise increases in intraluminal pressure causes a graded constriction of PAs in the presence of 1.8 mM extracellular Ca2+ (lower tracing). This pressure-induced constriction is characteristic of resistance arterioles. Incubation of the same PA with aCSF without 1.8 mM Ca2+ and supplemented with 10 µM Diltiazem + 2 mM EGTA abolishes myogenic tone generation, and the lumen diameter of the PA increases according to intraluminal pressure (upper tracing), which is the passive lumen diameter of the arteriole. Please click here to view a larger version of this figure.
Discussion
Cerebral parenchymal arterioles are high resistance arterioles with few anastomoses and branches that perfuse distinct neuronal populations. These specialized blood vessels are central players in cerebrovascular autoregulation and neurovascular coupling through astrocyte-mediated vasodilation 1. The importance of these specialized blood vessels in cerebral vascular disease has been known for approximately 50 years, when the pioneering work of Dr. Miller Fisher described structural alterations in parenchymal arterioles within the territories of lacunar infarcts in the brains of hypertensive patients post-mortem16. These alterations, coupled to functional impairment, can cause hypoperfusion of the deep white matter, a major risk factor for development of vascular-related dementias 17. Parenchymal arterioles are functionally distinct from large intracranial and pial arteries as well as surface arterioles, thus accumulated data using these members of the cerebrovascular tree may not be easily extrapolated to the parenchymal microcirculation. Despite their clear importance in maintaining proper brain homeostasis, studies focusing on the physiology and functional responses of these arterioles have been scarce until recent years, primarily due to technical difficulties associated with isolation and manipulation.
In the present manuscript we describe a simple and reproducible technique for isolation and cannulation of parenchymal arterioles for pressure myography studies, molecular analysis, or the preparation of native smooth muscle or endothelial cells. Moreover, we present data on the use of this technique to investigate myogenic regulation, constrictor, and dilatory mechanisms in parenchymal arterioles. We observe that these vessels are myogenically active, generating spontaneous myogenic tone when intraluminal pressure is maintained at a constant level, as well as changing its myogenic status facing changes in intraluminal pressure, a phenomena well-described for resistance arteries called myogenic reactivity 18. Myogenic reactivity is a key factor in regulating perfusion pressure within the brain, keeping it constant facing fluctuations in systemic arterial pressure, thus preventing loss of perfusion at low pressures, or vasogenic edema at higher pressures 18. In addition, we show that these arterioles respond to vasoactive substances, such as endothelin-1, an important endogenous vasoconstrictor produced by endothelial cells. A major limitation of the preparation described here is that by isolating the parenchymal arterioles vital components of the neurovascular unit are lost and functional hyperemic responses cannot be studied. Other preparations, such as brain slice, maintain the structure of the intact neurovascular unit and are more appropriate to study astrocytic control of cerebral arteriolar diameter 19. However, in the brain slice preparation, parenchymal arterioles are not pressurized and exogenous administration of receptor-dependent vasoconstrictor agents is needed to mimic basal tone in order to study vasodilatory responses. Pressure myography and the brain slice preparation should be consider complementary for the study of the cerebral microcirculation.
The protocol described here was adapted from a preparation first described by Dacey and Duling in 198220, and altered by Coyne et al.21. The major difference lies in the cannulation technique used: while Dacey and Duling and Coyne et al. used two different sets of pipettes, a holding external pipette and an intraluminal cannulation pipette, we use only the intraluminal pipette and manually slide the PA into the pipette. This technique has been recently used to perform studies in rat PAs after cerebral ischemia — reperfusion injury 22, PAs from chronically hypertensive rats 5, among others. In mice, we utilized this technique to assess Ca2+ signals in pressurized PA smooth muscle cells under physiological conditions and acidosis by coupling PA cannulation to laser scanning confocal microscopy to assess Ca2+ waves and sparks in smooth muscle cells 13. We also tested several neurovascular coupling agents 3 and demonstrated, using pharmacological tools in conjunction with membrane potential recordings, that cerebrospecific up-regulation of voltage-gated potassium channels KV1 causes a channelopathy-like defect in small vessel disease genetic model 7. These examples illustrate the viability of this preparation to answer different research questions.
It is important to highlight that isolation of cerebral PAs from the brain tissue is the most critical step, as the ease of cannulation will depend on the number and length of PAs isolated. It may take a few trials to optimize the isolation. Further, the learning curve for cannulation can be long and frustrating, and initial success rates may be as low as 50%. However, once mastered, the reproducibility and throughput of this technique is high, and many experiments can be performed in one day.
In summary, the present manuscript describes a technique for isolation and cannulation of cerebral parenchymal arterioles. Such preparation isolated the vascular component of the neurovascular unit, maintaining intact responses of pressurized arterioles. Studies using isolated PAs will provide valuable insight into the cerebral parenchymal circulation, in both physiological and pathological conditions.
Divulgazioni
The authors have nothing to disclose.
Acknowledgements
Funded by NHLBI R01HL091905 (SE), the United Leukodystrophy Foundation CADASIL research grant (FD) and AHA 15POST247200 (PWP). The authors would like to thank Samantha P. Ahchay for providing the image on Figure 1, and Dr. Gerry Herrera, Ph.D., for providing critical comments on the manuscript.
Materials
| artificial Cerebrospinal Fluid | |||
| NaCl | Fisher Scientific | S-640 | |
| KCl | Fisher Scientific | P217 | |
| MgCl Anhydrous | Sigma-Aldrich | M-8266 | |
| NaHCO3 | Fisher Scientific | S233 | |
| NaH2PO4 | Sigma-Aldrich | S9638 | |
| D-(+)-Glucose | Sigma-Aldrich | G2870 | |
| CaCl2 | Sigma-Aldrich | C4901 | |
| Bovine Serum Albumin | Sigma-Aldrich | A9647 | |
| Name | Company | Catalog Number | Comments |
| Isolation/ Cannulation | |||
| Stereo Microscope | Olympus | SZX7 | |
| Super Fine Forceps | Fine Science Tools | 11252-00 | |
| Vannas Spring Scissors | Fine Science Tools | 15000-00 | |
| Wiretrol 50 μL | VWR Scientific | 5-000-1050 | |
| 0.2 μm Sterile Syringe Filter | VWR Scientific | 28145-477 | |
| Micropipette Puller | Sutter Instruments | P-97 | |
| Borosilicate Glass O.D.: 1.2 mm, I.D.: 0.68 mm | Sutter Instruments | B120-69-10 | |
| Dark Green Nylon Thread | Living Systems Instrumentation | THR-G | |
| Linear Alignment Single Vessel Chamber | Living Systems Instrumentation | CH-1-LIN | |
| Pressure Servo Controller with Peristaltic Pump | Living Systems Instrumentation | PS-200 | |
| Video Dimension Analyzer | Living Systems Instrumentation | VDA-10 | |
| Four Channel Recorder with LabScribe 3 Recording and Analysis Software | Living Systems Instrumentation | DAQ-IWORX-404 | |
| Heating Unit | Warner Instruments | 64-0102 | |
| Automatic Temperature Controller | Warner Instruments | TC-324B |
Riferimenti
- Dunn, K. M., Nelson, M. T. Neurovascular signaling in the brain and the pathological consequences of hypertension. Am J Physiol Heart Circ Physiol. 306, H1-H14 (2014).
- Iadecola, C. Neurovascular regulation in the normal brain and in Alzheimer’s disease. Nat Rev Neurosci. 5, 347-360 (2004).
- Dabertrand, F., et al. Prostaglandin E2, a postulated astrocyte-derived neurovascular coupling agent, constricts rather than dilates parenchymal arterioles. J Cereb Blood Flow Metab. 33, 479-482 (2013).
- Nishimura, N., Schaffer, C. B., Friedman, B., Lyden, P. D., Kleinfeld, D. Penetrating arterioles are a bottleneck in the perfusion of neocortex. Proc Natl Acad Sci U S A. 104, 365-370 (2007).
- Pires, P. W., Jackson, W. F., Dorrance, A. M. Regulation of myogenic tone and structure of parenchymal arterioles by hypertension and the mineralocorticoid receptor. Am J Physiol Heart Circ Physiol. 309, H127-H136 (2015).
- Longden, T. A., Dabertrand, F., Hill-Eubanks, D. C., Hammack, S. E., Nelson, M. T. Stress-induced glucocorticoid signaling remodels neurovascular coupling through impairment of cerebrovascular inwardly rectifying K+ channel function. Proc Natl Acad Sci U S A. 111, 7462-7467 (2014).
- Dabertrand, F., et al. Potassium channelopathy-like defect underlies early-stage cerebrovascular dysfunction in a genetic model of small vessel disease. Proc Natl Acad Sci U S A. 112, E796-E805 (2015).
- Shih, A. Y., et al. The smallest stroke: occlusion of one penetrating vessel leads to infarction and a cognitive deficit. Nature neuroscience. 16, 55-63 (2013).
- Cipolla, M. J., et al. Increased pressure-induced tone in rat parenchymal arterioles vs. middle cerebral arteries: role of ion channels and calcium sensitivity. Journal of applied physiology. 117, 53-59 (2014).
- Hamel, E. Perivascular nerves and the regulation of cerebrovascular tone. Journal of applied physiology. 100, 1059-1064 (2006).
- Brayden, J. E., Li, Y., Tavares, M. J. Purinergic receptors regulate myogenic tone in cerebral parenchymal arterioles. J Cereb Blood Flow Metab. 33, 293-299 (2013).
- Dabertrand, F., Nelson, M. T., Brayden, J. E. Ryanodine receptors, calcium signaling, and regulation of vascular tone in the cerebral parenchymal microcirculation. Microcirculation. 20, 307-316 (2013).
- Dabertrand, F., Nelson, M. T., Brayden, J. E. Acidosis dilates brain parenchymal arterioles by conversion of calcium waves to sparks to activate BK channels. Circ Res. 110, 285-294 (2012).
- You, J., Johnson, T. D., Marrelli, S. P., Bryan, R. M. Functional heterogeneity of endothelial P2 purinoceptors in the cerebrovascular tree of the rat. Am J Physiol. 277, H893-H900 (1999).
- Nagase, K., Iida, H., Dohi, S. Effects of ketamine on isoflurane- and sevoflurane-induced cerebral vasodilation in rabbits. J Neurosurg Anesthesiol. 15, 98-103 (2003).
- Fisher, C. M. The arterial lesions underlying lacunes. Acta Neuropathol. 12, 1-15 (1968).
- Brown, W. R., Moody, D. M., Thore, C. R., Anstrom, J. A., Challa, V. R. Microvascular changes in the white mater in dementia. J Neurol Sci. 283, 28-31 (2009).
- Pires, P. W., Dams Ramos, C. M., Matin, N., Dorrance, A. M. The effects of hypertension on the cerebral circulation. Am J Physiol Heart Circ Physiol. 304, H1598-H1614 (2013).
- Filosa, J. A., Bonev, A. D., Nelson, M. T. Calcium dynamics in cortical astrocytes and arterioles during neurovascular coupling. Circ Res. 95, e73-e81 (2004).
- Dacey, R. G., Duling, B. R. A study of rat intracerebral arterioles: methods, morphology, and reactivity. Am J Physiol. 243, H598-H606 (1982).
- Coyne, E. F., Ngai, A. C., Meno, J. R., Winn, H. R. Methods for isolation and characterization of intracerebral arterioles in the C57/BL6 wild-type mouse. J Neurosci Methods. 120, 145-153 (2002).
- Cipolla, M. J., Smith, J., Kohlmeyer, M. M., Godfrey, J. A. SKCa and IKCa Channels, myogenic tone, and vasodilator responses in middle cerebral arteries and parenchymal arterioles: effect of ischemia and reperfusion. Stroke. 40, 1451-1457 (2009).

