Characterization of Functionally Associated miRNAs in Glioblastoma and their Engineering into Artificial Clusters for Gene Therapy
Summary
Described here is a protocol for characterizing modules of biologically synergistic miRNAs and their assembly into short transgenes, which allows simultaneous overexpression for gene therapy applications.
Abstract
The biological relevance of microRNAs (miRNAs) in health and disease significantly relies on specific combinations of many simultaneously deregulated miRNAs rather than the action of a single miRNA. The characterization of these specific miRNAs modules is a fundamental step in maximizing their use in therapy. This is extremely relevant because their combinatorial attributes can be practically exploited. Described here is a method to define a specific miRNA signature relevant to the control of oncogenic chromatin repressors in glioblastoma. The approach first defines a general group of miRNAs that are deregulated in tumors in comparison to normal tissue. The analysis is further refined by differential culture conditions, underscoring a subgroup of miRNAs that are co-expressed simultaneously during specific cellular states. Finally, the miRNAs that satisfy these filters are combined into an artificial polycistronic transgenes, which is based on a scaffold of naturally existing miRNA clusters genes, then used for overexpression of these miRNA modules into receiving cells.
Introduction
miRNAs offer an unmatched opportunity for the development of a broad gene therapy approach to many diseases1,2,3, including cancer4,5. This is based on several unique features of these biological molecules, including their small size6, simple biogenesis7, and natural tendency to function in association8. Many diseases are characterized by specific miRNA expression patterns, which often converge on the regulation of complex biological functions9. The purpose of this method is first to define a strategy to identify groups of miRNAs that are synergistically relevant for specific cellular functions. Consequently, it provides a strategy for the re-establishment of such miRNA combinations in downstream studies and applications.
This method allows for functional analysis of multiple miRNAs at once, leveraging on their simultaneous targeting of a large number of mRNAs, thus recapitulating the complex landscapes of diseases. This approach has been recently employed to define a group of three miRNAs that 1) are simultaneously downregulated in brain cancer and 2) show a strong co-expression pattern during neural differentiation as well as in response to genotoxic stress by radiation or a DNA alkylating agent. The combinatorial re-expression of this module of three miRNAs by the clustering method described below results in profound interference with the biology of cancer cells and can be easily used as a gene therapy strategy for preclinical studies10. This protocol may be of particular interest to those involved in miRNA research and its translational applications.
Protocol
1. Characterization of Functionally Associated miRNAs in Glioblastoma
- Analysis of broad differential miRNA expression in glioblastoma vs. brain
- First, determine the most significantly deregulated miRNAs in the tumor. This can be achieved using at least three different methods:
- Mine the Cancer Genome Atlas, found at https://www.cancer.gov/about-nci/organization/ccg/research/structural-genomics/tcga, for sequencing data11.
- Perform microarray analysis from a fresh operative specimen12.
- Use previously published datasets13.
NOTE: Whichever method is chosen, the output provides a bulk set of miRNAs whose expression is statistically correlated (either directly or inversely) with tumor biology. This initial group constitutes the pool of miRNAs that are further analyzed for the identification of a subset of miRNAs displaying the most stringent functional association by performing a more dynamic analysis of expression changes, as discussed below.
- First, determine the most significantly deregulated miRNAs in the tumor. This can be achieved using at least three different methods:
- Condition-specific miRNA expression analysis
- Induction of cell differentiation:
- Use pre-coated poly-D-lysine (PDL) plastic dishes to favor the formation of a monolayer culture. For dish coating, dissolve PDL in water at a concentration of 100 µg/mL. Use 1 mL of solution per 25 cm2 surface. Rinse 2x with PBS 6 h after application of the PDL solution.
- Plate human neural stem cells in equal amounts (100,000 cells/5 mL) either in stem cell medium (neurobasal medium + B27 supplement + 20 ng/mL EGF/FGF), astrocytic differentiation medium (DMEM + 10% FBS), or neuronal differentiation medium (neurobasal medium + B27 supplement, + 2 µM retinoic acid)14. The protocol for oligodendrocyte differentiation requires addition of IGF-1 (200 ng/mL) after EGF/FGF removal14,15.
- After cell plating, place in incubator for 1 week at 37 °C, 5% CO2.
- RNA extraction:
- After 7 days, remove the cells from the incubator and remove the medium.
- Wash the cells with PBS (5 mL). Then, add 1 mL of lysis reagent (see Table of Materials) to lyse the cells and scrape the cells into 1.5 mL microfuge tube using a cell scraper. Keep the tubes containing the lysed cells at room temperature (RT) for 5 min.
- Proceed to total RNA isolation following the manufacturer's instructions.
- miRNA expression analysis:
- Quantify the differential expression of specific miRNAs identified in step 1.1 among the three differentiation patterns by real-time PCR, using TaqMan probes and following the manufacturer's protocols for reverse transcription and PCR amplification (Figure 1).
- Induction of cell differentiation:
- Validation of miRNA clusters by stress-specific challenges
- Culture G34 glioblastoma stem-like cells in neurobasal medium + B27 supplement + 20 ng/mL EGF/FGF. Start with 1 x 10⁶ cells in 5 mL in a 25 cm2 low attachment flask.
- Starting 48 h after plating, add doubling concentrations of DNA alkylating agent temozolomide (TMZ) every 5 days, as follows:
- Start with 5 µM for 5 days. After 5 days, remove the medium and replace with fresh medium without temozolomide, to allow the surviving cells to recover. After 48 h, add 10 µM TMZ and incubate for another 5 days.
- Repeat step 1.3.2.1, doubling TMZ concentration each time, until a concentration of at least 100 µM is reached and cells become resistant to the drug10.
- In a parallel experiment, irradiate G34 cells as follows:
- Starting 48 h after plating 1 x 10⁶ cells in 5 mL in a 25 cm2 low attachment flask, irradiate cells with 2 Gy of energy (any irradiator providing photon emission is acceptable). Return the cells to the incubator and do not disturb. After 48 h, irradiate the cells again with additional 2 Gy of energy.
- Repeat step 1.3.3.1 4x until a total of 10 Gy of energy is administered.
- Return the cells to the incubator and let them recover in fresh medium for at least 5 days before downstream analysis.
- After the induction of resistance, lyse cells using lysis reagent and extract total RNA according to the manufacturer's protocol.
- Analyze the expression of the specific miRNAs identified in sections 1.1-1.2 as described in step 1.2.1 (Figure 2).
- Characterization of the functional convergence of clustered miRNAs
- Obtain the predicted targetome of each miRNAs defined in sections 1.2-1.3 obtained using miRNA targeting prediction tools.
NOTE: We generally resort to TargetScan, as its algorithm is periodically updated16. Additional prediction tools are miRanda17, miRDB18, and DIANA-miRPath19. All these programs are free, web-based applications.- From the front page of Targetscan, select the miRNA of interest from the pre-populated drop-down menu. Click the Soumettre button.
- Download the resulting list of targets as a spreadsheet using the Download table link (Supplementary Figure 1).
- To decrease the chances of false positive predictions, include only targets within the conserved sites column in downstream analyses. Also, further stringency can be obtained by using additional miRNA prediction programs (see above) and only including targets that are common to all algorithms.
- Classify the resulting targetomes according to Gene Ontology categories using ToppGene Suite20 to evaluate for the enrichment of pathways that are common to each miRNA.
- Paste the list of targets obtained from step 1.4.1 in the "Training gene set" window, using HGNC symbol as the entry type. Click Soumettre > Start. The program will provide an output table showing the most significant "Go" categories for the entered list of genes (Supplementary Figure 2).
- To finally establish the contribution of each miRNA to the regulation of a common pathway or cellular process (in this case, chromatin regulation), check each targetome obtained in step 1.4.1 against the full list of genes involved in the specific cellular process (i.e., chromatin regulation), using the Venn diagram function provided in the Bioinformatics and Evolutionary Genomics website http://bioinformatics.psb.ugent.be/webtools/Venn.
NOTE: This program allows the intersection of multiple groups at the same time (Figure 3). The specific unique targets provided by each miRNA are then annotated and selected for downstream functional experiments.- In the front page of the program, upload or copy/paste the list if target mRNAs for each miRNA or interest in the respective windows. Name each list with a unique identifier.
- Click Soumettre. The program will provide a visual output of a Venn diagram with numbers of genes in each sector, as well as a full list of mRNAs for each subset and intersection combinations.
- Obtain the predicted targetome of each miRNAs defined in sections 1.2-1.3 obtained using miRNA targeting prediction tools.
2. Assembly of miRNA Modules into a Polycistronic Transgenic Cluster
- Preparation of transgenic scaffold based on miR-17-92 cluster locus
- Obtain the nucleotide sequence of the miR-17-92 cluster from the Ensembl genome browser21. Select the ~800 base pair "core" sequence encompassing all six encoded miRNA hairpins of the locus and at least 200-nucleotide flanking sequences both upstream (5') and downstream (3') of the core sequence.
- Paste the sequence above into any word editing program.
- Define the sequence of each one of the six native hairpins by retrieving them in miRBase22. Mark each one of these sequences within the span of the previously identified "core" sequence. Any sequences between each hairpin represent spacer sequences, which are important for the correct processing of the transgene.
- Remove the native hairpin sequences from the "core" sequence, with the exception of 3-5 nucleotides at both the 5' and 3' ends of each hairpin, which will serve as an acceptor for the new hairpins.
- Building a new transgene encoding multiple miRNAs of choice
- Obtain hairpin sequences of miRNAs intended to be overexpressed in the transgene from miRBase. Carefully note the specific nucleotides that are the sites of microprocessor cleavage.
- Replace the removed hairpins (step 2.1.4) with the hairpin sequences of the desired miRNAs obtained in step 2.2.1.
- Add desired restriction sequences at both flanking regions of the transgene to facilitate subcloning into delivery vectors of choice. Verify that the chosen restriction sequences are not present within the sequence itself.
- For negative controls, use 20-nucleotide scrambled sequences to replace the natural 20-nucleotide sequence of each mature miRNA. Generate these scrambled sequences using an online tool such as https://genscript.com/tool/create-scrambled-sequence.
- Verifying the two-dimensional structure of the transgene
- Copy the full transgenic sequence into the RNA structure prediction software program RNAweb Fold23.
- Using standard program settings, click Procéder.
- Analyze the graphical output, particularly for the presence of well-defined hairpins and presence of double-stranded stem structures at least 11 nucleotides proximal to the microprocessor cleavage site. Also, look for the absence of branching points within the hairpin sequences (Figure 4).
3. Obtaining Transgenes by DNA Synthesis
- After the design and in silico validation of the chimeric miRNA cluster, obtain the working sequence using DNA synthesis from commercial vendors24 and proceed with downstream cloning into vectors and transgene delivery. We have used lentiviral vectors for in vitro delivery10 and adeno-associated viruses (AAVs) for in vivo intracranial delivery25.
Representative Results
This method allowed characterization of a module of three miRNAs that are consistently downregulated in brain tumors, which are co-expressed specifically during neuronal differentiation (Figure 1) and involved in the tumor survival response after therapy (Figure 2). This is accomplished by regulating a complex oncogenic chromatin repressive pathway. This co-expression pattern suggested a strong synergistic activity among these three miRNAs (Figure 3). Consequently, taking advantage of the small size and simple biogenesis of miRNAs, the second part of this protocol was used to design a transgene (Figure 4) that could simultaneously recapitulate the expression of the three miRNAs in glioblastoma cells, both in vitro and in vivo, with significant interference in tumor biology and promising translational applicability (Figure 5A,B,C)10. Additionally, it was demonstrated that the transgenic cluster is also functional in a breast cancer model (Figure 5D,E).
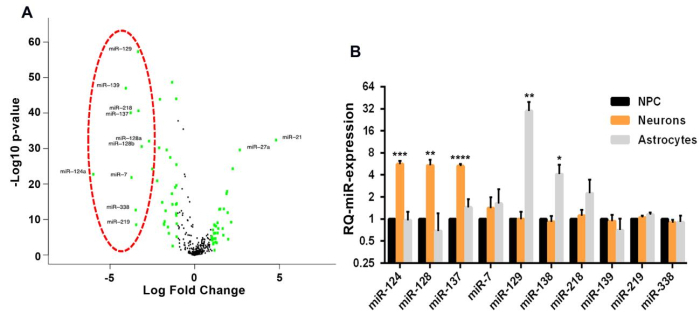
Figure 1: Characterization of a functional miRNA module in glioblastoma. (A) Volcano plot representing the differentially expressed miRNAs in human glioblastoma samples (n = 516) vs. normal brain (n = 10) obtained from TCGA. In green are miRNAs with >4-fold difference. The red circle represents the 10 most significantly downregulated miRNAs in glioblastoma. (B) Relative expression of the 10 miRNAs selected in (A) during induction of different differentiation pathways in neural stem cells, showing clear upregulation of the miR-124, miR-128, and miR-137 modules during induction of neural differentiation. Mean ± SD from three biological replicates (*p < 0.05; **p < 0.01; ***p < 0.001; ****p < 0.0001; Student's t-test, two-tailed). This figure has been modified with permission from reference10. Please click here to view a larger version of this figure.
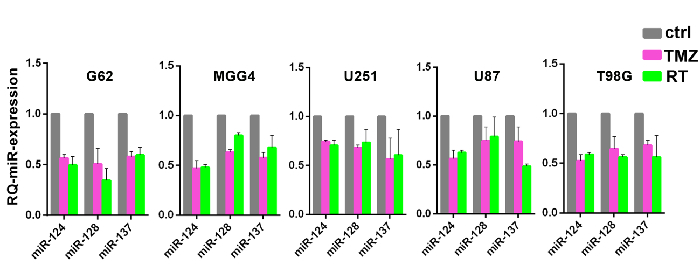
Figure 2: Confirmation of co-expression patterns of miRNA modules during genotoxic stress. Relative expression of the three miRNAs defined in Figure 1 in multiple glioblastoma cells and cell lines (G62-mesenchymal; MGG4-proneural; U251, U87 pro-neural-like, and T98G mesenchymal-like glioblastoma cell lines) after induction of resistance to temozolomide (TMZ, pink bars) or ionizing radiation (RT, green bars). Reported are means with SD from two independent replicates. This figure has been modified with permission from reference10. Please click here to view a larger version of this figure.
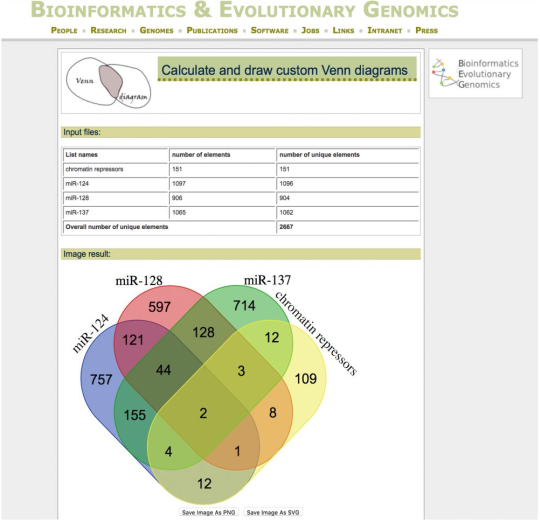
Figure 3: Analysis of functional convergence of the targetomes of co-expressed miRNAs. Venn diagram output from the Bioinformatics and Evolutionary Genomics website, simultaneously crossing the targetome of labelled miRNAs with the mRNAs constituting a GO category of interest (in this case, chromatin repressors). mRNAs uniquely targeted by single miRNAs were chosen for further downstream functional studies. Please click here to view a larger version of this figure.
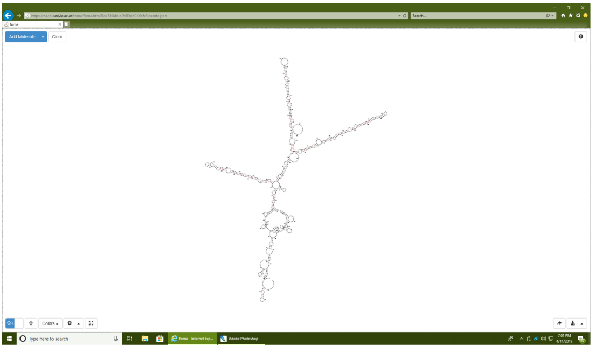
Figure 4: 2D structure of an engineered miRNA sequence encoding the three miRNAs cluster. Graphical output from the RNAweb Fold program. Note the presence of three well defined stem-loop structures which represent the hairpins of each respective miRNA (miR-124, miR-128, miR-137) encoded by the transgene. Please click here to view a larger version of this figure.
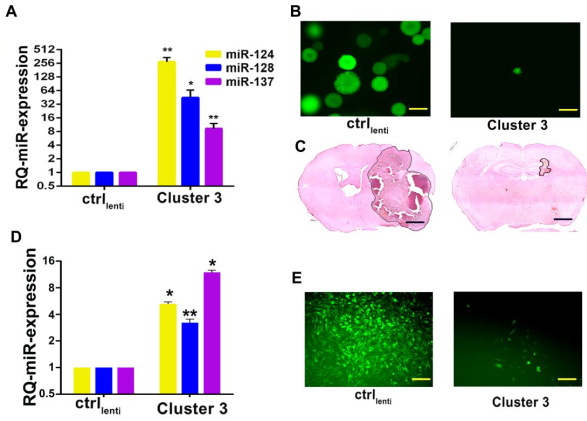
Figure 5: Evidence of transgene processing and its downstream biological effect. (A) Relative quantification of miRNA expression after lentiviral-mediated transduction of G34 glioblastoma cells with the transgenic miRNA cluster (Cluster 3) or negative control (ctrl). Reported are means from three independent experiments ± SD. (B) Fluorescence microscope pictures of G34 glioblastoma spheres expressing negative control transgene vs. Cluster 3 transgene. Scale bar = 100 µm. (C) In vivo growth of intracranial human G34 cell xenografts expressing either control or Cluster 3 transgenes. Scale bar = 1 mm. This figure has been reproduced with permission10. (D) Relative quantification of miRNA expression after lentiviral-mediated transduction of MDA-MB-231 breast cancer cells with the transgenic miRNA cluster (Cluster 3) or negative control (ctrl). (E) Fluorescence microscope images of MDA-MB-231 breast cancer cells expressing negative control transgene vs. Cluster 3 transgene. Scale bar = 100 µm. All experiments were performed in triplicates (*p < 0.05; **p < 0.01; Student's t-test, two-tailed, multiple comparisons). Please click here to view a larger version of this figure.
Supplementary Figure 1: TargetScan workflow. (A) Home page screenshot, showing selection options for miRNA search. (B) Representative search results for miR-137. List of target genes is in the left column. Red box denotes genes with conserved targeting sites (suggesting higher confidence of real targeting). Please click here to view this figure. (Right-click to download.)
Supplementary Figure 2: ToppGene Suite workflow. (A) Home page screenshot showing the search box where the list of genes to be analyzed is inserted. (B) Representative search result for the miR-137 targetome, showing the most statistically significant Gene Ontology (GO) categories. Please click here to view this figure. (Right-click to download.)
Discussion
This protocol is based on the notion that rather than functioning in isolation, miRNAs are biologically relevant by working in groups, and these groups are transcriptionally determined by specific cellular contexts26. To justify this approach from a translational perspective, a follow-up protocol that allows recreation of this multi-miRNA pattern in cells/tissues is introduced. This is possible by taking advantage of the relatively simple biogenesis of miRNAs, whereby the recognition of the characteristic miRNA hairpin by microprocessor is necessary and sufficient for correct miRNA processing27. At the same time, this minimal requirement allows use of the genetic scaffold of naturally occurring miRNA clusters as a backbone for the expression of desired miRNA modules, which are contained within short DNA sequences that can be fitted into any delivery vectors of choice. The major requirement of this protocol is maintaining the hairpin structure and sufficient length of the stem component to allow appropriate cleavage.
There are two major critical considerations regarding the execution of this protocol. The first point is the accurate determination of the optimal miRNA combinations. This is determined by careful analysis of not only the miRNA expression signature of cells or tissues compared to controls, but also of any simultaneous expression changes observed as the cells are experimentally manipulated. Once a set of miRNAs is defined, it is also fundamental to ascertain that the artificial modulation of each singularly does not modify expression of the others.
The second critical aspect concerns the construction of chimeric sequences to artificially recapitulate this functional miRNA clustering. It is fundamental to abide by the structural requirements of the miRNA processing machinery, which is the presence of a long enough stem sequence (measuring at least 11 nucleotides) at the origin of each miRNA hairpin18, as well as maintenance of original spacing sequences of the native miRNA cluster scaffold. In our experience, fulfilling these two requirements has consistently yielded appropriate RNA folding (Figure 4) and resulted in successful multi-miRNA expression.
The major limitation of this technique is the finite number of miRNAs that can be clustered together into a functional transgene. We have successfully engineered sequences overexpressing up to six different miRNAs but observed some decrease in processing efficiency as the number of hairpins increases. So far the genetic structure of the miR-17-92 cluster has been used, because it is the one encoding the highest number of hairpin (six) within the shortest DNA sequence (~800 base pairs)8. As there are other natural miRNA clusters, it is anticipated that they could also be used for this purpose28. Finally, it has been observed that modification of spacing sequences among the hairpin decreases their processing, so there are some constraints regarding to what extent the native structure can be modified.
The most significant and advantageous aspect of this proposed method is that it allows the engineering of transgenes that are able to simultaneously overexpress multiple desired miRNAs mainly using an in silico approach, limiting the need for tedious and time-consuming molecular cloning steps, as previously described29,30,31. The protocol described is easy to execute and does not require specialized equipment or skills.
In consideration of the recognized importance of miRNAs in molecular biology and their potential in therapeutic applications, this protocol is of interest to a large audience of researchers. This approach is expected to encourage future studies that focus on the combinatorial properties of miRNAs and will serve as a simple and robust tool for their execution. More importantly, these clustered transgenes represent ideal cargos for gene therapy vectors. Evidence of successful in vivo delivery of a 3-miRNA cluster has already been obtained via direct intratumoral intracranial injection of AAV vectors (unpublished data). It is thus anticipated that this technique will significantly boost the translational aspects of miRNA research.
Divulgations
The authors have nothing to disclose.
Acknowledgements
The authors wish to thank the members of the Harvey Cushing Neuro Oncology Laboratory for support and constructive criticism. This work was supported by NINDS grants K12NS80223 and K08NS101091 to P. P.
Materials
| 0.4% low melting temperature agarose | IBI Scientific | IB70058 | |
| 0.45 µM sterile filter unit | Merck Millipore | SLH033RS | |
| 1.5-mL Microcentrifuge tube | Eppendorf | 22431081 | |
| 6-Well plates | Greiner Bio-One | 657160 | |
| Athymic mice (FoxN1 nu/nu) | Envigo | 069(nu)/070(nu/+) | |
| B-27 Supplement | Thermo Fisher Scientific | 12587010 | |
| Cell culture flask | Greiner Bio-One | 660175 | |
| Cell Scraper, 16cm | Sarstedt | 83.1832 | |
| Cesium 137 irradiator | JL Sheperd and Associates | Core Facility (Harvard Medical School) | |
| Chloroform | Sigma-Aldrich | 439142-4L | |
| DMEM, high glucose, pyruvate | Thermo Fisher Scientific | 11995040 | |
| Dulbecco’s phosphate-buffered saline | Gibco | 14190144 | |
| Eosin Y solution | Sigma-Aldrich | E4009 | |
| Fetal Bovine Serum | Sigma-Aldrich | F9665 | |
| Formalin solution | Sigma-Aldrich | HT501128 | |
| GlutaMAX Supplement | Thermo Fisher Scientific | 35050061 | |
| HEK-293 | American Type Culture Collecti | ATCC CRL-1573 | |
| Hematoxylin solution | Sigma-Aldrich | 1051750500 | |
| Human primary glioma stem-like cells (GBM62) | Provided by Dr. E. A. Chiocca (Brigham and Women’s Hospital, Boston, MA) | ||
| Human primary glioma stem-like cells (MGG4) | Provided by Dr. Hiroaki Wakimoto (Massachusetts General Hospital, Boston, MA) | ||
| Lentiviral vector pCDH-CMV-MCS-EF1-copGFP | System Biosciences | CD511B-1 | |
| Lipofectamine 2000 | Thermo Fisher Scientific | 11668019 | |
| Microcentrifuge refrigerated | Eppendorf | model no. 5424 R, cat. no.5404000138 | |
| Mounting medium | Thermo Fisher Scientific | 4112APG | |
| Nalgene High-Speed Polycarbonate Round Bottom Centrifuge Tubes | Thermo Fisher Scientific | 3117-0380PK | |
| NanoDrop | Thermo Fisher Scientific | 2000c | |
| Neural Progenitor cells (NPC) | Provided by Dr. Jakub Godlewski (Brigham and Women’s Hospital, Boston, MA) | ||
| Neurobasal Medium | Thermo Fisher Scientific | 21103049 | |
| Nikon eclipse Ti motorized fluorescent microscope system | Nikon, Japan | 14314 | |
| Opti-MEM | Thermo Fisher Scientific | 31985088 | |
| PCR tubes | Sigma-Aldrich | CLS6571-960EA | |
| Penicillin-Streptomycin | Thermo Fisher Scientific | 15140122 | |
| Petri-Dishes 94/16 | Greiner Bio-One | 632180 | |
| Poly-D-Lysine | Sigma- Aldrich | P4707 | |
| Recombinant Human EGF | PeproTech | AF-100-15 | |
| Recombinant Human FGF-basic | PeproTech | AF-100-18B | |
| Retinoic acid | Gibco | 12587-010 | |
| RNA Miniprep Kit | Direct-zol | R2050 | |
| S1000 Thermal Cycler | Bio-Rad | 1852196 | |
| Small Animal Image-Guided Micro Irradiator | Xstrahal Life Sciences, UK | Core facility (Dana-Farber Cancer Institute, Boston, MA) | |
| Sorvall WX+ Ultracentrifuge | Thermo Fisher Scientific | 75000100 | |
| StemPro Accutase | Thermo Fisher Scientific | A1110501 | |
| StepOne Real-Time PCR System | Applied Biosystems | 4376357 | |
| SterilGARD biosafety cabinet | The Baker Company | SG403A-HE | |
| Sucrose | Sigma-Aldrich | S9378 | |
| T98-G | American Type Culture Collecti | ATCC CRL-1690 | |
| TaqMan MicroRNA Reverse Transcription Kit | Thermo Fisher Scientific | 4366596 | |
| TaqMan Universal PCR Master Mix | Thermo Fisher Scientific | 4324018 | |
| Temozolomide | Tocris Bioscience | 2706 | |
| Tissue-Tek optimum cutting temperature | Fisher Scientific | NC9636948 | |
| TRIzol Reagent | Thermo Fisher Scientific | 15596026 | Lysis reagent |
| U251-MG | American Type Culture Collecti | ATCC HTB-17 | |
| U87-MG | American Type Culture Collecti | ATCC HTB-14 | |
| ViraPower Lentivector Expression system | Thermo Fisher Scientific | K4970-00 | |
| Water, HPLC grade | Fisher | W54 | |
| Xylene | Sigma-Aldrich | 534056 |
References
- Wu, Y. E., Parikshak, N. N., Belgard, T. G., Geschwind, D. H. Genome-wide, integrative analysis implicates miRNA dysregulation in autism spectrum disorder. Nature Neuroscience. 19, 1463-1476 (2016).
- Esteller, M. Non-coding RNAs in human disease. Nature Reviews Genetics. 12, 861-874 (2011).
- Moradifard, S., Hoseinbeyki, M., Ganji, S. M., Minuchehr, Z. Analysis of miRNA and Gene Expression Profiles in Alzheimer’s Disease: A Meta-Analysis Approach. Scientific Reports. 8, 4767 (2018).
- Calin, G. A., et al. Frequent deletions and down-regulation of micro- RNA genes miR15 and miR16 at 13q14 in chronic lymphocytic leukemia. Proceedings of the National Academy of Sciencesof the United States of America. 99, 15524-15529 (2002).
- Croce, C. M. Causes and consequences of miRNA dysregulation in cancer. Nature Reviews Genetics. 10, 704-714 (2009).
- Ambros, V. miRNAs: tiny regulators with great potential. Cell. 107, 823-826 (2001).
- Treiber, T., Treiber, N., Meister, G. Regulation of miRNA biogenesis and its crosstalk with other cellular pathways. Nature Reviews Molecular Cell Biology. 20, 5-20 (2019).
- He, L., et al. A miRNA polycistron as a potential human oncogene. Nature. 435, 828-833 (2005).
- Santos, M. C., et al. miR-124, −128, and −137 orchestrate neural differentiation by acting on overlapping gene sets containing a highly connected transcription factor network. Stem Cells. 34, 220-232 (2016).
- Bhaskaran, V., et al. The functional synergism of miRNA clustering provides therapeutically relevant epigenetic interference in glioblastoma. Nature Communications. 10 (1), 442 (2019).
- Kim, T. M., Huang, W., Park, R., Park, P. J., Johnson, M. D. A developmental taxonomy of glioblastoma defined and maintained by MiRNAs. Recherche en cancérologie. 71 (9), 3387-3399 (2011).
- Dell’Aversana, C., Giorgio, C., Altucci, L. MiRNA Expression Profiling Using Agilent One-Color Microarray. Methods in Molecular Biology. 1509, 169-183 (2017).
- Silber, J., et al. miR-124 and miR-137 inhibit proliferation of glioblastoma multiforme cells and induce differentiation of brain tumor stem cells. BMC Medicine. 6 (14), (2008).
- Hester, M. E., et al. Two factor reprogramming of human neural stem cells into pluripotency. PLoS ONE. 4 (9), e7044 (2009).
- Hsieh, J., et al. IGF-I instructs multipotent adult neural progenitor cells to become oligodendrocytes. Journal of Cell Biology. 164 (1), 111-122 (2004).
- Agarwal, V., Bell, G. W., Nam, J., Bartel, D. P. Predicting effective miRNA target sites in mammalian mRNAs. eLife. 4, e05005 (2015).
- Betel, D., Wilson, M., Gabow, A., Marks, D. S., Sander, C. The miRNA.org resource: targets and expression. Nucleic Acids Research. 36, D149-D153 (2008).
- Wong, N., Wang, X. miRD(B) an online resource for miRNA target prediction and functional annotations. Nucleic Acids Research. 43 (D1), D146-D152 (2015).
- Vlachos, I. S., et al. DIANA-miRPath v3.0: deciphering miRNA function with experimental support. Nucleic Acids Research. 43 (W1), W460-W466 (2015).
- Chen, J., Bardes, E. E., Aronow, B. J., Jegga, A. G. ToppGene Suite for gene list enrichment analysis and candidate gene prioritization. Nucleic Acids Research. 305, W305-W311 (2009).
- Aken, B. L., et al. Ensembl 2017. Nucleic Acids Research. 45, D635-D642 (2017).
- Kozomara, A., Birgaoanu, M., Griffiths-Jones, S. miRBase: from miRNA sequences to function. Nucleic Acid Research. 47, D155-D162 (2019).
- Lorenz, R., et al. Vienna RNA Package 2.0. Algorithms for Molecular Biology. 6 (1), 26 (2011).
- Hughes, R. A., Ellington, A. D. Synthetic DNA synthesis and assembly: Putting the synthetic in synthetic biology. Cold Spring Harbor Perspectives in Biology. 9 (1), a023812 (2017).
- Crommentuijn, M. H., et al. Intracranial AAV-sTRAIL combined with lanatoside C prolongs survival in an orthotopic xenograft mouse model of invasive glioblastoma. Molecular Oncology. 10 (4), 625-634 (2016).
- Ivey, K. N., Srivastava, D. MiRNAs as regulators of differentiation and cell fate decisions. Cell Stem Cell. 7, 36-41 (2010).
- Han, J., et al. Molecular Basis for the Recognition of Primary miRNAs by the Drosha-DGCR8 Complex. Cell. 125, 887-901 (2006).
- Barroso-del Jesus, A., Lucena-Aguilar, G., Menendez, P. The miR-302-367 cluster as a potential stemness regulator in ESCs. Cell Cycle. 8, 394-398 (2009).
- Liu, Y. P., Haasnoot, J., Brake, O., Berkhout, B., Konstantinova, P. Inhibition of HIV-1 by multiple shRNAs expressed from a single miRNA polycistron. Nucleic Acid Research. 36, 2811-2824 (2008).
- Chen, S. C., Stern, P., Guo, Z., Chen, J. Expression of Multiple Artificial MiRNAs from a Chicken miRNA126-Based Lentiviral Vector. PLoS ONE. 6 (7), e22437 (2011).
- Yang, X., Marcucci, K., Anguela, X., Couto, L. B. Preclinical Evaluation of An Anti-HCV miRNA Cluster for Treatment of HCV Infection. Molecular Therapy. 21, 588-601 (2013).

