Profiling Thiol Redox Proteome Using Isotope Tagging Mass Spectrometry
Summary
Reactive oxygen species level is elevated when cells encounter stress conditions. Here we show the example of 3′-3′ diaminobenzidine staining as well as cysTMT labeling and mass spectrometry to profile the redox proteome in Pseudomonas syringae treated tomato leaves.
Abstract
Pseudomonas syringae pv. tomato strain DC3000 not only causes bacterial speck disease in Solanum lycopersicum but also on Brassica species, as well as on Arabidopsis thaliana, a genetically tractable host plant1,2. The accumulation of reactive oxygen species (ROS) in cotyledons inoculated with DC3000 indicates a role of ROS in modulating necrotic cell death during bacterial speck disease of tomato3. Hydrogen peroxide, a component of ROS, is produced after inoculation of tomato plants with Pseudomonas3. Hydrogen peroxide can be detected using a histochemical stain 3′-3′ diaminobenzidine (DAB)4. DAB staining reacts with hydrogen peroxide to produce a brown stain on the leaf tissue4. ROS has a regulatory role of the cellular redox environment, which can change the redox status of certain proteins5. Cysteine is an important amino acid sensitive to redox changes. Under mild oxidation, reversible oxidation of cysteine sulfhydryl groups serves as redox sensors and signal transducers that regulate a variety of physiological processes6,7. Tandem mass tag (TMT) reagents enable concurrent identification and multiplexed quantitation of proteins in different samples using tandem mass spectrometry8,9. The cysteine-reactive TMT (cysTMT) reagents enable selective labeling and relative quantitation of cysteine-containing peptides from up to six biological samples. Each isobaric cysTMT tag has the same nominal parent mass and is composed of a sulfhydryl-reactive group, a MS-neutral spacer arm and an MS/MS reporter10. After labeling, the samples were subject to protease digestion. The cysteine-labeled peptides were enriched using a resin containing anti-TMT antibody. During MS/MS analysis, a series of reporter ions (i.e., 126-131 Da) emerge in the low mass region, providing information on relative quantitation. The workflow is effective for reducing sample complexity, improving dynamic range and studying cysteine modifications. Here we present redox proteomic analysis of the Pst DC3000 treated tomato (Rio Grande) leaves using cysTMT technology. This high-throughput method has the potential to be applied to studying other redox-regulated physiological processes.
Protocol
1. Growing Seedlings and Preparing Bacteria
- Seedlings are germinated in MetroMix 500 soil mixture (BWI Companies) in a growth chamber (160 μmol photons m-2s-1 with a photoperiod of 8 hour light at 22 °C and 16 hour dark at 20 °C for 1 week. Relative humidity was set to 70%. Seedlings were watered with tap water as needed to keep the soil from becoming dry.
- Two seedlings of similar size are then transplanted to 4″ diameter pots containing the MetroMix 500 soil and grown for an additional 3 weeks in the same conditions as 1.1.
- Pseudomonas syringae (Pst) is initially T-streaked onto Kings B Medium (KBM) plates (per liter: 20 g Proteose Peptone, 0.1975 g MgSO4, 1% Glycerol, 1.5 g K2HPO4, 18 g Agar) and grown for two days at 28 °C. A single colony is collected, mixed into 300μl liquid Kings B Medium (20 g Proteose peptone, 0.1975 g MgSO4, 10 mL Glycerol, 10 mL of 100x K2HPO4 stock (1.5 g of K2HPO4 in 10 mL of H2O ), and spread onto a Kings B Medium plate. This is cultured over night at 28 °C.
- The bacteria inoculum is prepared by scraping the cultured bacteria from the KBM plate into 20 mL H2O. An OD600 of 0.03 (~106 cfu/ml) is prepared in 1 L of inoculation buffer (10 mM MgCl2 + 400 μL Silwett-70). Inoculation buffer minus bacteria was prepared for the control solution.
2. Inoculation of Tomato with Pst and H2O2 Histochemical Stain
- Four week old plants were inoculated by dipping into the above inoculation solution for 30 seconds. Clear plastic bags were put over the plants immediately after inoculation.
- 3′-3′ diaminobenzidine (DAB) stain11 was prepared (1 mg/ml DAB in H2O, pH 3.8 (HCl)) three days before use to achieve complete solubilization. The solution was rocked to mix at room temperature.
- Twenty four hours after treatment, the fully expanded leaf was removed, placed in DAB stain epidermal side up, and vacuum infiltrated for 15 min. The leaves were then put in the dark at room temperature over night for staining.
- Leaves were boiled in 95% ethanol for 10 min, and then kept in 75% ethanol.
3. Protein Extraction
- After harvesting, tomato leaves were ground to fine powder with liquid nitrogen using mortar and pestle.
- For 0.5 g of tissue, add 1.25 mL Tris pH 8.8 buffered phenol and 1.25 mL / 0.5 g of extraction buffer (0.1 M Tris-HCl pH 8.8, 10 mM EDTA, 0.9 M sucrose) then continue grinding for a few more min in a fume hood.
- Transfer the extract to Oakridge centrifuge tube (Thermo Fisher Scientific Nalgene Company) and agitate for 2 hrs at room temperature.
- Centrifuge at 5,000x g and 15 °C for 10 min. Transfer the top phenol phase to a new clean tube.
- Back-extract the aqueous phase with equal volume extracted phenol buffer; agitate on a shaker for 30 min. Centrifuge and transfer the extract to a new Falcon tube.
- Repeat the above step one more time and transfer the extract to new Oakridge tube.
- Precipitate phenol extracted proteins by adding 5 volumes of 0.1 M ammonium acetate in 100% methanol (stored at -20 °C). Vortex and incubate at -20 °C for overnight.
- Collect the protein pellet by centrifugation at 20,000x g, 4 °C for 20 min .
- Wash the pellet 2 times with the cold 0.1M ammonium acetate in methanol and 2 times with 80% cold acetone. Add 1.5 mL cold 70% ethanol to pellet and suspend. Transfer to a 2 mL microcentrifuge tube (USA Scientific)and centrifuge at 14,000 rpm, 4 °C for 20 min. Remove ethanol.
- Dry the pellet briefly in a SpeedVac concentrator and dissolve in a protein extraction buffer, e.g. ReadyPrep Protein Extraction Kit Reagent 3 (8 M Urea, 4% CHAPS, 40 mM Tris-base, 2 M Thiourea) (Bio-Rad). Centrifuge at 14,000 rpm and 20 °C for 30 min to form a pellet. Collect the supernatant.
- Measure the protein concentration using a CB-X protein assay according to manufacturer’s manual (Geno Technology).
4. Sample Preparation and Peptide Labeling with cysTMTs
- Prepare protein sample at a concentration of 2-5 μg/μL. Here we use 100 μg of protein for each mass tag, 20 μl-50 μL samples. For this experiment all 6 tags were used.
- Add equal volume of alkylation buffer (100 mM Tris-HCl pH7.5, 200 mM iodoacetamide) to the protein sample to block the free thiol group. Buffer should be prepared fresh. Alkylation is performed at 37 °C for 1 hour.
- Precipitate the protein by adding 1 mL of cold 80% acetone at -20°C for overnight. Pellet the protein by centrifuging at 14,000 rpm, 4 °C for 20 min. Wash the pellet 3 times with 80% Acetone vortexing each time. Remove the supernatant and allow to air dry while on ice.
- Resuspend the pellet in 50 μL lysis buffer (6 M Urea, 50 mM Tris base, 1 mM EDTA). 0.5 μL of 100 mM Tris(2-Carboxyethyl) Phosphine (TCEP) is then added to reduce the disulfide bonds by incubating for one hour at room temperature.
- Prepare tags by adding 20 μL of acetonitrile to the reagent tubes to solubilize the tags. Vortex and spin down to the bottom.
- Wash out extra TCEP using a Microcon 3KD centrifugal filter device (Millipore). Add 50 μL sample to Microcon 3KD column, and 50 μL lysis buffer to the column. Centrifuge for 15 min at 10,000x g and 4 °C. Repeat this step for a total of three times. Remove column and invert into a clean tube. Centrifuge for 5 min at 1,000x g and 4 °C.
- Check the pH. If needed, adjust the pH to 7.0-8.0 with 1 M HCl.
- Add 5 μL of the cysTMT reagent to each sample (The cysTMT reagent kit provides 20 μL tags for up to 500 μg protein. This method uses 100 μg protein, therefore we use one-fifth of the tag.) . Allow the reaction to proceed for 2 hr at room temperature.
- Samples were combined with Laemmli Sample Buffer (Bio-Rad) in a 1:1 ratio.
5. Removal of Non-reacted Tag Sample Fractionation
- Samples were boiled for 5 min and separated on a pre-cast 12% polyacrylamide gel (Bio-Rad). The gel was rinsed three times in 5 minute intervals with filtered H2O and stained with Coomassie Blue (Bio-Rad) for 1 hour. The gel was de-stained overnight with H2O.
- Twelve fractions were collected from each gel lane. Fractions were determined by protein band concentrations. Fractions were chopped into 1mm pieces and collected into a 1.5 mL tube.
- Gel pieces were de-stained using 50% acetonitrile and 0.1 M ammonium bicarbonate in H2O. This step must be repeated until blue color is removed from gel pieces (~3-4 times, 15 min each time).
- De-stained gel pieces were dried using 100% acetonitrile (cover gel pieces) for 15 min, supernatant removed, and the pieces dried using a SpeedVac.
- Dissolve trypsin (Promega) at 1:10 (trypsin: protein) ratio in the same volume (as pooled labeled sample) of 25 mM ammonium bicarbonate. For example, 600 μg protein sample with a volume of 500 μL needs 60 μg trypsin dissolved in 500 μL of 25 mM ammonium bicarbonate.
- Add the trypsin solution to the gel pieces and set on ice to rehydrate. If pieces are not covered add 50 mM ammonium bicarbonate buffer. After rehydration, incubate at 37 °C for 12-16 hr.
- Remove the liquid protein extract from the incubated samples.
- Stop the reaction and remove any remaining protein digest by covering gel pieces with 5% formic acid, 50% acetonitrile.. Shake gel pieces for 20 min at room temperature. Transfer the supernatant to the extracted protein sample tubes from 5.7. Repeat the extraction procedure twice. Dry the extracted peptides using the SpeedVac.
6. Sample Enrichment of cysTMT Labeled-peptides
- Add a gradient of anti-TMT resin to 0.5 mL tubes for a 50% slurry. (Gradient was determined from band concentration in fractionation gel. If a fraction collection consists of a dark band, more resin is needed. Fractions with weaker bands require less resin as there is less protein.)
- The resin is then washed three times with one column volume of 1x Tris-buffered saline (TBS) (25 mM Tris, 0.15 M NaCl, pH 7.2) (Thermo Scientific Pierce Protein Research Products).
- Add 200 μL 1xTBS to each sample. Samples are then added to anti-TMT resin (Thermo Scientific Pierce Protein Research Products) and agitated at room temperature for 2 hr followed by rocking overnight at 4 °C.
- Add sample to column (Thermo Scientific Pierce Protein Research Products).
- Wash each column three times with 1x 200 μL TBS. This is then followed with washing three times with 0.05% CHAPs (dissolved in 1x TBS).
- The column is then washed three times with 4 M urea in 1x TBS. Two hundred microliters of H2O is then used to wash the column three times.
- Each sample is eluted three times with 200 μL 50% elution buffer (50% acetonitrile, 0.4% TFA).
- Samples are then dried in a vacuum concentrator.
7. Mass Spectrometry Analysis
- Resuspend the samples in 12 μL of 3% acetonitrile with 0.1% formic acid and inject 5 μL directly onto an Eksigent NanoLC-1D high pressure liquid chromatography column (AB SCIEX, USA).
- Peptides will be separated on a Proteopep II C18 column 75 μm ID x 20 cm (New Objective, USA) using a 4-60% gradient (A: 3% acetonitrile, 0.1% formic acid; B: 97% acetonitrile, 0.1% formic acid) at 3 μL/min over 60 min.
- A Thermo Scientific LTQ Orbitrap XL mass spectrometer was used to detect peptides using a top 2 x 3 experiment consisting of single stage MS followed by acquisition of 3 MS/MS spectra with higher-energy C-trap dissociation (HCD) fragmentation followed by 3 MS/MS with collision induced dissociation (CID) for protein identification. Parameters in this mode were: Isolation width: 3.0 m/z; Collision energy: 50% (10% with two steps). Only doubly- and triply-charged peptides were selected for fragmentation. Dynamic exclusion parameters were set to: Repeat count = 1; Repeat Duration = 60; Exclusion list size = 500; Exclusion duration = 28. Target values are as follows: MS = 5 e5; MS/MS (HCD) = 1 e5. Ion transfer times were set to 500 for FTMS and 300 for MS/MS (HCD). Two microscans were required for HCD spectra.
8. Database Searching and Quantitation
- The acquired CID and HCD data were analyzed using Thermo Scientific Proteome Discoverer software 1.2 (Thermo Scientific Pierce Protein Research Products) through a branched workflow which implemented a Reporter Ion Quantizer (20 ppm mass tolerance of fragment ions) to quantify the ratio. A separate segment processed the MS2 spectra through the Spectrum Selector, Spectrum Normalizer, and Spectrum Grouper nodes.
- Data were then searched against the SEQUEST search engine. A 20 ppm mass tolerance was used. Static modifications were set to the cysTMT reagent (304.18 Da) and dynamic modifications included phosphorylation and methionine oxidation (15.99 Da). A custom database for Solanum lycopersicum was composed using RNA data (with about 350,000 entries from Harvard University)13 was used in both cases.
9. Representative Results
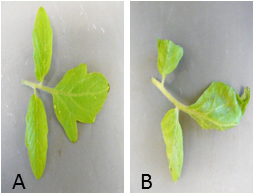
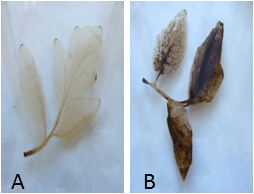
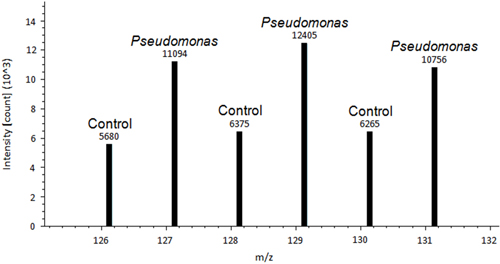
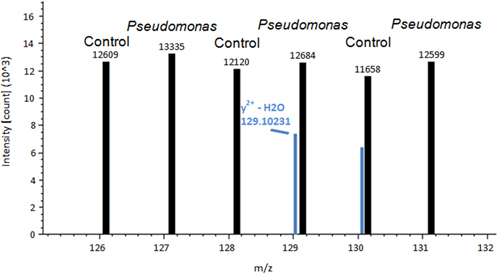
A representative image of a control tomato plant leaf and a Pseudomonas inoculated leaf is shown in Figure 1. A difference between control treated and Pseudomonas treated leaves is observed. After the leaves are removed and stained using DAB, the de-staining process allows for the histochemical stain to show signs of ROS in the leaf tissue (Figure 2). Figure 2A is representative of a control leaf with no staining. Figure 2B is representative of a leaf treated with Pseudomonas and positive staining for H2O2 production. An example of Proteome Discover data output of a differentially redox regulated protein is shown in Figure 3. This protein is a known redox regulated protein ferredoxin-114 and has been shown to play a role in defense against Pseudomonas syringae pv tomato15. Peak intensity between control and inoculated samples is used to obtain relative quantification, which showed significant changes in ferredoxin-1 redox regulation (p< 0.05). High intensity peaks suggest that this protein is oxidized in response to the pathogen treatment. Figure 4 is an example of Proteome Discover data output of a protein that has similar redox regulation of a protein between a control and inoculated sample. Peaks of similar intensity suggest the presence of disulfide bonds not regulated by a change in treatment. The method will revolutionize how scientists detect redox responsive cysteines and disulfides10.

Figure 1. A representative image of inoculated tomato leaves with control solution (A) and Pseudomonas (B).

Figure 2. A representative image of DAB staining of inoculated tomato leaves with control solution (A) and Pseudomonas (B). Leaves were stained using 3′-3′ diaminobenzidine. Chlorophyll was removed from leaves by boiling in 95% ethanol. Dark staining indicates the presence of H2O2. Only leaves inoculated with bacteria culture showed dark staining.

Figure 3. An example of Proteome Discover data output of ferredoxin-1, differentially redox regulated protein14. Peak intensity above each peak is used for absolute quantification. Peak intensity between control and inoculated samples is used to perform relative quantification.

Figure 4. An example of Proteome Discover data output of a protein that has similar peak intensity between a control and inoculated sample. Peaks of similar intensity suggest the presence of disulfide bonds not regulated by a change in treatment.
Discussion
This protocol provides information on performing DAB staining as well as cysTMT labeled redox cysteine quantification. These procedures are beneficial in examining production of ROS as well as the effect on protein regulation when Solanum lycopersicum is inoculated with Pseudomonas syringae. The methods presented in this protocol provide a way to examine ROS in whole leaf samples in a way that causes the least amount of damage to leaf tissue. The labeling procedure provides a way to examine potentially redox regulated proteins by utilizing a cysteine labeling method. This is beneficial when examining an early stage of stress response.
Methods such as isotope-coded affinity tag (ICAT) and cysTMT can be used in examining potential redox regulated proteins in biological samples. ICAT allows labeling and comparison of two samples12. Both methods label free cysteines and can be used for protein quantification10,12. However, the cysTMT method allows for a decrease in experimental variation as well as multiplexing10. The number of tags available allows researchers to include replicates or multiple samples in their experimental design. Having more samples provides the potential for a higher number of proteins identified. A major disadvantage of the cysTMT technique is that it compromises the overall quality of protein identification because of the selective enrichment steps for cysTMT labeled-peptides (6.5-6.6). The number of peptides for the protein identification depends largely on the number of cysteine residues in the protein sequence. This problem can be overcome by submitting part of the tryptic sample before enrichment for mass spectrometry protein identification.
Due to the nature of the experimental design as well as the labeling mechanism that the cysTMT method utilizes, certain steps are critical. While performing protein precipitation and pellet washings (3.9) it is important to keep samples chilled on ice to reduce protein degradation. During cysTMT labeling, removal of the reducing reagent (4.6) is important because samples may undergo reverse labeling. Reverse labeling is possible if reducing reagent remains in the sample. If samples are reduced after labeling, the cysTMT tag can be removed. Once the labels are added to the samples, the pH level must be checked (4.7) in order to have optimal labeling efficiency. In addition, data analysis is dependent on what is required of the researcher and the ultimate goal in using the protocol. It is also dependent on the software being used as each software has different algorithms.
This experiment utilizes pathogen as an elicitor for enhanced production of reactive oxidative species in tomato; however, other redox regulated responses may be measured accordingly. This experimental design is adaptable to other plant and animal systems.
Offenlegungen
The authors have nothing to disclose.
Acknowledgements
The authors would like to thank Dr. Greg Martin (Cornell University) and his group for providing the DC3000 strain, tomato seeds, and advice. They would also like to thank Dr. Zhonglin Mou for help with the DAB protocol and the Proteomics Division at UF Interdisciplinary Center for Biotechnology Research for assistance in the method development. The protocol for protein extraction was modified from Hurkman and Tanaka16. The protocol on cysTMT labeling, steps 4 to 6 was adapted based on the original Thermo Pierce Fisher Scientific product manual17. This work was funded by National Science Foundation (MCB 0818051 to S Chen).
Materials
| Name of the reagent | Company | Catalogue number |
| MetroMix 500 | BWI Companies | TX-500 |
| 3,3′-Diaminobenzidine | Sigma-Aldrich | D8001 |
| ReadyPrep Sequential Extraction kit Reagent 3 | Bio-Rad | 163-2104 |
| CB-X protein assay | Geno Technology | 786-12x |
| cysTMT reagents | Thermo Scientific Pierce Protein Research Products | 90071 |
| Laemmli Sample Buffer | Bio-Rad | 161-0737 |
| Bio-Safe Comassie (G-250 stain) | Bio-Rad | 161-0786 |
| Microcon 3KD column | Millipore | 42403 |
| Immobilized Anti-TMT resin | Thermo Scientific Pierce Protein Research Products | 90076 |
| Centrifuge column | Thermo Scientific Pierce Protein Research Products | 89896 |
| Proteopep II C18 column | New Objective | PFC7515-PP2-10 |
| NanoLC-1D HPLC | AB Sciex | 90389 |
| LTQ Orbitrap XL | Thermo Scientific | 0020137580 |
| SpeedVac | Labconco | 7812013 |
| Proteome Discoverer 1.2 software | Thermo Scientific Pierce Protein Research Products | |
| Trypsin | Promega | V5111 |
| Oakridge Centrifuge Tube | Thermo Scientific Nalgene Company | 3139-0050 |
| Microcentrifuge tube (2ml) | USA Scientific | 1620-2700 |
| 12% Mini-PROTEAN TGX Precast Gel | Bio-Rad | 456-1043 |
| Top of Form >Bio-Safe Coomassie StainBottom of Form |
Bio-Rad | 161-0786 |
| TMT enrichment kit | Thermo Scientific Pierce Protein Research Products | 90077 |
Referenzen
- Almeida, N. F. A draft genome sequence of Pseudomonas syringae pv. tomato T1 reveals a type III effector repertoire significantly divergent from that of Pseudomonas syringae pv. tomato DC3000. Mol. Plant Microbe Interact. 22, 52-62 (2009).
- Preiter, K. Novel virulence gene of Pseudomonas syringae pv. tomato strain DC3000. J. Bacteriol. 187, 7805-7814 (2005).
- Apostol, I., Heinstein, P. F., Low, P. S. Rapid stimulation of an oxidative burst during elicitation of cultured plant cells: role in defense and signal transduction. Plant Physiol. 90, 109-116 (1989).
- Orozco-Cardenas, M., Ryan, C. A. Hydrogen peroxide is generated systemically in plant leaves by wounding and systemin via the octadecanoid pathway. Proc. Natl. Acad. Sci. U.S.A. 96, 6553-6557 (1999).
- Tonks, N. K. Redox redux: revisiting PTPs and the control of cell signaling. Cell. 121, 667-670 (2005).
- Alvarez, S., Wilson, G. H., Chen, S. Determination of in vivo disulfide-bonded proteins in Arabidopsis. J. Chromatogr. B. 877, 101-104 (2009).
- Apel, K., Hirt, H. Reactive oxygen species: metabolism, oxidative stress, and signal transduction. Annu. Rev. Plant Biol. 55, 373-399 (2004).
- Dayon, L. Relative quantification of proteins in human cerebrospinal fluids by MS/MS using 6- plex isobaric tags. Anal. Chem. 80, 2921-2931 (2008).
- Thompson, A. Tandem mass tags: a novel quantification strategy for comparative analysis of complex protein mixtures by MS/MS. Anal. Chem. 75, 1895-1904 (2003).
- Rosenblatt, M. A novel cysteine-reactive tandem mass tag reagent for subproteome labeling, enrichment and quantitation. , TP169 (2010).
- Clark, J. Phenotypic analysis of Arabidopsis mutants: diaminobenzidine stain for hydrogen peroxide. Cold Spring Harb. Protoc. , (2009).
- Sethuraman, M. Isotope-Coded affinity tag (ICAT) approach to redox proteomics: identification and quantification of oxidant-sensitive cysteine thiols in complex protein mixtures. J. Proteome Res. 3, 1228-1233 (2004).
- Asso, M. EPR and redox characterization of ferredoxins I and II from Desulfovibrio vulgaris Miyazaki. Biochem. Biophys. Res. Commun. 211, 198-204 (1995).
- Huang, H. e. Disease resistance to bacterial pathogens affected by the amount of ferredoxin-I proteins in plants. Mol. Plant Pathol. 8, 129-137 (2007).
- Hurkman, W., Tanaka, C. Solubilization of plant membrane proteins for analysis by two-dimensional gel electrophoresis. Plant Physiol. 81, 802-806 (1986).

