קביעת חלבונים פוטומטריים
English
Paylaş
Genel Bakış
מדידת הריכוז היא צעד בסיסי של מעש ביוכימי רבים. קביעת חלבונים פוטומטריים מנצלת את העובדה שכ ככל שדגימה מכילה יותר חומרים סופגי אור, כך האור ישדר דרכה פחות. מאז הקשר בין ריכוז וספיגה הוא ליניארי, תופעה זו יכולה לשמש כדי למדוד את הריכוז בדגימות שבו הוא לא ידוע.
סרטון זה מתאר את היסודות של קביעת חלבונים פוטומטריים ומציג את ברדפורד אסאי ואת שיטת לאורי. ההליך בסרטון יכסה מראייה טיפוסית של ברדפורד. היישומים המכוסים כוללים מדידה ישירה של כמויות קטנות מאוד של חומצות גרעין כדי לאפיין ריכוז וטוהר, קביעת יעילות צימוד של חומר ביו-מימטי, וריאציה נוספת של קביעת חלבון פוטומטרי באמצעות צבע Remazol.
קביעת הריכוז של חלבון בדגימות היא צעד בסיסי בבחונים ביוכימיים רבים. קביעה פוטומטרית יכולה להיעשות עם גדלי מדגם קטנים. ככל שדגימה מכילה יותר חומרים סופגי אור, כך האור ישדר דרכה פחות. זה מספק מדידה כמותית של החומרים סופגים. מושגים אלה הם כל כך בסיסיים למדע כי המאמרים שהציג שתיים מהטכניקות הם בשלושת המאמרים המצוטטים ביותר בכל הזמנים. סרטון זה יציג את המושגים שמאחורי כמה מהטכניקות הנפוצות ביותר לקביעת חלבונים פוטומטריים, כיצד הם מבוצעים וכיצד מנתחים את הנתונים שנאספו.
קביעת חלבונים פוטומטריים מבוססת על הקשר בין ריכוז לספיגת אור. זה ידוע בשם חוק באר-למברט, הקובע כי ריכוז של מין סופג אור הוא פרופורציונלי לספיגתו.
עיקרון זה עומד בבסיס כל שיטות קביעת החלבון הפוטומטרי.
לניתוח ספיגה ישיר, נמדדים ערכי הספיגה של דגימות חלבון ללא טעם. בגלל שרשראות הצד הארומטיות שלהם, שאריות טריפטופן ו טירוזין נותנות את קריאות הספיגה הגבוהות ביותר אורך גל של 280 ננומטר.
עם זאת, חומצות אמינו אלה – שהן שתיים מהפחות שכיחות שנמצאות בחלבונים – נמצאות בכמויות שונות בכל חלבון, כך שכל קביעה היא ייחודית. כדי להתגבר על מגבלה זו, פותחו בוצעו מעשים מורכבים יותר שאינם תלויים בחומצות אמינו אלה.
דוגמה אחת היא ברדפורד אסאי, שבו צבע צבעוני מתווסף לדגימה. הצבע, המכונה Coomassie כחול, מגיב באופן יחסי – יותר חלבון נוכח, אירועים מחייבים יותר עם הצבע.
לאחר מכן, ריכוז החלבון נקבע על ידי מדידת הספיגה של הצבע הכחול הקומאסי הכבול, אשר סופג אור ב 594 ננומטר. עם זאת, הבדיקה ברדפורד היא ליניארית על פני טווח קצר של ריכוזים, ולכן דילול נדרשים לעתים קרובות לפני הניתוח.
שיטת לאורי משלבת את ריאגנט ביורט, פתרון אלקליין של יונים מנחושת המגיבים עם קשרים פפטידים, ואת ריאגנט פולין-Ciocâlteu, אשר מחמצן שאריות חלבון ארומטי. שינוי הצבע המתקבל של המדגם הוא פרופורציונלי לריכוז החלבון.
הספיגה של ריאגנט פולין מופחת ניתן לקבוע ב 750 ננומטר. כמו ספיגה ישירה, לכל חלבון יש תגובה ייחודית, ויש לכייל אותו לחלבון מעניין. עכשיו שבדקנו את העקרונות הבסיסיים מאחורי כמה מההבחנות הנפוצות ביותר, בואו נסתכל על האופן שבו מתבצעים ספיגה ישירה ובדיקת ברדפורד.
כדי להתחיל בניתוח ספיגה ישיר, הספקטרופוטומטר מכויל עם ריק כדי לקבוע אפס ספיגה. פתרונות סטנדרטיים מוכנים לשימוש ביצירת עקומת הכיול. לאחר מכן, aliquot של התקן הראשון מתווסף cuvette, ומושם לתוך ספקטרופוטומטר.
ערך הספיגה ב- 280 ננומטר נרשם לאחר מכן. תהליך זה חוזר על עצמו עבור כל תקן, תוך שימוש ב- cuvette נקי עבור כל ריצה. לאחר השלמת, עקומת כיול נוצרת על ידי התוויית הספיגה לעומת הריכוז. השיפוע של קו זה הוא מקדם ההנחיה הטוחנת, המתייחס לספיגה לריכוז.
לאחר מכן, המדגם הלא ידוע נוסף ל- cuvette, וערך הספיגה נרשם. מכיוון שניתוח הנתונים של שיטות הקביעה הפוטומטריות השונות דומה, אנחנו נכסה את זה אחרי שנסתכל על הבדיקה של ברדפורד.
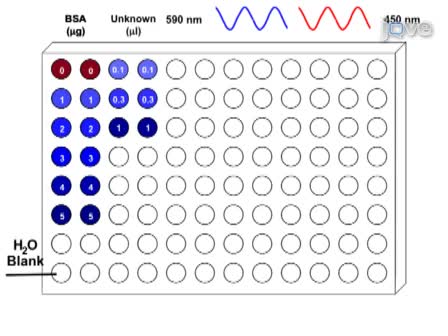
כאן, ברדפורד חלבון אסאי מבוצע עם תקן BSA על צלחת 96 טוב. בתור התחלה, פתרונות מלאי BSA מוכנים.
הפתרונות הלא ידועים מדוללים במים דה-יונים כדי להבטיח שהריכוזים נמצאים בטווח של ההסתה. בהתאם לערכה, צבע הקומאסי עשוי גם לדרוש דילול. לאחר מכן, עקומת הכיול מוגדרת על-ידי הוספת תקני BSA ללוח 96-well.
מים דה-יעו”ד מתווספים כדי להגיע לריכוז הדרוש כדי ליצור עקומה סטנדרטית. יש להוסיף את הדגימה הלא ידועה לצלחת במשולשים כדי להבטיח מדידה מדויקת. צבע קומאסי מתווסף לאחר מכן לכל באר, מתערבב עם הפיפטה.
מים דה-יעוניים מתווספים לבאר ריקה כמו ריקה, כדי למדוד את הספיגה. לאחר המתנה של 5 דקות עד שהצבע ייקשר, הספיגה נמדדת בקורא לוחות ב-590 ננומטר.
עכשיו שביצענו כמה מבדקים, בואו נבדוק איך לנתח את הנתונים. כל שיטת קביעת חלבונים פוטומטרית מבוססת על חוק באר למברט.
הספיגה הנמדדת של הסטנדרטים משמשת ליצירת עקומת כיול, המשמשת לאחר מכן לקביעת ריכוז הדגימות הלא ידועות. ניתן להתוות עקומה זו באופן ידני, אם כי כלים ספקטרופוטומטריים חדשים יותר ייצרו את עקומת הכיול לאחר שכל התקנים נמדדו. מערכות אלה גם לחשב ריכוז חלבון כמו דגימות לא ידועות מנותחים.
כעת, לאחר שבדקנו כיצד לנתח נתוני קביעת חלבונים פוטומטריים, בואו נבחן כמה מהדרכים שבהן נעשה שימוש בהליכים אלה.
העקרונות של קביעת חלבון פוטומטרי יכולים לשמש גם למדידת ריכוז חומצות גרעין ישירות. ספקטרופוטומטר הננו-טיפה מקבל דגימות של נפח קטן מאוד על הדוכן הפעיל אופטית. הספיגה נמדדת לאחר מכן, והמערכת קובעת באופן אוטומטי את ריכוז חומצת הגרעין. מכיוון שחלבונים ומקורות אחרים יכולים להפריע למדידות, טוהר הדגימה נקבע על ידי ניתוח יחסי הספיגה של 260 עד 280 ננומטר ו-260 עד 230 ננומטר. חומצות גרעין טהורות בדרך כלל מניבות יחסי תשואה של כ-1.8 וכ-2.0 לדנ”א ולרנ”א, בהתאמה.
קביעת חלבון פוטומטרי יכולה לשמש גם בייצור של חומרים ביו-מימטיים, אשר בהשראת הטבע כדי לעורר תגובות תאיות ספציפיות. דבקים רקומביננטיים קשורים חרוזי פוליסטירן כדי לדמות התקשרות חיידקית לתאים מארחים. בדיקת ברדפורד משמשת כדי לקבוע את יעילות הצימוד של הידבקות רקומביננטית החרוזים בייצור של החומר הביומימטי.
ניתן להשתמש בגילוי ואפיון של מיקרוביאלים של חלבונים. צבע R כחול מבריק Remazol הוא מלוכד באופן קוולנטי לחיידקים מוכי חום. החלבון אנטי מיקרוביאל הוא דגירה בתמיסה צבועה. לאחר מכן, המדגם הוא צנטריפוגה, ואת הספיגה של supernatant ב 595 ננומטר נמדד באמצעות ספקטרופוטומטר מיקרופלסטיק. ספיגה מוגברת, על ידי הצבע המסיס ששוחרר לתוך supernatant מן החיידקים המסומנים, היא מדידה כמותית של פעילות אנזימטית.
הרגע צפיתם בסרטון של JoVE על קביעת חלבונים פוטומטריים. סרטון זה תיאר את העקרונות הבסיסיים של נחישות פוטומטרית, עבר על נהלים כלליים עבור כמה מותחות נפוצות, וכיסה כמה התפתחויות חדשות בטכניקות. תודה שצפיתם!
Prosedür
Açıklamalar
DEŞİFRE METNİ
Determining the concentration of a protein in samples is a fundamental step in many biochemical assays. Photometric determination can be done with small sample sizes. The more a sample contains light-absorbing substances, the less the light will transmit through it. This provides a quantitative measurement of the absorbing substances. These concepts are so fundamental to science that the articles that introduced two of the techniques are in the three most cited papers of all time. This video will show the concepts behind some of the most common photometric protein determination techniques, how they are performed, and how the gathered data is analyzed.
Photometric protein determination is based on the relationship between concentration and light absorbency. This is known as the Beer-Lambert Law, which states that the concentration of a light-absorbing species is proportional to its absorbance.
This principle underlies all photometric protein determination methods.
For direct absorption analysis, the absorbance values of unaltered protein samples are measured. Because of their aromatic side chains, tryptophan and tyrosine residues give the highest absorbance readings at a wavelength of 280 nm.
However, these amino acids-which are two of the least frequently found in proteins-are present in different amounts in every protein, so each determination is unique. To overcome this limitation, more complex assays-that are not dependent on these amino acids-were developed.
One example is the Bradford Assay, where colored dye is added to the sample. The dye, known as Coomassie Blue, responds proportionally-the more protein present, the more binding events with the dye.
Then, protein concentration is determined by measuring the absorbance of the bound Coomassie Blue dye, which absorbs light at 594 nm. However, the Bradford assay is linear over a short range of concentrations, so dilutions are often required before analysis.
The Lowry Method combines the Biuret reagent, an alkaline solution of copper ions that react with peptide bonds, and the Folin-Ciocâlteu reagent, which oxidizes aromatic protein residues. The resulting color change of the sample is proportional to the protein concentration.
The absorbance of the reduced Folin reagent can be determined at 750 nm. Like direct absorption, each protein has a unique response, and must be calibrated for the protein of interest. Now that we’ve reviewed the basic principles behind some of the most common assays, let’s look at how direct absorption and the Bradford assay are performed.
To begin a direct absorption analysis, the spectrophotometer is calibrated with a blank to determine zero absorbance. Standard solutions are prepared for use in creating the calibration curve. Then, an aliquot of the first standard is added to a cuvette, and placed into the spectrophotometer.
The absorbance value at 280 nm is then recorded. This process is repeated for each standard, using a clean cuvette for each run. Once complete, a calibration curve is created by plotting the absorbance versus concentration. The slope of this line is the molar attenuation coefficient, which relates absorbance to concentration.
Next, the unknown sample is added to a cuvette, and the absorbance value is recorded. As the data analysis for the different photometric determination methods is similar, we will cover that after we look at the Bradford assay.
Here, the Bradford protein assay is performed with a BSA standard on a 96-well plate. To begin, BSA stock solutions are prepared.
The unknown solutions are diluted with deionized water to ensure that the concentrations are within the assay’s range. Depending on the kit, the Coomassie dye may also require dilution. Then, the calibration curve is set up by adding the BSA standards to the 96-well plate.
Deionized water is added to reach the needed concentration to generate a standard curve. The unknown sample should be added to the plate in triplicates to ensure an accurate measurement is taken. Coomassie dye is next added to each well, mixing with the pipette.
Deionized water is added to an empty well as a blank, to measure the absorbance. After waiting 5 min for the dye to bind, the absorbance is measured in a plate-reader at 590 nm.
Now that we’ve performed a few assays, let’s look at how to analyze the data. Each photometric protein determination method is based on the Beer-Lambert Law.
The measured absorbance of the standards is used to create a calibration curve, which is then used to determine the concentration of unknown samples. This curve can be manually plotted, though newer spectrophotometric tools will create the calibration curve once all standards have been measured. These systems will also calculate protein concentration as unknown samples are analyzed.
Now that we’ve reviewed how to analyze photometric protein determination data, let’s look at some of the ways these procedures are utilized.
The principles of photometric protein determination can also be used to directly measure nucleic acid concentration. The nanodrop spectrophotometer accepts samples of very small volume onto an optically active pedestal. The absorbance is then measured, and the system automatically determines the nucleic acid concentration. Because proteins and other sources can interfere with measurements, sample purity is determined by analyzing the 260 to 280 nm and 260 to 230 nm absorbance ratios. Pure nucleic acids typically yield ratios of approximately 1.8 and approximately 2.0 for DNA and RNA, respectively.
Photometric protein determination can also be used in the production of biomimetic materials, which are inspired from nature to elicit specific cellular responses. Recombinant adhesins are bound to polystyrene beads to simulate bacterial attachment to host cells. The Bradford assay is used to determine the coupling efficiency of the recombinant adhesion to the beads in the production of the biomimetic material.
Alternative photometric protein assays can be used in the detection and characterization of protein antimicrobials. Remazol brilliant blue R dye is covalently bonded to heat-killed bacteria. The protein antimicrobial is incubated in the dyed solution. Then, the sample is centrifuged, and the absorbance of the supernatant at 595 nm is measured using a microplate spectrophotometer. Increased absorbance, by the soluble dye released into the supernatant from the labeled bacteria, is a quantitative measurement of enzymatic activity.
You’ve just watched JoVE’s video on photometric protein determination. This video described the underlying principles of photometric determination, went over general procedures for some common assays, and covered some new advances in techniques. Thanks for watching!