Improvement of Bacillus subtilis Spore Enumeration and Label Analysis in Flow Cytometry
Özet
This protocol focuses on the use of flow cytometry and counting beads to quantify bacterial spores labeled with ethidium bromide. The method is also efficient for analyzing the covalent coupling of proteins on the surface of intact spores.
Abstract
The spores of Bacillus subtilis have already been proposed for different biotechnological and immunological applications; however, there is an increasing need for the development of methodologies that improve the detection of antigens immobilized on the surface of spores together with their quantification. Flow cytometry-based analyses have been previously proposed as fast, reliable, and specific approaches for detecting labeled cells of B. subtilis. Herein, we propose the use of flow cytometry to evaluate the display efficiency of a fluorescent antibody (FA) on the surface of the spore and quantify the number of spores using counting beads.
For this, we used ethidium bromide as a DNA marker and an allophycocyanin (APC)-labeled antibody, which was coupled to the spores, as a surface marker. The quantification of spores was performed using counting beads since this technique demonstrates high accuracy in the detection of cells. The labeled spores were analyzed using a flow cytometer, which confirmed the coupling. As a result, it was demonstrated that DNA labeling improved the accuracy of quantification by flow cytometry, for the detection of germinated spores. It was observed that ethidium bromide was not able to label dormant spores; however, this technique provides a more precise determination of the number of spores with fluorescent protein coupled to their surface, thus helping in the development of studies that focus on the use of spores as a biotechnological platform in different applications.
Introduction
Bacillus subtilis is a rod-shaped, gram-positive bacterium that is able to produce quiescent spores when environmental conditions do not allow cell growth1. Spores are extremely stable cell forms and those of several species, including B. subtilis, are widely used as probiotics for human and animal use2. Due to its resistance and safety properties, the spore of B. subtilis, which displays heterologous proteins, has been proposed as a mucosal adjuvant, a vaccine delivery system, and an enzyme-immobilization platform3,4.
To obtain spores from B. subtilis, it is necessary to expose it to nutrient deprivation using a special culture medium. After obtaining and purifying these spores, one must quantify them to improve test efficiency5,6. Thus, certain methods are applied to analyze the concentration of the spores obtained. Plate counting and a Petroff-Hausser chamber, also known as a counting chamber, can be used. The latter was originally developed to determine the concentration of blood cells; however, it is possible to use it in the field of microbiology for spore counting7,8. Despite being the standard method used for cell counting, reading is laborious since this method is completely manual and its accuracy depends on the experience of the operator.
Flow cytometry-based (FC) analyses have been previously proposed as fast, reliable, and specific approaches for detecting labeled cells of Bacillus spp. The use of flow cytometry counting beads has guaranteed reproducibility in cell counting in routine examinations (absolute count of CD4 and CD8 T lymphocytes) and in the development of research involving particles capable of being detected and counted using flow cytometry9. Godjafrey and Alsharif suggested the use of counting beads for FC quantification of unlabeled spores10. The use of flow cytometry was described for the monitoring of sporulation in Bacillus spp. via labeling the spore DNA10,11,12,13. Yet another study used FC to evaluate the amount of fluorescently labeled proteins on the spore surface15.
This study sought to use commercial counting beads to ensure a standard of reproducibility with respect to event counting using flow cytometry. Herein, we suggest the use of counting beads for cell counting in FC to refine spore enumeration and evaluate the coupling efficiency of fluorescently labeled antibodies on the spore surface.
Protocol
See the Table of Materials for details related to all materials, instruments, and software used in this protocol.
1. Flow cytometry setting
- Alignment of optical parameters of flow cytometer coupled to a computer
- Log in to Cytometer software.
- From the software workspace, select Cytometer | Startup and wait a few minutes | Clean mode | Sit fluids.
NOTE: Air bubbles and obstructions were removed during the cytometer initiation process, prior to sample acquisition.
- Quality control
- Use the quality control reagent to adjust the voltages of the photomultiplier tubes and evaluate their sensitivity.
- Prepare the quality control reagent in a polystyrene tube.
- For defining the baseline, prepare the suspension beads by adding 0.5 mL of diluent (10 mM filtered PBS, pH 7) and 3 drops of beads to the labeled tube.
- Mix the bead vial by gentle inversion.
- From the software workspace, select Cytometer | CST to connect to the CST interface. Wait a few minutes and observe the message cytometer disconnected.
- Attach the polystyrene tube containing the quality control reagent to the flow cytometer probe.
- Use the quality control reagent to adjust the voltages of the photomultiplier tubes and evaluate their sensitivity.
- Verification of the configuration of the cytometer
- In the System Summary window, check that the cytometer configuration is appropriate for the experiment.
- Select the setup beads batch ID corresponding to verify that the setup beads lot ID selected matches the current lot of CS&T research beads.
- Performance check
- Select the option Check Performance and click Run.
- Upon completion of the performance check, the performance results will be displayed. View the Cytometer Performance Report. Either click Finish to complete the performance check or remove the tube from the cytometer and review the results in the System Summary window.
- Observe the final result of the morphometric and fluorescence sensitivity analysis that will appear in the | system summary| cytometer performance result| with the status: PASSED
2. Preparation of the spores
- After sporulation, rinse the spores 3x with ultrapure ice-cold water by centrifugation at 17,949 × g for 10 min.
- Resuspend the pellet obtained from the last centrifugation with 10 mL of ultrapure water.
- Autoclave the spores for 45 min at 121 ºC for inactivation of the vegetative cells.
NOTE: Previous tests carried out by our group comparing different inactivation methods demonstrated that the conditions mentioned in step 2.3 presented high efficiency, showing no colony formation in the plating analysis method on the LB agar medium.
3. Quantification of autoclaved spores using flow cytometry
- Take 50 µL of autoclaved spores and incubate them protected from light with ethidium bromide (EtBr, 10 mg/mL diluted in water) at a dilution factor of 0.05% v/v for 30 min (Figure 1A).
- Wash the spores 3x with 1x phosphate-buffered saline (PBS) by centrifugation at 17,949 × g for 10 min and resuspend in 1x PBS.
- Add 10 µL of beads, following the manufacturer's recommendations for dilution.
- Analyze the sample using a flow cytometer as described in step 4.
NOTE: It is important to emphasize that the beads should be pipetted as homogeneously as possible since disparities were observed in the calculations when this step was not well executed.
4. Analysis using flow cytometry
- Log in to Cytometer software.
- From the software workspace, select Cytometer | Clean mode | Sit fluids.
- Adjust to the workspace to determine the analysis in flow cytometry.
- Define the gates for the analyses (Figure 2).
- Define the gating strategy based on the morphometric and fluorescence characteristics of the particles based on the negative control (unmarked spores).
- To determine cell morphometry, choose Dotplot graphic for analyses of FSC-A parameters on the x-axis and SSC-A on the y-axis.
- To determine fluorescence, choose FL3 Dotplot plots on the y-axis using FL5 on the x-axis and create the gates in four quadrants.
- Define the gates for the analyses (Figure 2).
- Use a 12 x 75 mm stoppered polystyrene tube containing unlabeled samples, previously labeled with single-color EtBr, single-color APC, and multicolor EtBr+ APC.
- Mix the tube very gently containing the negative control and attach it to the flow cytometer probe.
- Click on Acquire.
- Set the power of the lasers by navigating to Cytometer | Parameters | FSC (375) and SSC (275).
- Set the threshold to (500) Cytometer | Threshold.
- To remove autofluorescence, analyze the dye-free sample containing only spores.
- Adjust the voltages for the filter detectors: FL3 (603) and FL5 (538) to discriminate negative and positive populations with respect to the chosen fluorescence in the controls. Cytometer | Parameters.
- Cytometer | Compensation | Set FL5/FL3 setup offset için 1.0.
- After morphometry and fluorescent analysis, configure the device for Acquisition 30,000 events | Experiment | Experiment layout | Acquisition |30,000 events….
- After adjusting the parameters, acquire data for the samples that are labeled and contain beads in the flow cytometer.
- Calculate spore concentration as described by the manufacturer's instructions using equation (1).
 (1)
(1)
NOTE: For this study, the bead quantification method was compared to the Petroff-Hausser counting chamber analysis. In addition, the labeling of autoclaved spores was compared to the labeling of non-autoclaved spores.
5. Estimation of the protein coupling index on a spore surface using flow cytometry
- Harvest by centrifugation of 50 µL of spores (103/µL) 17,949 × g for 10 min and then, resuspend with 25 µL of 1-ethyl-3-(3-dimethylaminopropyl)carbodiimide (EDC) (300 mM)).
- Incubate for 15 min at room temperature.
- Add 25 µL of N-hydroxysulfosuccinimide (NHS) (50 mM) to the spore suspension and incubate it at room temperature for 30 min.
- Wash the spores 3x with 1x PBS by centrifugation as described in step 5.1.
- Add fluorescent protein and leave the samples overnight at 15 °C.
NOTE: The fluorescent protein used in this work was an APC-labeled anti-human IL-10 antibody. This antibody was used as a model for study, though the application of other fluorescent molecules is possible since EDC/NHS promote a covalent ligation between -COOH and -NH2 groups present in proteins on the spore surface. - Wash the spores as per step 5.3.
- Add 10 mg/mL of ethidium bromide diluted at 1:50, then leave for 1 h on ice and protected from light (Figure 1B).
- Wash the spores as per step 5.3.
- Repeat step 4.
- To determine fluorescence, change the parameters FL3 on the X axis and FL5 on the Y axis of the dotplot.
- Analyze the sample using a flow cytometer with the blue laser (488 nm) at FL3 (670 LP filter) and the red laser (633 nm) videodan FL5 (660/20 filter), as described in step 4.
NOTE: The same samples were analyzed for immunofluorescence on slides under a microscope, at a magnification range of 1,000 x, and using the following filters: FITC 480/30 nm (green) and TRITC 540/25 nm (red).
Representative Results
In autoclaved spore (AS) samples, 2 × 10³ spores/µl and 1 × 10³ spores/µl were detected by using counting beads and the Petroff-Hausser method, respectively (Figure 2).
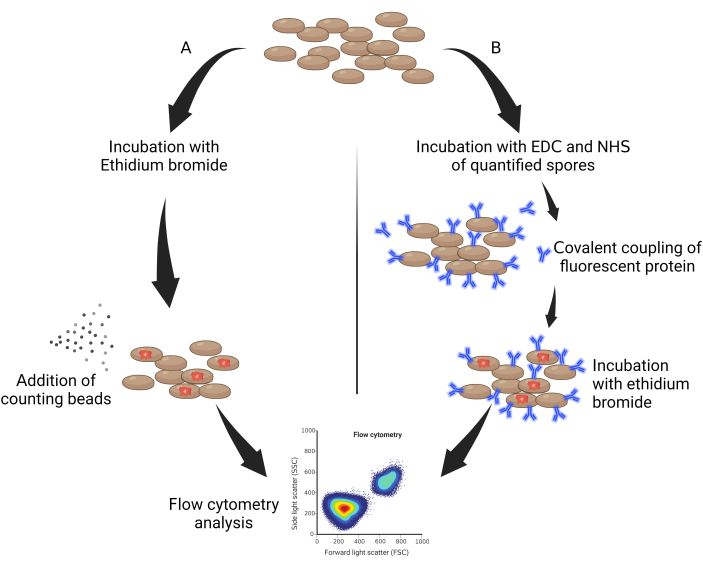
Figure 1: General scheme of quantification of spores. (A) Spores labeled with EtBr and (B) double-labeled spores. Abbreviations: EDC = 1-ethyl-3-(3-dimethylaminopropyl)carbodiimide; NHS = N-hydroxysulfosuccinimide. Please click here to view a larger version of this figure.
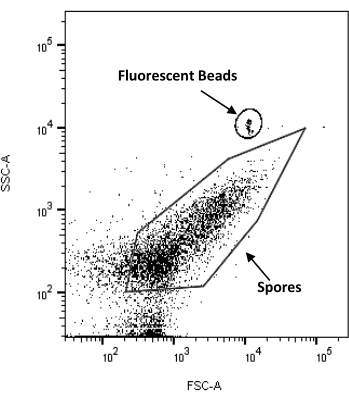
Figure 2: Morphometric and qualitative analysis of Bacillus subtilis spore and counting beads using flow cytometry. Quantification of B. subtillis spores using counting beads (undiluted sample). Abbreviations: FSC-A = forward scatter-peak area; SSC-A = side scatter-peak area. Please click here to view a larger version of this figure.
Ethidium bromide (EtBr) staining of autoclaved spore (AS) samples showed higher mean fluorescence intensity (MFI) than the staining of non-autoclaved spores (NAS), thus indicating greater staining of genetic material in the first condition. In addition, a greater MFI was observed in the EtBr-labeled AS population than in the NAS population (Figure 3, peak in red and peak in black). The control sample, not labeled with EtBr, did not show significant fluorescence (Figure 3, dotted peak).
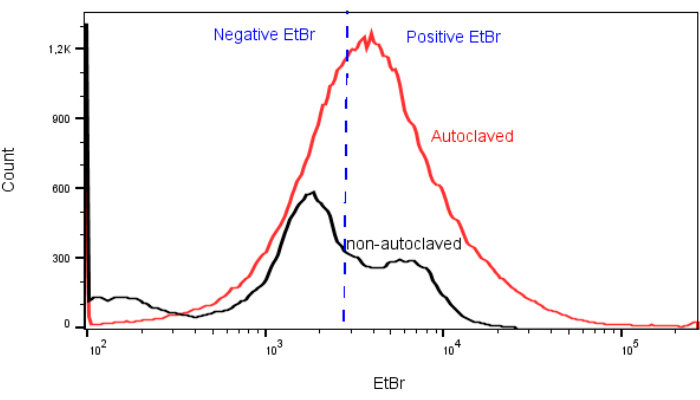
Figure 3: Histogram of ethidium bromide-labeled, autoclaved, and non-autoclaved Bacillus subtillis spores. Peak in red-NAS EtBr labeling; peak in black-AS EtBr labeling; dotted peak-control without EtBr labeling. Abbreviations: EtBr = ethidium bromide; NAS = non-autoclaved spores; AS = autoclaved spores. Please click here to view a larger version of this figure.
In these experiments, MFI on the AS surface coupling with APC-labeled anti-human IL-10 antibody showed greater coupling efficiency when compared to NAS (Figure 4). For this reason, the double-labeled experiments were performed with AS. Four spore populations were identified in the flow cytometry analysis: EtBr+/FA+; EtBr+/FA-; EtBr-/FA+; EtBr-/FA-. The presence of spores that are permeable to the molecular marker EtBr indicates the possible presence of germinated spores in the total population. This could be observed after analysis of the sample using fluorescence microscopy (by which it was possible to observe the EtBr/Fluorescent Anti-mouse table 8 labeling and both fluorophores individually, Figure 5). Using the Wirtz-Conklin staining method allowed the visualization of the existence of spores with permeability for safranin (stained in pink, Supplementary Figure S1). In this same analysis, spores stained only with malachite green were observed, indicating impermeability, as reported in the literature for dormant spores13. The spore analysis by phase contrast microscopy presents a higher number of dormant spores in the AS sample when compared to NAS (Supplementary Figure S2)14.
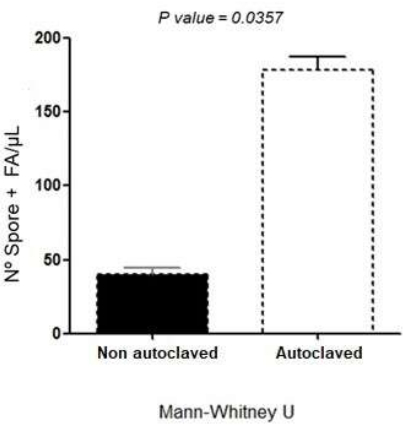
Figure 4: Mean fluorescence intensity of APC-labeled anti-human IL-10 antibodies in autoclaved and non-autoclaved spores. Abbreviations: FA = fluorescent antibody; APC =allophycocyanin. Please click here to view a larger version of this figure.
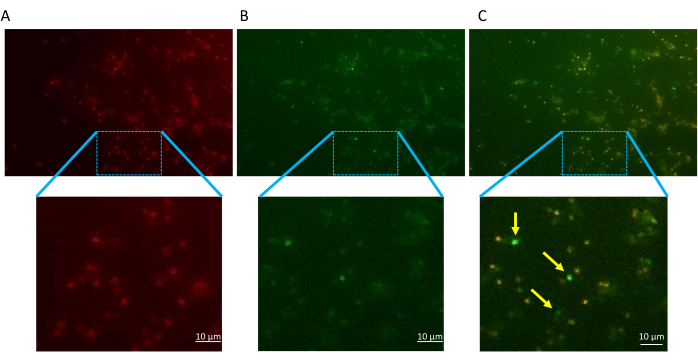
Figure 5: Immunofluorescence imaging of spores labeled with EtBr and fluorescent anti-mouse. (A) Spores with genetic material marked with EtBr (red). (B) Spores with surface labeled with fluorescent anti-mouse (green). (C) Double-labeled spores, with EtBr and fluorescent anti-mouse (orange). Scale bar = 10 µm. Abbreviations: EtBr = ethidium bromide. Please click here to view a larger version of this figure.
The flow cytometry analyses performed here indicated a higher percentage of coupling of the FA to the dormant spores (EtBr-/FA+) when compared to germinated spores (EtBr+/FA+). In the graph shown in Figure 6A,B, the increase in the percentage of coupled spores and MFI can be observed as the concentration of FA increases. In addition, the populations of these spores that did not couple with the fluorescent protein (EtBr+/FA- and EtBr-/FA-) showed a gradual reduction with the increase in the concentration of FA (Supplementary Table S1).
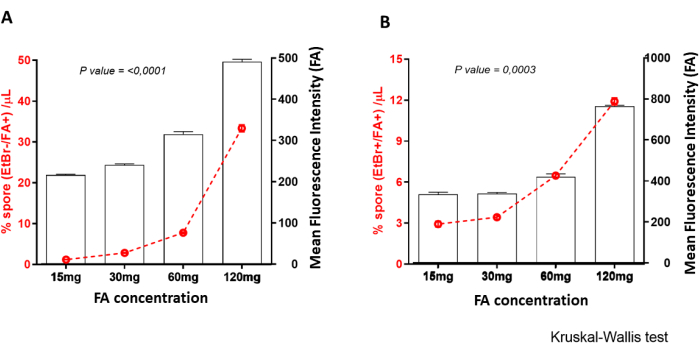
Figure 6: Fluorescence coupling percentage analysis and mean fluorescence intensity of EtBr-/FA+ and EtBr+/FA- populations. (A) The x-axis represents the different concentrations of the FA, the black y-axis represents the detected MFI, and the red y-axis represents the percentage of FA-labeled spores from the EtBr – /FA+ population. (B) The x-axis represents the different concentrations of FA, the black y-axis represents the detected MFI, and the red y-axis represents the percentage of EtBr-labeled spores and FA from the EtBr+/FA+ population. Abbreviations: MFI = mean fluorescence intensity; EtBr = ethidium bromide; FA = fluorescent antibody. Please click here to view a larger version of this figure.
Supplementary Figure S1: Microscopy image of autoclaved B. subtilis spores stained by Wirtz-Conklin methodology. Spores stained pink are germinated spores (permeable to safranin). In green are dormant spores (impermeable to safranin). Scale bar = 10 µm. Please click here to download this File.
Supplementary Figure S2: Comparison of phase contrast microscopy images of autoclaved and non-autoclaved B. subtilis spores. (A,B) Images of B. subtilis spores before and after the autoclave treatment. Please click here to download this File.
Supplementary Table S1: Values of the percentages of spores marked, or not, with fluorescent antibody and ethidium bromide, in different FA concentrations, observed in flow cytometry. Abbreviations: EtBr = ethidium bromide; FA = fluorescent antibody. Please click here to download this File.
Discussion
Traditional methods, such as plate counting of colonies, are not only time-consuming, but also need viable cells and do not allow for quantification of inactivated spores5. The Petroff-Hausser chamber is an alternative methodology, but it requires an experienced microscopist to perform it. Flow cytometry has proven to be a useful alternative for this purpose.
Genovese et al.12 described the use of flow cytometry for the quantification of viable cells and spores of Bacillus sp. using two nucleic acid markers and high control capacity of the flow rate (volume/minute) of the equipment used, which provides the option to determine the numerical quantity to be configured. Not all cytometry equipment has strict control over the flow rate (volume/minutes), and some are adjustable only in the minimum, medium, and maximum options. In these cases, counting beads can be used to ensure the accuracy of cell enumeration and reproducibility against other flow cytometry equipment. Via this method, in this study, it was possible to calculate the number of spores (germinated and dormant) per milliliter in the samples.
The spore population was enumerated and analyzed according to the parameters described in Godfrey and Alsharif's patent10. These authors describe the use of this methodology for the analysis of the germination stages of Bacillus spp. without describing the state of the spore and using high-cost commercial DNA markers11,12,13. In the work described here, using AS, it was possible to identify two populations of spores (dormant and germinated) using EtBr, which is a widely used and easily accessible marker. The identification of the spore state was possible due to the permeability of the germinated spores to the EtBr. It is important to highlight that the population of spores not labeled with EtBr may present artifacts of similar size in the same sample. This limitation can be mitigated by washing and filtering the buffers used.
The flow cytometry analysis of EtBr-labeled AS samples coupled with FA described here also allowed for the qualification and quantification of fluorescent protein coupling (FPC). Analysis of fluorescently labeled and coupled samples should be performed immediately to avoid loss of fluorescence emission. Moreover, it was possible to infer whether the spore population morphology and concentration were affected by the conjugation procedure, giving an overall comprehension of the process, which is not obtained when using the dot-blot method. Isticato et al.15 also analyzed FPC on the spore surface and demonstrated its viability by confirming it with immunofluorescence and flow cytometry, depending on the type of protein that is used for coupling. Herein, it was observed that the use of AS11 is preferable for coupling since the autoclaving process is important for the inactivation of proteases that may degrade the protein to be coupled. It is important to point out that the techniques described here were performed using only the B. subtilis KO7 strain, with the application in other strains still to be tested.
There are no reports in the literature that compare the coupling capacity of spores according to their stage. In the experiments presented here, a higher percentage of dormant spores coupled with FA was observed (EtBr-/FA+)16. In contrast, germinated spores (EtBr+/FA+), despite their lower percentage, showed a higher MFI than what was observed in the dormant spores. Further studies need to be conducted to evaluate this behavior for higher concentrations of FA (saturation point) in other Bacillus spp.
For future applications, the method presented here could be used in studies on the use of B. subtilis spores as a vaccine adjuvant, evaluating the coupling of a target antigen initially labeled by fluorescence. After determining the saturating concentration, the detected value can be applied to the target antigen for use in immunizations.
Thus, this paper presents a practical and sensitive method for the enumeration of germinated and dormant spores and the analysis of fluorescent protein coupling of Bacillus subtilis spores using flow cytometry. The use of counting beads as a parameter for quantification, in addition to the EtBr spore labeling, permits a refined counting of germinated spores and the percentage determination of fluorescent protein coupling. This method should help in the development of studies that focus on the use of spores as an adjuvant.
Açıklamalar
The authors have nothing to disclose.
Acknowledgements
This study was financed in part by the Coordenação de Aperfeiçoamento de Pessoal de Nível Superior-Brasil (CAPES)-Finance Code 001; Governo do Estado do Amazonas with resources from Fundação de Amparo à Pesquisa do Estado do Amazonas-FAPEAM; Conselho Nacional de Desenvolvimento Científico e Tecnológico (CNPq). The authors thank the Program for Technological Development in Tools for Health PDTIS-FIOCRUZ for use of its facilities.
Materials
| ((1-ethyl-3-(3-dimethylaminopropyl) carbodiimide hydrochloride) (EDC) | Sigma | 341006 | |
| (N-hydroxysuccinimide) (NHS) | Sigma | 130672 | |
| Anti-human fluorescent antibody | BioLegend | 501410 | APC anti-human IL-10 |
| Anti-mouse fluorescent antibody | Thermo Scientific | A32723 | Alexa Fluor Plus 488 |
| BD FACSCanto II | BD | Flow cytometer | |
| BD FACSDiva Cytometer Setup & Tracking Beads Kit (use with BD FACSDiva software v 6.x) | BD | 642412 | Quality control reagent |
| BD FACSDiva Software v. 6.1.3 | BD | 643629 | Software |
| Centrifuge MegaFuge 8R | Thermo Scientific | 75007213 | |
| Counting Beads | BD | 340334 | TruCount Tubes |
| Eclipse 80i | Nikon | Fluorescent Microsope | |
| Ethidium Bromide | Ludwig Biotec | ||
| Phosphate buffered saline | Sigma-Aldrich | A4503 | |
| Plastic Microtubes | Eppendorf | ||
| Polystyrene tube | Falcon | 352008 | 5 mL polystyrene tube, 12 x 75 mm, without lid, non-sterile |
Referanslar
- McKenney, P. T., Driks, A., Eichenberger, P. The Bacillus subtilis endospore: assembly and functions of the multilayered coat. Nature Reviews. Microbiology. 11 (1), 33-44 (2013).
- Cutting, S. M. Bacillus probiotics. Food Microbiology. 28 (2), 214-220 (2011).
- Ricca, E., Baccigalupi, L., Cangiano, G., De Felice, M., Isticato, R. Mucosal vaccine delivery by non-recombinant spores of Bacillus subtilis. Microbial Cell Factories. 13, 115 (2014).
- Falahati-Pour, S. K., Lotfi, A. S., Ahmadian, G., Baghizadeh, A. Covalent immobilization of recombinant organophosphorus hydrolase on spores of Bacillus subtilis. Journal of Applied Microbiology. 118 (4), 976-988 (2015).
- Harrold, Z., Hertel, M., Gorman-Lewis, D. Optimizing Bacillus subtilis spore isolation and quantifying spore harvest purity. Journal of Microbiological Methods. 87 (3), 325-329 (2011).
- Nicholson, W. L., Setlow, P. Sporulation, germination and outgrowth. Molecular biological methods for Bacillus. , (1990).
- Mora-Uribe, P., et al. Characterization of the adherence of Clostridium difficile spores: the integrity of the outermost layer affects adherence properties of spores of the epidemic strain R20291 to components of the intestinal mucosa. Frontiers in Cellular and Infection Microbiology. 6, 99 (2016).
- Paidhungat, M., Setlow, P. Role of ger proteins in nutrient and nonnutrient triggering of spore germination in Bacillus subtilis. Journal of Bacteriology. 182 (9), 2513-2519 (2000).
- Schnizlein-Bick, C., Spritzler, J., Wilkening, C., Nicholson, J., O’Gorman, M. Evaluation of TruCount absolute-count tubes for determining CD4 and CD8 cell numbers in human immunodeficiency virus-positive adults. Site Investigators and The NIAID DAIDS New Technologies Evaluation Group. Clinical and Diagnostic Laboratory Immunology. 7 (3), 336-343 (2000).
- Godfrey, A., Alsharif, R. Rapid enumeration of viable spores by flow cytometry. US Patent. , (2003).
- Karava, M., Bracharz, F., Kabisch, J. Quantification and isolation of Bacillus subtilis spores using cell sorting and automated gating. PLoS ONE. 14 (7), e021989 (2019).
- Genovese, M., Poulain, E., Doppler, F., Toussaint, R., Boyer, M. Bacillus spore enumeration using flow cytometry: A proof of concept for probiotic application. Journal of Microbiological Methods. 190, 106336 (2021).
- Trunet, C., Ngo, H., Coroller, L. Quantifying permeabilization and activity recovery of Bacillus spores in adverse conditions for growth. Food Microbiology. 81, 115-120 (2019).
- Tehri, N., Kumar, N., Raghu, H., Vashishth, A. Biomarkers of bacterial spore germination. Annals of Microbiology. 68, 513-523 (2018).
- Isticato, R., Ricca, E., Baccigalupi, L. Spore adsorption as a nonrecombinant display system for enzymes and antigens. Journal of Visualized Experiments. 145, e59102 (2019).
- Song, M., et al. Killed Bacillus subtilis spores as a mucosal adjuvant for an H5N1 vaccine. Vaccine. 30 (22), 3266-3277 (2012).

