Physiological Characterization of the Coral Holobiont Using a New Micro-Respirometry Tool
Özet
This protocol describes the setup and running of a micro-respirometry system that can be employed to investigate the physiological features of the coral holobiont.
Abstract
Metabolic activity, defined as the sum of organismal processes that involve energy, is of critical importance in understanding the function and evolution of life on earth. Measuring organismal metabolic rates is, therefore, at the center of explaining the physiological states of organisms, their ecological roles, and the impact of environmental change on species within terrestrial and aquatic ecosystems. On coral reefs, measures of metabolism have been used to quantify symbiosis functioning between corals and their obligate algal symbionts (Symbiodiniaceae), as well as assess how environmental stressors, including climate change, will impact coral health. Despite this significance, there is a lack of methods, and therefore data, relating to metabolic rate measurements in coral offspring, likely due to their small size. To address this gap, this study aimed to develop a custom setup for measuring the respiration of small (millimeter size range) marine animal ecologies. This low cost and easy setup should allow for the improved measurement of metabolic rate. This will be essential for applied ecological research utilizing the sexual production of corals for reef restoration.
Introduction
Respiration is a critical biological measurement that signals the overall metabolic activity of an organism, but like other critical traits (growth), is hard to measure in small organisms1. Respiration can be defined as the oxidation of organic molecules through the use of oxygen. This process generates the chemical energy needed for cellular function (i.e., metabolism), which is essential for the survival of organisms. Alternatively, anaerobic metabolism results in oxygen debt2. Respiration rates can be determined using optodes that measure the usage (and therefore the decrease) of oxygen concentration over time in a closed chamber, a practice generally known as respirometry3. Given that the majority of organisms do not store oxygen, the rate of metabolism can be inferred through the direct correlation between respiration and carbon usage. Because of this, respiration rates can be converted to daily carbon usage, which informs critical metabolic functions like growth, reproduction, and the ability to maintain metabolic homeostasis during times of environmental stress4,5, including heatwave conditions that generally lead to stress or bleaching in corals.
Coral reefs are declining globally at an accelerating rate. The coral animal houses a consortium of partners (including dinoflagellate Symbiodiniaceae, fungi, bacteria, and viruses), collectively referred to as the "holobiont"6. As ocean temperatures rise, corals, and therefore coral reefs, are under increasing pressure to survive, as high temperatures lead to the loss of the dinoflagellate Symbiodiniaceae (hereafter symbionts), a phenomenon known as bleaching7. Many nutrients are otherwise unavailable to corals in oligotrophic tropical waters, including inorganic nitrogen and phosphorus8. To cope, corals form an obligate nutritional symbiosis with their dinoflagellate symbionts (Symbiodiniaceae), which provide the majority of the nutrients needed by the coral host to survive and deposit their calcium carbonate skeletons9. A functioning symbiosis may be characterized by high levels of carbon sharing between partners10,11, and the regulation of symbiosis involves a dynamic homeostasis12.
During heat stress, this dynamic regulation and communication are disrupted, resulting in dysbiosis and bleaching (reviewed in reference13). Metabolic measurements, such as photosynthesis and respiration, therefore, hold the potential to elucidate both the healthy and unregulated, dysbiotic states of corals, and accurately measuring these processes across ontogeny is critical to understanding organismal functioning. This is particularly important as the frequency and magnitude of mass bleaching events increase, with the potential to influence changes in nutrient sharing from the symbionts, where carbon transfer has been found to decrease as temperatures increase14. This could be due to directed mechanisms by the symbiont sequestering nutrients or from hard-physiological trade-offs (increased thermal tolerance but a decrease in host survival15,16,17). Disruptions in symbiosis may stem from both the symbiont and the host, although a leading factor is likely the cellular malfunctioning of the symbiont18. However, stress caused by increases in seawater temperatures destabilizes this symbiosis; carbon sharing from symbiont to host is diminished19,20, and starvation of the coral may ensue. This may be reflected in diminished lipid and carbohydrate stores in corals due to increased host usage ("increased catabolism of fixed carbon"), likely due to diminished sharing by symbionts11. Alongside the contribution of photosynthesis and respiration of the corals' symbionts, respiration of the coral animal is an important measure to understand coral health, the impacts of bleaching and nutrient exchange between these partners, and the growth of the holobiont, a phenotype relevant for surviving environmental change8,21,22. Finally, given many corals are symbiotic, the use of respirometry to characterize photosynthesis in addition to respiration is particularly useful for contextualizing P:R ratios and understanding if the symbiosis is stable or not (e.g., reference23).
Environmental changes, therefore, cause shifts in the energy budgets of the coral and its symbionts, leading to differences in growth14. To cope, the coral host may increase respiration and lipid usage to meet its metabolic demands; heat stress can reduce net productivity by 60% due to this increased respiration14, as measured by a change in dissolved oxygen. Symbiodiniaceae may also increase nitrogen assimilation and carbon retention14,24, and then use these reserves to shift energy toward their own repair and protective mechanisms25,26. The balance of N and C is important for regulating growth, and P in particular27, which may manifest as a dynamic regulation of symbiont abundance. Indeed, evidence collected from corals across large reef expanses (>1,000 km) suggests that hosts have the capacity to limit symbiont growth through the regulation of P, although this varies by coral species27.
Taken together, these studies suggest a gain of heat tolerance with a concomitant decrease in either the production or translocation of nutrients (i.e., the propensity for symbiosis) due to environmental changes. Powerful single-juvenile methods, such as quantifying oxygen use via micro-respirometry, should therefore be used to understand the fundamental mechanisms relating to metabolism and then applied to conservation questions such as understanding heat tolerance acquisition. This is presented here as a micro-respirometry tool for physiological measures, intended to query the nutritional relationship between coral juveniles and their algal symbionts, but suitable for other small marine organisms.
The use or production of oxygen by organisms can be measured by placing them into individual, hermetically sealed respirometry chambers or 'respirometers' (hereafter chambers), where oxygen change is measured using optodes3. Optodes are probes that measure oxygen concentration using light pulses, and logging measurements over time allows the calculation of respiration and/or photosynthesis rates. In practice, measuring respiration is similar to measuring photosynthesis in corals, except that the corals are incubated in total darkness. Subtracting the total daily respiration of the coral and symbionts from the total daily photosynthesis results in an oxygen differential (oxygen delta)2,3. Generally, organisms use more oxygen than they produce, resulting in a deficit. This can be converted to carbon equivalents since oxygen and carbon are consumed in a fixed ratio2. The carbon surplus can be used by the coral for growth, mucus synthesis and reproduction, and other essential metabolic needs12.
This protocol describes a micro-respiration method (Figure 1) that was employed for measuring rates of respiration (R) for individual coral juveniles using a custom-made 1.5 mL glass chamber design (vial with GL25 thread and 20 mm high, with bump/ridge, flat-ground rim, and screw cap with hole; see Table of Materials) filled with 0.5 µm filtered seawater. Fiberoptic optodes (see Table of Materials) were inserted into each chamber through a hole in the side of the lid. Each individual coral was attached above a hard mesh, flow-through stirrer plate platform above a magnetic stir-bar to ensure adequate mixing of water within the chamber. In the representative example here, two controls or "blanks" (chambers that were identical except for the presence of the specimen) were measured concurrently to the three replicate specimen chambers, as we had multiple controllers running simultaneously. However, the setup example (Figure 2) only shows the use of four channels; this can be increased using multiple controllers and multiple flow-through stands. The temperature could also be controlled in this system by submerging each chamber in a custom-made water bath with preset water temperatures (27 °C for control or 31 °C for the high temperature stress in the example data here) using a recirculating flow-through (continuous, gentle flow set at 75 L/h) system. The stirrer plate platform and the stirrer plate with gears can be any size and can be made as large or as small as required to accommodate the number of glass chambers. In this example, the platform and plate were about 34 cm x 26 cm x 3 cm (Table of Materials). Calibration of the optodes was performed before each run using two standard solutions representing 0% and 100% oxygen saturation at the appropriate water temperature and salinity for this experimental setting.
Protocol
1. Setup of equipment and corals within the respiration chambers
NOTE: Reproductively ready corals (i.e., those that had pinkish pigmented egg/sperm bundles visible from fragmented branchlets from the species Acropora tenuis colonies) were dislodged from the reef at Magnetic Island (19° 6.249'S; 146° 51.728'E) on the day of a full moon in October 2018 (permit number: G12/35236.1), collected, and brought into the laboratory for coral spawning, where juvenile corals were bred and grown.
- On the day of measurements, connect the two water bath plates using blue polypipe and connectors (see Table of Materials; Figure 1 [5], Figure 2A,B). These will serve as incubators after connection with the blue polypipe to the water heater/chiller. Ensure that the motor plate can clearly be seen through the transparent water bath plates when the respirometry chambers are not in place.
- Connect the two hoses to the water heater/chiller (see Table of Materials). Switch on the water heater/chiller and then set the desired experimental temperature (27 °C or 31 °C).
- Connect the base of the water bath (step 1.1) to the base motor plate with the magnetic gears (Figure 1 [6, 7] and Figure 3A), and then connect this assembly to a power source (Figure 3B). Turn on the power source to activate the gears, which will activate the stirrer bars in the chambers.
- Modulate the water flow as required (e.g., continuous, gentle flow set at 75 L/h with slow stirring at 30 rpm) using the valve connector knobs (Figure 3C).
- To assemble the respirometry chamber, add the magnetic bead (Figure 1 [1.5]) to the glass chamber (Figure 1 [1.6]), and then the opaque plastic flow-through stand base (Figure 1 [1.4]) into the glass chamber (Figure 4A). The size of the chamber and the magnetic bead will depend on the organism and study system of interest.
NOTE: There are holes in the plastic base to allow for water flow and circulation from the movement of the magnetic bead in the bottom. - Glue the coral using aquarium glue (see Table of Materials) to the black zip-tie placed in the plastic base (Figure 4B-D). To do this, first, glue the coral juvenile to a piece of black plastic, and then glue this piece to the plastic base. Once the coral is affixed securely (curing of the glue is almost instantaneous), screw the lid with the O-ring (Figure 4A) onto the glass chamber. Perform these actions underwater in a separate basin to make sure that no air is within the respirometry chamber.
NOTE: The volume of water in the respirometer (i.e., effective volume = 1.5 ml) was determined through the complete submersion of the chamber underwater. The assumption is that, relative to the water volume, the displacement from the mass/density of the very small coral is negligible. The 1.5 mL microcentrifuge tube is shown here for scale (Figure 4A). - Firmly place the chambers into the water baths (Figure 5A). Ensure that the glass chambers are in contact with the temperature-controlled water for the experiment.
- Connect the O2 fiber optic cables (see Table of Materials) so they are in contact with the oxygen sensor spots (hereafter referred to as spots; see Table of Materials) by inserting them into the hole drilled into the side of the lid chambers. These small spots are oxygen-sensitive and will detect and transmit the signal from within the chamber through the fiber optic cable.
- Add plumbing tape (white thin self-sealing tape) to make the cable fit snuggly and to let it remain firmly inside the water chamber. Ensure that the individual coral can be seen (as seen in Figure 5B), with brown tentacles facing up, inside the chamber (Figure 5B, Video 1).
NOTE: Cost estimates of the components in the apparatus are provided in Table 1.
- Add plumbing tape (white thin self-sealing tape) to make the cable fit snuggly and to let it remain firmly inside the water chamber. Ensure that the individual coral can be seen (as seen in Figure 5B), with brown tentacles facing up, inside the chamber (Figure 5B, Video 1).
2. Standard operating procedure for measuring respiration using the O2 system
- Open the oxygen measurement software (see Table of Materials).
- Measure the temperature of the room where the calibration will be performed. This will be needed later for the calibration stage (step 2.8).
- Assemble the optical sensors and caps. To do this, connect all the fiber optics to the matching port in the O2 module. Make sure to match cap 1 with sensor 1, cap 2 with sensor 2, and so on.
- To set up the chambers for calibration, first moisten a piece of clean sponge with a bit of reverse osmosis (RO) water and insert it into each chamber.
NOTE: The sponge should not drip, only be moist. It may drip on the fiber optic spot. Ensure that the spot is not wet before proceeding to the next step. - Place the chambers upside down with the matching fiber optic (Figure 6). This will allow unscrewing the chamber without touching the fiber optic and adding the sodium sulfite for the 0% calibration.
- Check the signal of each sensor before the start of the calibration. Go through all the tabs in the software interface and check the signal value (top left corner) (Figure 7A), ensuring that they do not vary significantly. Check the O2 manual for the acceptable values for the experimental setup (depending on the organism and conditions of interest). For this specific setup, at a room temperature of 25.3 °C, an FTC (oxygen sensor spot flow through cell normal range) of 20.59 with the signal at 179.5 is acceptable.
- Open Program and check the settings in the software to confirm they are correct as outlined below. If the pop-up window doesn't show up immediately after opening the program, this can be done by clicking the Settings button in the left bottom corner of the software interface.
- Check that the external temperature sensor is activated (Figure 7B). Change the setting to Fixed temperature (Figure 7C). Then, add the room temperature value and click copy setting to all other channels.
- Change the setting to Reduce Signal Drift (Figure 7C). Then, select Sensor Settings and select level 2. Otherwise, if using small volumes, the drift will be so high that it will be difficult to calibrate.
- Check the general settings of the channels. Press Ok if adequate. Click copy settings to all the channels, and then click ok.
- Calibrate the sensors. For channel 1 calibration, go to the Channel 1 tab and press the Calibrate button. Select 2-Point in Water or Humid Air.
- For the "air" calibration, dip a piece of foam in water, place it inside the chamber, and wait for the signal to stabilize (see the before and after air calibration images). When stable, press "set air". Click air > Calibrate > set air.
- Set the 0% and 100% calibration (Figure 7D). Remove the chamber from the cap and place it in the next cap so that the air calibration signal is ready when the 0% calibration in the first sensor is finished. Use a transfer pipette and fill the cap with 2% sodium sulfite. Wait for the signal to stabilize.
NOTE: The signal usually takes more time to stabilize compared to the air calibration. If a warning message appears that says that the "values are out of typical range", make sure the sodium sulfite is fresh. Repeat the same calibration process for all the channels. Prepare the sodium sulfite by adding 2 g in 100 mL of RO water. - Once the calibration is completed, rinse the respiration chambers well and dry the chambers and caps. Make sure there is no water in the fiber optic hole.
- Place the organism (single coral juveniles, in this example) inside the respiration chambers and close with lids. When placing the lids, make sure to do it when the chambers are fully submerged and there is absolutely no air inside.
- Place the chambers firmly in the stirring plate and connect the fiber optics.
- Turn on the power supply. Make sure that the water inside the chambers gets mixed completely. Set the temperature in the chiller/heater to the chosen experimental temperatures.
- Turn the pump and the heater on (steps 1.2 and 1.4).
- Press log on the O2 measurement software interface to start recording.
Representative Results
Data processing and analysis
While there are numerous methods to process the raw data from respirometry experiments, it is recommended to use the R package respR28. In keeping with the sharing of the protocols above, which advocate for open science and reproducibility, this package allows data processing and analysis to be shared in an easily reproducible form and has been designed with that in mind. It is a free, open-source platform and probe-system agnostic, and easily installable either from CRAN or GitHub. Full code and examples for respR are maintained and can be found at https://github.com/januarharianto/respR.
The respR package has functions to import, visualize, and perform quality control on respirometry data, and to calculate respiration rates either automatically or from manually chosen regions. It can also adjust rates for background respiration and conversion rates to commonly used output units. The steps to process the data from the micro-respirometry system are detailed below. In this study, the data from the respirometry system was used as an example, but the package also accepts inputs from the majority of commercially available oxygen probe systems as well as generic R data objects. More details about the package, including full documentation and tutorials, can be found on the package website at https://januarharianto.github.io/respR/index.html.
Importing raw data
The raw output file (.txt) is imported. respR recognizes the format and parses it to a generic R data frame that can be used in subsequent functions. However, it is important to note that this is optional; these files and virtually any oxygen time series data can also be imported using base functions (given below) by anyone with a basic knowledge of R.
#load respR
Library(respR)
#Import —
Data <- import_file("file.txt")
#Firesting-Pryo file detected
Inspecting and visualizing the data
A vital part of any data analysis task is to plot and inspect the data to look for obvious anomalies or patterns, or even to just help to understand it. The inspect function is used here (Figure 8A), which checks for issues common to respirometry data such as non-numeric or missing values.
#inspect a single oxygen column
Insp <-inspect(data, time = 3, oxygen = 8, width = 0.2)
This function also plots the oxygen timeseries and calculates a rolling rate (bottom panel) to help elucidate how this rate may change over the course of the experiment. These rolling rate plots help inform about which regions of those rate curves should be extracted. In the case of standard or routine metabolic rates, the desired regions are those where the rate shows stability (e.g., after around timepoint 3,000; Figure 8B).
Here, declining oxygen only becomes detectable after around row 200 in the full timeseries panel. Patterns such as this are very common in respirometry data; there is often an extended period of instability at the start of an experiment as the system stabilizes and specimen becomes acclimated to the experimental conditions. It is recommended that rates should only be extracted from the timeseries after this initial instability, which also highlights the importance of visualizations.
Extract rates
respR has two functions for extracting respiration rates. The first is the calc_rate() function, which allows a rate to be extracted manually by specifying a region of time, row, or oxygen level. This is very common in respirometry analyses, and a perfectly acceptable method of determining a rate as long as selection criteria are decided upon and applied consistently28.
A more robust and objective way is to use the auto_rate() function, which identifies linear regions of the data. These regions are those of consistently sustained respiration rates, assigned automatically using machine learning. This function is also useful for the detection of low signals (as in the samples used in this current study, due to the low biomass at this age). This function allows for the identification of the most linear, minimum, and maximum rates using independent, objective, and statistically robust methods28. The example here identifies a linear region occurring from around timepoints 3,000 to 5,000. It should be noted that multiple linear regions may be identified, but this section is the highest ranked, or most linear, region (Figure 8C).
#Determine most linear (i.e., consistent) rate
rate <-auto_rate(insp)
Background adjustment
Background rates from control experiments can be determined in a similar manner to the above example, and can be used to adjust the specimen rates using the adjust_rate() function (Figure 9A; note that the full analysis is not shown here, only the adjustment). Full examples are detailed on the respR website.
#Adjust rate for background
rate_adj <-adjust_rate(rate, by = bg) #saved bg object
print(rate_adj)
Convert rates
The final step is to convert the rates to the desired output units, using the original units of the raw data, effective volume of the respirometer, and other experimental data, including normalizing to blank measurements (Figure 9B). The output can be an absolute respiration rate, that is, of the entire specimen, or a mass- or surface area-specific rate. The surface area-specific rate was the output used here, which specifically is the absolute rate divided by the surface area of the specimen (Figure 9C).
As discussed above, this system was developed to measure very small specimens. Therefore, we expected low values and potential overlap with blank measurements. Some level of signal is expected within the blanks, and when examined, these values are within the expected range of general experimental noise, possibly due to probe drift, slight temperatures changes, or bubbles on the probes. By design and due to the small specimen size, and therefore small effective volume used, the use of blanks is particularly important here, especially for each run. Representative values have been included here as an example (Figure 10). Given the small specimen size, we recommend the use of the blanks at each run to standardize measurements per run.
These blank values are then used to standardize treatment measurements values. Given corals respire in addition to producing oxygen, the metabolic rate can range from negative to positive values. An example of representative results of the range of respiration values detected from the micro-respiration tool is given here. These results were determined from a successful experiment on single coral juveniles (Figure 10). Overall, respiration was expected to be difficult to detect in this example dataset (by design), given the small size of the samples; this underscores the value of this method in capturing this low signal threshold. These representative results show respiration in the dark at the smallest specimens sizes tested, underscoring the minimum detection threshold of this system. We also measured under two conditions (control and high temperature stress). After standardizing to the blanks measured per run, values ranged from close to zero (control) to a median of ~-5e-5 for the stress treatment. As expected, respiration was low. These results clearly show representative values for blanks, as well as a control versus high temperature comparison for these very small samples.
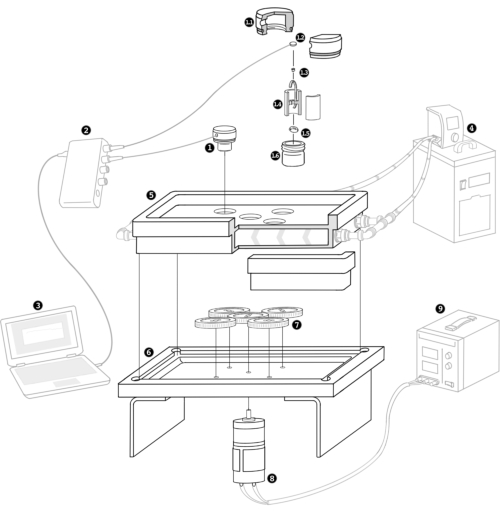
Figure 1: Schematic representation of the new micro-respirometry tool for the physiological characterization of the coral holobiont (coral animal + symbionts) or any small organism (<1 mm). Custom respirometry chambers were made (number 1; 1.1-1.6). These include lids (1.1) with oxygen sensor spots (1.2), and the individual juvenile (1.3) is placed on a flow-through stand (1.4) set atop a magnetic stirrer (1.5), all of which fit within the glass chamber (1.6). The controller (2) is attached to the spot with a fiber optic cable that fits into the lid (1) and connected to the computer (3). The heater/chiller (4) connects to the respirometry plate (5) with the flow-through water (indicated by chevron arrows for direction), which sits on top of the stirrer plate (6) with gears (7), powered by the motor (8) and power supply (9). Please click here to view a larger version of this figure.
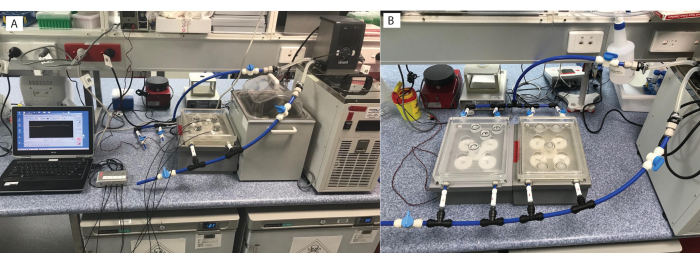
Figure 2: Micro-respirometry setup. Multiple options are available, including (A) one respirometry plate, or (B) connected to multiple plates. Please click here to view a larger version of this figure.

Figure 3: Custom built magnetic stirrer plate on top of respirometry plate. Each chamber has (A) a magnetic stirrer gear underneath, (B) powered by a motor, with (C) the respirometry plate connected by tubing to the heater/chiller. Please click here to view a larger version of this figure.
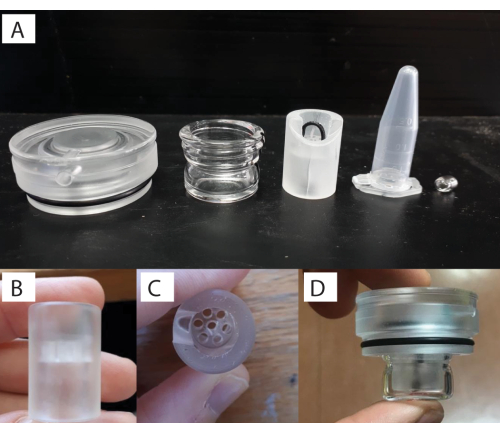
Figure 4: Custom respirometry chamber setup. (A) Components (left to right: lid, glass vial, stand, 1.5 ml tube for scale, and stirrer bar). (B) Individual flow-through stand that the specimen sits within. (C) Top-down view of the flow-through stand. (D) and with the stand placed inside the glass vial with the lid screwed on. Please click here to view a larger version of this figure.
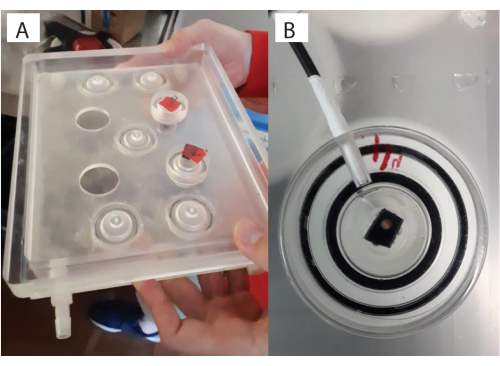
Figure 5: Glass vials placed within the stirrer plate. (A) Custom built stirrer plate with (B) a close-up of the complete glass vial with the lid setup. The juvenile coral can be seen through the lid here (brown dot), on top of the zip-tie, with the fiber optic placed in the lid opening. Please click here to view a larger version of this figure.
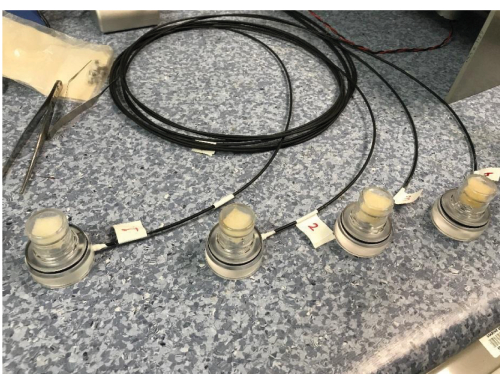
Figure 6: Chambers placed upside down, ready for calibration. Please click here to view a larger version of this figure.
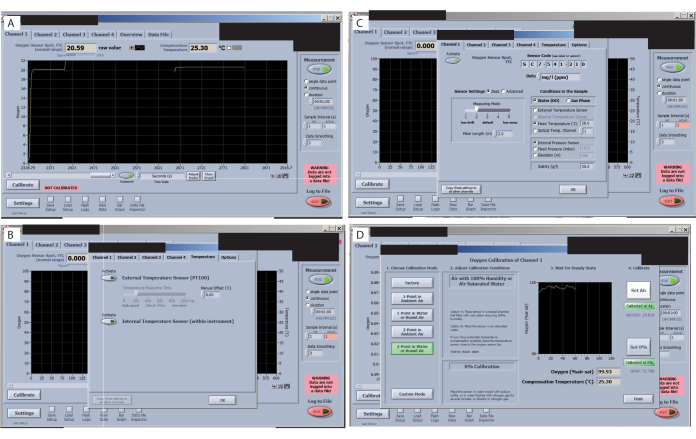
Figure 7: Key steps in the oxygen measurement software. (A) Check the signal of each sensor. An optimal signal for this study and sensors is shown in the oxygen sensor spot FTC (normal range). (B) Check the signal drift. (C) Set and check the treatment temperatures. (D) Set and check the 0% and 100% calibrations. Please click here to view a larger version of this figure.
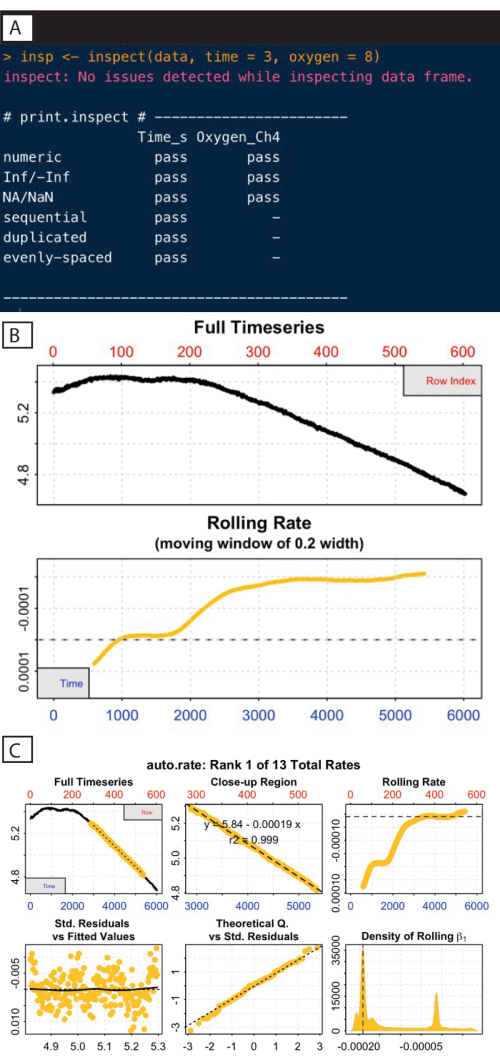
Figure 8: respR analysis output steps I. (A) Inspect the command and output. (B) Check the rate stability. (C) Determine the most linear rate. Please click here to view a larger version of this figure.
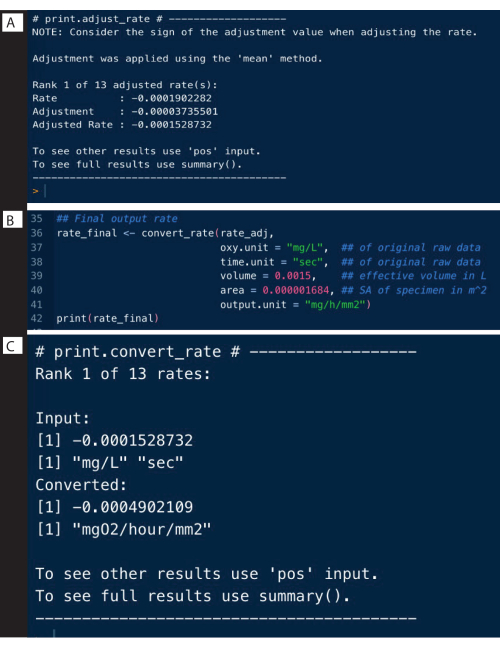
Figure 9: respR analysis output steps II. (A) Adjust the rate for background, (B) Convert and (C) check the rates. Please click here to view a larger version of this figure.
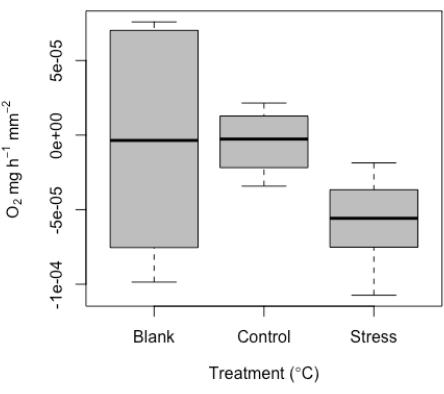
Figure 10: Representative results produced from the micro-respirometry tool. Median respiration (O2 ± standard error) of replicate individual coral juveniles, including blank values as well as respiration of individuals under control and high temperature stress conditions. Please click here to view a larger version of this figure.
Video 1: Top-down view of the respirometry chamber with the juvenile coral inside during a measurement session. Please click here to download this Video.
Table 1: Cost estimates of components of the respirometry apparatus. Please click here to download this Table.
Discussion
This work outlines the construction of a custom-made micro-respirometry setup that can be used to quantify the amount of oxygen consumed and produced by small sessile aquatic organisms. The critical components of this protocol include the setup of the chambers, including the spots, and the calibration of the low signal using the respR package, in which a low signal can be defined as rates typified by shallow or noisy slopes. The custom chamber and its setup allows for the detection of even low signals, whilst the use of the R package helps safeguard against issues in which the occurrence of shallow or noisy slopes could lead to the misinterpretation of results (e.g., false-positives).
Potential modifications that will be needed for other users include the securing of the organism of interest within the custom-made chamber. In this case, a small, rigid zip-tie and aquarium glue were used to secure the single juvenile to the plastic base, which was then glued to the tie. It should be noted that, for this experiment, coral juveniles were settled on black plastic sheeting. This plastic allowed for the easy removal of the coral juveniles, which effectively slid off the plastic, so as not to physically harm them during the removal. Coral juveniles affix to the substrate they settle on, so it is recommended to settle them on similar plastic material, using an artificial peptide16 to facilitate their removal for the gluing process. To further minimize handling stress and impact on the respiration response, it is recommended to allow the corals mounted to zip-ties to acclimate for 1-2 weeks, as is common in many adult coral stress experiments. Other modifications may be needed to secure the organism above the spot in the lid and to allow for water circulation. Another key troubleshooting step involves signal detection, specifically on the slope of the oxygen time-series where rates should be determined. Ultimately, this comes down to a combination of using good judgment to exclude obviously unstable data, and the functions within respR to allow rates to be extracted from either consistently chosen regions or automatically by identifying linear regions of the data. Further examples of how to do this are available on the respR website.
This method was developed to extend measurements of the lower limit of respiration to extremely small, sessile marine invertebrates. The obvious limitation is that this protocol may be more prone to false-positives compared to protocols designed for larger biomasses. However, given this was the point of the design-to measure these lower limits-this has been factored into the design, and the procedure can be used with the respR package to better guard against false-positives. It is also important to acknowledge that other systems exist for measuring respiration30, and the measurement of small organisms, including respirometry on individual copepods31 in smaller volumes than this (~0.5-1 mL), but are either expensive or lack specific components (stirring ability). However, this system is open-source and of relative low-cost compared to commercial systems (e.g., Core Microplate system). This system also incorporates key methodological considerations like stirring, which other systems may lack. The internal stirring bar feature is essential to replicate the natural water mixing of many marine organisms (e.g., copepods via swimming), that is often not possible and may render the data largely unusable. In contrast, other mixing methods available involve placing the whole respirometer on a giant rocker bench, which requires additional equipment and has limited success in mixing, or mixing via vibration, which can cause disturbance to the organism. For this reason, this is the only system that can perform respirometry on juvenile corals or other very small sessile organisms. For reference, the size range of the specimens included here ranged from 2.1 to 3.6 polyps (corresponding to only a few months old), with a minimum to maximum mean area of 1.3 to 4.5 mm2.
Respirometry is a fundamental measure in ecological studies, and many methods exist for this purpose. Most of these existing methods, however, target high biomass samples, including whole fish, coral fragments, or seagrasses32,33,34. This method is the first to use individual coral juveniles. In addition, there are many potential applications for this method, as it provides key physiological information about the functioning of the organism. This can be important for studies looking to characterize baseline health estimates35, understand the role of acute or long-term stress during coral ontogeny such as heat stress36, or to provide thresholds which managers can set to help protect and improve the health of coral reefs37. Given that the coral is a holobiont and the symbiont community is relatively flexible at this stage and throughout the first year of life38, it would be interesting to pair respirometry data with changes in communities over time, to fully contextualize the functioning of the organism as a whole. Importantly, this method contributes to 'open science' techniques that help to provide an outline for creating custom experimental setups that can be shared, improved, and standardized openly.
Açıklamalar
The authors have nothing to disclose.
Acknowledgements
The authors would like to thank Sam Noonan for his help and advice, Sven Uthicke for the use of the initial respirometry chambers, Ben Shelab for his engineering illustration, and the Australian Institute of Marine Science workshop for bespoke machining of respirometry chamber adaptors and holders. The corals were collected under the following Great Barrier Reef Marine Park permit to AIMS G12/ 35236.1. Corals do not require ethics permits.
Materials
| Cost | |||
| (1.1 – 1.6) Custom respirometry chambers | LabGlass Party Ldt. | 1.5 ml | $407.26 |
| 1.1 lids | AIMS workshop | Vial GL25 thread | ~$10 |
| 1.2 fiber-optics spots (FireStingO2 II fiberoptic optodes) | PyroScience | Oxygen sensor spots, 125 µm PET foil, Ø5 mm, with optical isolation, SN: 183801947 | $41.25 AUD each |
| 1.3 individual organism | NA | NA | NA |
| 1.4 flow-through stand | AIMS workshop | Custom | included in points 5 and 6 price (the workshop gave me an estimate of the lids, stand with gears, motor, incubation flow through |
| 1.5 magnetic stirrer | Any manufactuer is suitable | NA | ~$2? |
| 1.6 glass chamber (vial GL25 thread x 20 mm high, with bump/ridge, flat-ground rim, screw cap with hole, Labglass Pty Ltd, Stafford QLD) | Labglass Pty Ltd, Stafford QLD | Vial GL25 thread x 20 mm high, with bump/ridge, flat-ground rim, screw cap with hole | $50.9 AUD |
| 2 FireSting controller (2) | PyroSciences | NA | 4 sensors is 4000 Euros. 8 sensors used here. |
| 3 computer | NA | NA | NA |
| 4 heater/chiller | VWR International | NA | Small models around $4,000 AUD |
| 5 respirometry plate platform | AIMS workshop | 34 cm x 26 cm x 3 cm (although any dimensions are adequate to fit desired number of chambers) | $1250 AUD |
| 6 stirrer plate with gears (7) | AIMS workshop | 34 cm x 26 cm x 3 cm | $1250 AUD |
| 8 powered by the motor | AIMS workshop | Custom | $700 AUD |
| 9 power supply | Non-specific | NA | ~$300 AUD |
| Aquarium glue | Seachem reef glue | 20g | $14 |
| Oxygen Logger Software | PyroScience | NA | NA |
| Polypipe and connectors | John Guest | NA | $20 |
| Sodium Sulfite | Sigma | S0505-250G (CAS number 7757-83-7) | $54 |
Referanslar
- Quigley, K. M. A fast, precise, in-vivo method for micron-level 3D models of corals using dental scanners. Methods in Ecology and Evolution. 13 (10), 2159-2166 (2022).
- Svendsen, M. B. S., Bushnell, P. G., Steffensen, J. F. Design and setup of intermittent-flow respirometry system for aquatic organisms. Journal of Fish Biology. 88 (1), 26-50 (2016).
- Lighton, J. R. B. . Measuring Metabolic Rates: a Manual for Scientists. , (2018).
- Carey, N., Harianto, J., Byrne, M. Sea urchins in a high-CO2 world: partitioned effects of body size, ocean warming and acidification on metabolic rate. The Journal of Experimental Biology. 219 (Pt 8), 1178-1186 (2016).
- Clark, T. D., Sandblom, E., Jutfelt, F. Aerobic scope measurements of fishes in an era of climate change: respirometry, relevance and recommendations. The Journal of Experimental Biology. 216 (Pt 15), 2771-2782 (2013).
- Voolstra, C. R., et al. Extending the natural adaptive capacity of coral holobionts. Nature Reviews Earth & Environment. 2 (11), 747-762 (2021).
- Hoegh-Guldberg, O. Climate change, coral bleaching and the future of the world’s coral reefs. Marine and Freshwater Research. 50 (8), 839-866 (1999).
- Morris, L. A., Voolstra, C. R., Quigley, K. M., Bourne, D. G., Bay, L. K. Nutrient availability and metabolism affect the stability of coral-symbiodiniaceae symbioses. Trends in Microbiology. 27 (8), 678-689 (2019).
- Yellowlees, D., Rees, T. A. V., Leggat, W. Metabolic interactions between algal symbionts and invertebrate hosts. Plant, Cell & Environment. 31 (5), 679-694 (2008).
- Rädecker, N., et al. Using Aiptasia as a model to study metabolic interactions in cnidarian-Symbiodinium symbioses. Frontiers in Physiology. 9, 214 (2018).
- Matthews, J. L., et al. Optimal nutrient exchange and immune responses operate in partner specificity in the cnidarian-dinoflagellate symbiosis. Proceedings of the National Academy of Sciences. 114 (50), 13194-13199 (2017).
- Davy, S. K., Allemand, D., Weis, V. M. Cell biology of cnidarian-dinoflagellate symbiosis. Microbiology and Molecular Biology Reviews. 76 (2), 229-261 (2012).
- Weis, V. M. Cellular mechanisms of Cnidarian bleaching: stress causes the collapse of symbiosis. The Journal of Experimental Biology. 211 (Pt 19), 3059-3066 (2008).
- Baker, D. M., Freeman, C. J., Wong, J. C. Y., Fogel, M. L., Knowlton, N. Climate change promotes parasitism in a coral symbiosis. The ISME Journal. 12 (3), 921-930 (2018).
- Chakravarti, L. J., van Oppen, M. J. H. Experimental evolution in coral photosymbionts as a tool to increase thermal tolerance. Frontiers in Marine Science. 5, 227 (2018).
- Quigley, K. M., Alvarez Roa, C., Beltran, V. H., Leggat, B., Willis, B. L. Experimental evolution of the coral algal endosymbiont, Cladocopium goreaui: lessons learnt across a decade of stress experiments to enhance coral heat tolerance. Restoration Ecology. 29 (3), e13342 (2021).
- Buerger, P., et al. Heat-evolved microalgal symbionts increase coral bleaching tolerance. Science Advances. 6 (20), eaba2498 (2020).
- Bieri, T., Onishi, M., Xiang, T., Grossman, A. R., Pringle, J. R. Relative contributions of various cellular mechanisms to loss of algae during cnidarian bleaching. PLoS One. 11 (4), e0152693 (2016).
- Tremblay, P., Gori, A., Maguer, J. F., Hoogenboom, M., Ferrier-Pagès, C. Heterotrophy promotes the re-establishment of photosynthate translocation in a symbiotic coral after heat stress. Scientific Reports. 6, 38112 (2016).
- Tremblay, P., Grover, R., Maguer, J. F., Hoogenboom, M., Ferrier-Pagès, C. Carbon translocation from symbiont to host depends on irradiance and food availability in the tropical coral Stylophora pistillata. Coral Reefs. 33 (1), 1-13 (2014).
- Wooldridge, S. A. Is the coral-algae symbiosis really ‘mutually beneficial’ for the partners. Bioessays. 32 (7), 615-625 (2010).
- Wooldridge, S. A. Breakdown of the coral-algae symbiosis: towards formalising a linkage between warm-water bleaching thresholds and the growth rate of the intracellular zooxanthellae. Biogeosciences. 10 (3), 1647-1658 (2013).
- Coles, S. L., Jokiel, P. L. Effects of temperature on photosynthesis and respiration in hermatypic corals. Marine Biology. 43, 209-216 (1977).
- Marubini, F., Davies, P. S. Nitrate increases zooxanthellae population density and reduces skeletogenesis in corals. Marine Biology. 127, 319-328 (1996).
- Iglesias-Prieto, R., Matta, J. L., Robins, W. A., Trench, R. K. Photosynthetic response to elevated temperature in the symbiotic dinoflagellate Symbiodinium microadriaticum in culture. Proceedings of the National Academy of Sciences. 89 (21), 10302-10305 (1992).
- Karako-Lampert, S., Katcoff, D. J., Achituv, Y., Dubinsky, Z., Stambler, N. Responses of Symbiodinium microadriaticum clade B to different environmental conditions. Journal of Experimental Marine Biology and Ecology. 318 (1), 11-20 (2005).
- Blanckaert, A. C. A., Reef, R., Pandolfi, J. M., Lovelock, C. E. Variation in the elemental stoichiometry of the coral-zooxanthellae symbiosis. Coral Reefs. 39, 1071-1079 (2020).
- Harianto, J., Carey, N., Byrne, M. respR-An R package for the manipulation and analysis of respirometry data. Methods in Ecology and Evolution. 10 (6), 912-920 (2019).
- Gamble, S., Carton, A. G., Pirozzi, I. Open-top static respirometry is a reliable method to determine the routine metabolic rate of barramundi. Lates calcarifer. Marine and Freshwater Behaviour and Physiology. 47 (1), 19-28 (2014).
- Burford, B. P., et al. Rapid range expansion of a marine ectotherm reveals the demographic and ecological consequences of short-term variability in seawater temperature and dissolved oxygen. The American Naturalist. 199 (4), 523-550 (2022).
- Morozov, S., McCairns, R. J. S., Merilä, J. FishResp: R package and GUI application for analysis of aquatic respirometry data. Conservation Physiology. 7 (1), coz003 (2019).
- Leclercq, N., Gattuso, J. -. P., Jaubert, J. Primary production, respiration, and calcification of a coral reef mesocosm under increased CO2 partial pressure. Limnology and Oceanography. 47 (2), 558-564 (2002).
- Anthony, K. R. N., Hoegh-Guldberg, O. Variation in coral photosynthesis, respiration and growth characteristics in contrasting light microhabitats: an analogue to plants in forest gaps and understoreys. Functional Ecology. 17, 246-259 (2003).
- Moulin, L., et al. Long-term mesocosms study of the effects of ocean acidification on growth and physiology of the sea urchin Echinometra mathaei. Marine Environmental Research. 103, 103-114 (2015).
- Quigley, K. M., Bay, L. K., van Oppen, M. J. H. Genome-wide SNP analysis reveals an increase in adaptive genetic variation through selective breeding of coral. Molecular Ecology. 29 (12), 2176-2188 (2020).
- Brunner, C. A., Ricardo, G. F., Uthicke, S., Negri, A. P., Hoogenboom, M. O. Effects of climate change and light limitation on coral recruits. Marine Ecology Progress Series. 690, 65-82 (2022).
- Quigley, K. M., Alvarez Roa, C., Torda, G., Bourne, D., Willis, B. L. Co-dynamics of Symbiodiniaceae and bacterial populations during the first year of symbiosis with Acropora tenuis juveniles. MicrobiologyOpen. 9 (2), e959 (2020).
- Quigley, K. M., Bay, L. K., Torda, G., Willis, B. L. Leveraging new knowledge of Symbiodinium community regulation in corals for conservation and reef restoration. Marine Ecology Progress Series, 600. , 245-253 (2018).

