Assessment of Spatial Lingual Tactile Sensitivity using a Gratings Orientation Test
Özet
This work illustrates a standard procedure and threshold determination by the R-index to assess spatial lingual tactile sensitivity using a gratings orientation test.
Abstract
Individual thresholds by R-index estimates are calculated using a gratings orientation test (6 different tools of increasing grating size from 0.20-1.25 mm) to assess spatial lingual tactile sensitivity. During the experiment, the subjects are blindfolded and asked to specify the orientation of the grating (either horizontal or vertical) placed on the tongue. R-index is based on Signal Detection Theory (SDT), and it is an estimated probability of correctly identifying a target stimulus (the signal, e.g., the correct orientation) compared to an alternative stimulus (the noise, e.g., the incorrect orientation). Once the R-index values for each subject and each tool dimension are calculated, it is possible to derive the individual threshold by interpolating the two R-indices immediately below and above the established cut-off (typically 75%) based on one-sided R-index critical values. This procedure can be helpful in the medical field to study the association between oral tactile sensitivity, speech clarity, and swallowing disorders, as well as in sensory and consumer studies to explore individual variation in texture perception, food preferences, and eating behavior.
Introduction
The texture and mouthfeel of food play an important role in liking1,2,3,4, and while research has found differences in texture perception due to factors such as chewing behavior2,5, saliva flow, and composition6,7, there are limited methods available to assess variation in oral tactile receptors (mechanoreceptors). The oral cavity houses different types of mechanoreceptors found in the mouth: Merkel receptors, Ruffini cylinders, and Meissner corpuscles8. Mechanoreceptors can be classed into two groups: slowly adapting and rapidly adapting. Slowly adapting mechanoreceptors (Ruffini cylinders and Merkel receptors) produce signals continuously while being stimulated. In contrast, rapidly adapting mechanoreceptors (Meissner's corpuscles) respond to the beginning and end of stimulation with a signal. Tactile acuity varies widely across tongue surfaces and between individuals, possibly due to differences in mechanoreceptor sensitivity. The location and the number of mechanoreceptors in the oral cavity, the differences in the spatial arrangement/density of the mechanoreceptors (spatial acuity), or the differences in their sensitivity when activated could be the cause of this intra- and inter-individual variability. Several methods to evaluate and screen for variation in mechanoreceptor sensitivity in the oral cavity have been published, including von Frey filaments9,10, letter recognition11,12, grating orientation tests13, and flexible electrode array14,15. The gratings orientation test requires square gratings (Figure 1, Figure 2) with different groove widths to be placed on the tongue of a blindfolded subject. They indicate if subjects perceive the gratings to be in either a horizontal or vertical orientation. Responses are used to calculate average thresholds based on the subject's ability to discriminate the orientation for the different grating sizes.
Protocol
An informed, written consent has been signed by all participants. This study was approved by the Ethics Committee of the University of Milan (n. 48/19) and conducted in accordance with the Declaration of Helsinki.
1. Training of experimenters
- Take the grating tool and apply a force of 100 g on a sponge placed on a scale.
NOTE: Refer to Figure 1 for the schematic of the grating tool used in this study - Repeat this procedure at least 10 times to reduce variation in the force applied by the grating on the subjects' tongues during testing, both within and across experimenters.
2. Assessment procedure
NOTE: Conduct the assessment of tactile acuity following the required health and safety standard to guarantee the subject's safety (e.g., mask, gloves, and lab coat).
- Display all gratings (0.20 mm, 0.25 mm, 0.50 mm, 0.75 mm, 1.00 mm, 1.25 mm) (Figure 2) on a table out of sight of the participant.
- Seat the participant in a comfortable chair and inform them that they can leave the experiment at any time.
- Inform the participant that they will be blindfolded during the experiment and asked to stick out their tongue in a comfortable and relaxed way.
- Prior to the beginning of the experiment, familiarize the subjects with the procedure using the largest grating (1.25 mm) to demonstrate the force applied (100 g for 3 s).
- Notify the participants that they can take a sip of water whenever deemed appropriate.
- Apply each grating onto the subjects' tongue (anterior region of the tongue just around the midline).
- After each touch, ask the subjects to indicate, using their hands, the tool's orientation (either horizontal or vertical) and their degree of sureness (sure, unsure). Subjects must guess if they do not know.
- After each touch, record all the answers (horizontal, vertical, sure, not sure) for each subject on a spreadsheet (Supplemental Table 1).
- Repeat each grating as many times as deemed necessary for the R-Index cut-off selected, for instance, 6 times, 3 horizontally, and 3 vertically (Supplemental Table 1).
- Sterilize each grating after testing each participant (refer to section 4).
NOTE: The tongue should protrude gently from the mouth without effort by the volunteers to avoid excessive fatigue, which would lead to an alteration in their performance results. It is important to note that the higher the repetitions by grating, the more reliable the measurement16.
3. Cleaning protocol
- Prepare a solution consisting of 20 mL of sodium hypochlorite (see Table of Materials) diluted in 1 L of water according to the manufacturer's instructions.
- Manually shake the solution for a few seconds.
- Fill 6 cups with approximately 20 mL of the disinfectant solution to fully immerse each tool in the solution.
- Place each tool in the corresponding cup.
- Let the tools soak for 15-20 min.
- Rinse the tools with plenty of water according to the manufacturer's instructions and scrub them with a toothbrush to ensure removing any sodium hypochlorite residue.
- Allow the tools to air dry.
4. R-index calculation
- Create a response matrix for each volunteer and for all the tools (Figure 3) based on the response frequencies used to calculate the R-index using the following equation:

NOTE: R-index expresses individual tactile sensitivity for each tool16. R- index is based on SDT17 and represents an estimated probability of discerning a target stimulus (i.e., the signal) from an alternative stimulus (i.e., the noise). The signal and the noise correspond to the correct or incorrect identification of the horizontal-vertical orientation of the grating. Four response options for both signal and noise can occur: "horizontal-sure", "horizontal-unsure", "vertical-unsure" and "vertical-sure"16. R-index values range between 0-1. A higher R-index value indicates better discrimination.
5. Sensitivity and threshold determination by the R-index estimates
- To determine whether a subject can discriminate the orientation of each tool, calculate the cut-off using a table of critical values for R-index significance tests18
NOTE: Considering the present example, corresponding to 36 presentations (i.e., each grating presented 6 times, 3 horizontal and 3 vertical), the cut-off value for discrimination is set to 0.7426 according to the one-sided R-index critical values for α = 0.0518. - If a sufficiently high number of tools is used (e.g., six different grating dimensions)19, derive R-index threshold estimations.
- To calculate the threshold for each subject, interpolate the two R-indices immediately below and above of the cut-off value20.
Representative Results
A total of 70 healthy adults (age range = 19-33 years; mean age = 22.0; 52.9% women) were involved in the study, as shown in Appiani et al. (2020)21.
As an example, the R-index distribution by age for square 0.75 mm is reported in Figure 4. Each point represents a different subject. Subjects above the dotted line (cut-off value: 0.7426) are those who correctly identify the orientation of the grating (more sensitive).
The performance for the six gratings and the derived R-index threshold estimate of one subject is reported in Figure 5. In this case, the threshold corresponds to 0.99 mm. Subjects with low threshold values are able to recognize a smaller bar size (more sensitive), while subjects with high threshold values require more input (larger bar size) to perceive the stimulus cognitively (less sensitive)10. In the present case, threshold values can range from 0.20-1.25 mm. Nevertheless, two extreme values can be achieved: subjects with a threshold <0.20 mm are those able to recognize the orientation of the squares from the smallest size (0.20 mm). Conversely, those participants who record a threshold >1.25 mm are unable to discriminate any of the grating sizes. An example of a threshold dataset is reported in Supplemental Table 2.
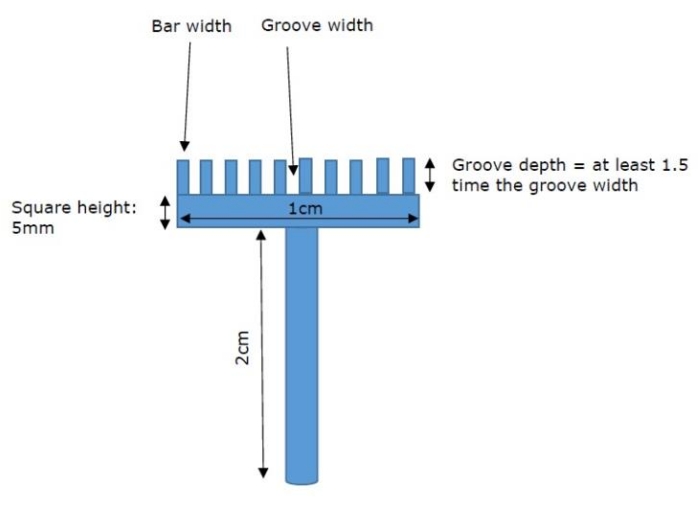
Figure 1: Description of the tools. Square schematic drawing Please click here to view a larger version of this figure.
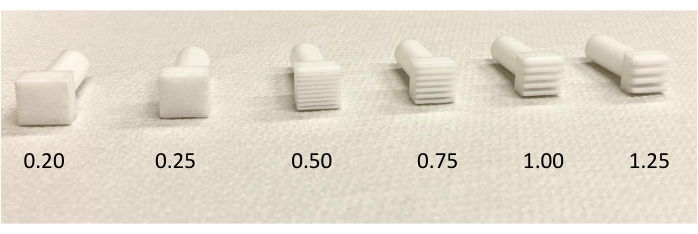
Figure 2: Squares with increasing-sized grooves/bars. The figure shows the six gratings, ranging from the smallest (0.20 mm) to the largest (1.25 mm). Please click here to view a larger version of this figure.
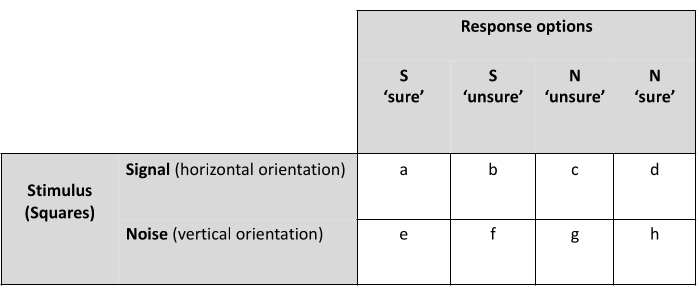
Figure 3: Response matrix. The figure shows the response matrix used to calculate the R index. Signal (S) and noise (N) correspond to the horizontal and vertical orientation, respectively. Letter from "a" to "h" are integers taking values between 0 and 3. Please click here to view a larger version of this figure.
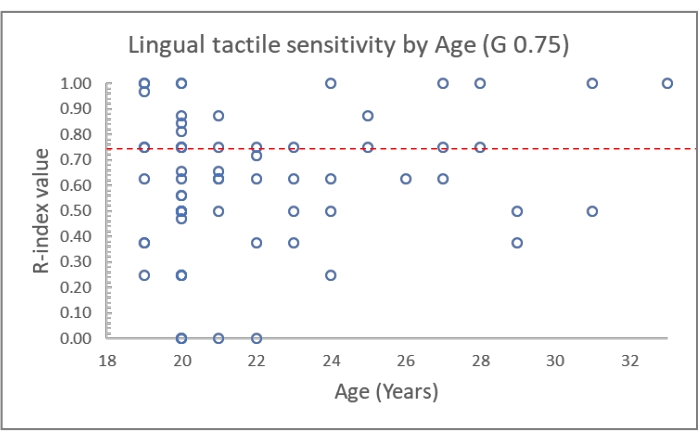
Figure 4: R-index distribution by age for square 0.75 mm. The dotted line represents the cut-off value (0.7426). Subjects that are above the dotted line are those that correctly identify the orientation of the tool. Please click here to view a larger version of this figure.
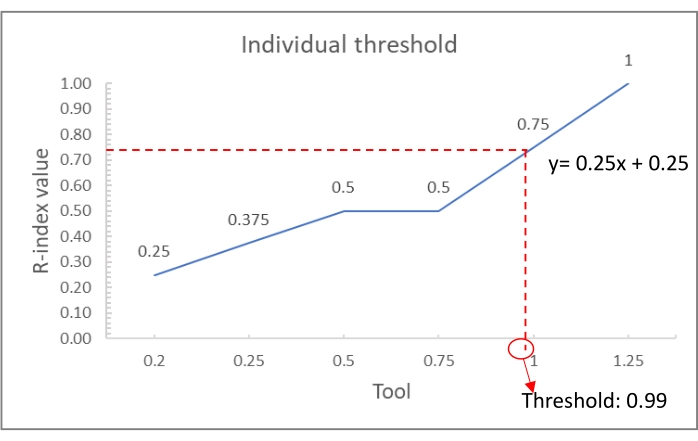
Figure 5: Individual threshold calculation. R-index values of one subject and calculation of the relevant threshold. Please click here to view a larger version of this figure.
Supplemental Table 1: An example of a spreadsheet used by the experimenters to record the participants' responses. The first column (Trial No.) represents the number of presentations; as an example, 36 possible presentations are reported. The second column (combination) indicates the size of the grating (G) and the orientation (HORIZ./VERT.). The investigator reports the subject's answer in the column "Answer" (Horizontal/Vertical) and indicates the degree of sureness using the last column (Sure/Unsure). Please click here to download this Table.
Supplemental Table 2: The dataset used to calculate individual thresholds. The first three columns report the identification code, the age, and the gender for each subject. Columns 4-9 report the R-index values for each tool. In bold are reported the values immediately above and below the cut-off that have been used for the calculation of individual thresholds through interpolation (last column). Please click here to download this Table.
Discussion
Few valid instruments are available for measuring tactile acuity10,11,13,22. Von Frey filaments have been shown to be an adequate method for measuring both skin and oral tactile acuity10,21,22. However, these instruments measure a different dimension of lingual tactile acuity than the gratings orientation test21. Von Frey filaments measure contact detection while gratings spatial resolution sensitivity. These two different sensory functions are subserved by different neural mechanisms23,24,25.
Other known tools are the JVP domes (Stoelting Co, Wood Dale, IL, USA), which are very similar to those used in the present procedure. However, these tools are mainly used to measure tactile acuity of the skin, as they have lower sensitivity (from 0.35-3.00 mm) than the average spatial resolution at the tongue (0.58 mm)13. For this reason, Appiani et al. (2020)21 evaluated the cognitive and perceptive suitability of the custom-made gratings used in this protocol, which have additional groove widths of less than 0.50 mm (i.e., 0.20 and 0.25 mm) in order to include a range of dimensions more suitable for the assessment of oral tactile sensitivity21. The tool consists of polytetrafluoroethylene machine-cut square blocks of 1 cm2 engraved with gratings on their surface. Each square has a 5 mm height and is held by a narrow cylindrical rod (2 cm long) (Figure 1). Both the bar size and the distance between each bar (the groove width) vary across squares but are consistent within a square. The groove depth increases by 1.5 times the groove width to ensure that the tongue does not touch the bottom of the square during testing13. The number of squares used to evaluate subjects' sensitivity can vary, as can the size of the bars, but previous research has found that six squares that vary in the smallest bar sizes, ranging from 0.20 mm to 1.25 mm, are needed to provide discrimination across individuals for the tongue13,24 (Figure 2).
In the present procedure, the calculation of an index (the R-index) to assess the oral discrimination of a specific grating size is suggested. Furthermore, if the number of tools is large enough (e.g., six tools), the present procedure reports the calculation of individual thresholds in accordance with Robinson and colleagues20.
This protocol shows a valid, easy, and fast way of measuring tactile acuity at the level of the tongue. However, some challenges that can affect the reliability of the test should be pointed out21. In general, the instruments' reliability can be affected by the experimenter. Therefore, careful training and calibration of the experimenters should be guaranteed to exert a consistent and standardized force on the subject's tongue. In addition, the involuntary movements of the lingual muscle and the dryness of the lingual surface can affect the measurements. Thus, the volunteers who have to hold their tongues outstretched for a relatively long time are requested to concentrate considerably. The occurrence of these limitations varies greatly across individuals. However, it can be reduced by suggesting that the subjects keep the tongue relaxed between the teeth and lips and possibly place the chin on the hands. Moreover, volunteers are invited to stop several times during the test to drink some water.
Future studies could look in-depth at the association between individual lingual tactile acuity, food preferences, food choices, and nutritional status. This protocol may also be useful in a clinical setting to study vulnerable populations with swallowing or oral cavity disorders.
Açıklamalar
The authors have nothing to disclose.
Acknowledgements
We acknowledge all the participants, volunteers, and others involved in the study. We are grateful to Sandra Stolzenbach Wæhrens and Wender Bredie (University of Copenhagen) for designing the squares used in the present gratings orientation test. This research was funded by the University of Milan, Piano di sostegno alla ricerca 2018.
Materials
| Custom-made squares | University of Reading; University of Copenhagen | Squares of 1 cm2 from polytetrafluoroethylene (PTFE) | |
| Disinfenctant solution (20% sodium hypochlorite) | Amuchina, Angelini S.p.A., Roma, Italy | ||
| Eye masks | Various | ||
| Gloves | Various | ||
| Lab coat | Various | ||
| Plastic cup for drinking water | Various | ||
| Excel | Microsoft |
Referanslar
- Guinard, J. X., Mazzucchelli, R. The sensory perception of texture and mouthfeel. Trends in Food Science & Technology. 7 (7), 213-219 (1996).
- Jeltema, M., Beckley, J., Vahalik, J. Food texture assessment and preference based on mouth behavior. Food Quality and Preference. 52, 160-171 (2016).
- Scott, C. L., Downey, R. G. Types of food aversions: animal, vegetable, and texture. The Journal of Psychology. 141 (2), 127-134 (2007).
- Laureati, M., et al. Individual differences in texture preferences among European children: Development and validation of the Child Food Texture Preference Questionnaire (CFTPQ). Food Quality and Preference. 80, 103828 (2020).
- de Lavergne, M. D., Derks, J. A., Ketel, E. C., de Wijk, R. A., Stieger, M. Eating behaviour explains differences between individuals in dynamic texture perception of sausages. Food Quality and Preference. 41, 189-200 (2015).
- Engelen, L., de Wijk, R. A. Oral processing and texture perception. Food Oral Processing: Fundamentals of Eating and Sensory Perception. 8, 157-176 (2012).
- Stokes, J. R., Boehm, M. W., Baier, S. K. Oral processing, texture and mouthfeel: From rheology to tribology and beyond. Current Opinion in Colloid & Interface Science. 18 (4), 349-359 (2013).
- Engelen, L. Oral receptors. Food Oral Processing: Fundamentals of Eating and Sensory Perception. , 15-38 (2012).
- Yackinous, C., Guinard, J. X. Relation between PROP taster status and fat perception, touch, and olfaction. Physiology & Behavior. 72 (3), 427-437 (2001).
- Etter, N. M., Breen, S. P., Alcala, M. I., Ziegler, G. R., Hayes, J. E. Assessment of midline lingual point-pressure somatosensation using Von Frey hair monofilaments. Journal of Visualized Experiments: JoVE. (156), (2020).
- Essick, G. K., Chen, C. C., Kelly, D. G. A letter-recognition task to assess lingual tactile acuity. Journal of Oral and Maxillofacial Surgery. 57 (11), 1324-1330 (1999).
- Essick, G. K., Chopra, A., Guest, S., McGlone, F. Lingual tactile acuity, taste perception, and the density and diameter of fungiform papillae in female subjects. Physiology & Behavior. 80 (2-3), 289-302 (2003).
- Van Boven, R. W., Johnson, K. O. The limit of tactile spatial resolution in humans: grating orientation discrimination at the lip, tongue, and finger. Neurology. 44 (12), 2361 (1994).
- Moritz, J., Turk, P., Williams, J. D., Stone-Roy, L. M. Perceived intensity and discrimination ability for lingual electrotactile stimulation depends on location and orientation of electrodes. Frontiers in Human Neuroscience. 11, 186 (2017).
- Bach-y-Rita, P., Kaczmarek, K. A., Tyler, M. E., Garcia-Lara, J. Form perception with a 49-point electrotactile stimulus array on the tongue: a technical note. Journal Of Rehabilitation Research and Development. 35, 427-430 (1998).
- O’Mahony, M. Understanding discrimination tests: A user-friendly treatment of response bias, rating and ranking R-index tests and their relationship to signal detection. Journal of Sensory Studies. 7 (1), 1-47 (1992).
- Lee, H. S., Van Hout, D. Quantification of sensory and food quality: The R-index analysis. Journal of Food Science. 74 (6), 57-64 (2009).
- Bi, J., O’Mahony, M. Updated and extended table for testing the significance of the R-index. Journal of Sensory Studies. 22, 713-720 (2007).
- Bertoli, S., et al. Taste sensitivity, nutritional status and metabolic syndrome: Implication in weight loss dietary interventions. World Journal of Diabetes. 5 (5), 717 (2014).
- Robinson, K. M., Klein, B. P., Lee, S. Y. Utilizing the R-index measure for threshold testing in model caffeine solutions. Food Quality and Preference. 16 (4), 283-289 (2005).
- Appiani, M., Rabitti, N. S., Methven, L., Cattaneo, C., Laureati, M. Assessment of lingual tactile sensitivity in children and adults: Methodological suitability and challenges. Foods. 9 (11), 1594 (2020).
- Cattaneo, C., Liu, J., Bech, A. C., Pagliarini, E., Bredie, W. L. Cross-cultural differences in lingual tactile acuity, taste sensitivity phenotypical markers, and preferred oral processing behaviors. Food Quality and Preference. 80, 103803 (2020).
- Abraira, V. E., Ginty, D. D. The sensory neurons of touch. Neuron. 79 (4), 618-639 (2013).
- Johnson, K. O., Phillips, J. R. Tactile spatial resolution. I. Two-point discrimination, gap detection, grating resolution, and letter recognition. Journal of Neurophysiology. 46 (6), 1177-1192 (1981).
- Phillips, J. R., Johnson, K. O. Tactile spatial resolution. II. Neural representation of bars, edges, and gratings in monkey primary afferents. Journal of Neurophysiology. 46 (6), 1192-1203 (1981).

