Magnetic Adjustment of Afterload in Engineered Heart Tissues
Özet
This protocol provides detailed methods describing the fabrication and implementation of a magnetics-based afterload tuning platform for engineered heart tissues.
Abstract
Afterload is known to drive the development of both physiological and pathological cardiac states. As such, studying the outcomes of altered afterload states could yield important insights into the mechanisms controlling these critical processes. However, an experimental technique for precisely fine-tuning afterload in heart tissue over time is currently lacking. Here, a newly developed magnetics-based technique for achieving this control in engineered heart tissues (EHTs) is described. In order to produce magnetically responsive EHTs (MR-EHTs), the tissues are mounted on hollow silicone posts, some of which contain small permanent magnets. A second set of permanent magnets is press-fit into an acrylic plate such that they are oriented with the same polarity and are axially-aligned with the post magnets. To adjust afterload, this plate of magnets is translated toward (higher afterload) or away (lower afterload) from the post magnets using a piezoelectric stage fitted with an encoder. The motion control software used to adjust stage positioning allows for the development of user-defined afterload regimens while the encoder ensures that the stage corrects for any inconsistencies in its location. This work describes the fabrication, calibration, and implementation of this system to enable the development of similar platforms in other labs around the world. Representative results from two separate experiments are included to exemplify the range of different studies that can be performed using this system.
Introduction
Afterload is the systolic load on the ventricle after it has begun to eject blood1. During cardiac development, an appropriate afterload is of critical importance for cardiomyocyte maturation2. In adulthood, low levels of ventricular afterload (e.g., in bedridden patients with high-level spinal cord injury3 or in very special cases like spaceflight4) can result in hypotrophy of the heart. Conversely, high afterload can lead to cardiac hypertrophy5. While cardiac hypertrophy in endurance athletes or pregnant women is considered beneficial and physiological, hypertrophy associated with long-term arterial hypertension or severe aortic valve stenosis is detrimental as it predisposes one to cardiac arrhythmias and heart failure6. Although the 5-year mortality rate for heart failure patients has reduced from ~70% in the 1980s6 to 40–50%7 presently, there is still a great need for new therapeutic treatment options for this highly prevalent condition (currently 2.2% of the population in the Western world)8.
In order to investigate the molecular mechanisms of pathological cardiac hypertrophy and to test preventive or therapeutic strategies for treating this disease, in vivo models of afterload have been developed9,10,11,12. While these models have offered beneficial insights into the effects of afterload on ventricular performance, they do not allow for fine control over afterload magnitude. Alternatively, in vitro studies of afterload performed on excised hearts and muscle preparations allow for finer control over tissue loading, but these models are not conducive to longitudinal studies13,14,15.
To overcome these issues, we developed an in vitro model of elevated afterload in engineered heart tissues (EHTs)16,17. This model is a 3-dimensional culture format for rat heart cells embedded in a fibrin matrix suspended between flexible hollow silicone posts. These tissues beat spontaneously (against the resistance of the silicone posts) and perform auxotonic work. We have increased afterload applied to EHTs by a factor of 12 in previous experiments by the insertion of rigid metal braces into the hollow silicone posts for one week. This led to a multitude of changes, characteristic of pathological cardiac hypertrophy18,19,20: cardiomyocyte hypertrophy, partial necroptosis, a decline in contractile force, the impairment of tissue relaxation, reactivation of the fetal gene program, a metabolic shift from fatty acid oxidation to anaerobic glycolysis, and an increase in fibrosis. Though this procedure has been successfully employed in several studies17,21,22, it has some disadvantages. There are only two states, low or very high (12-fold) afterload, and the procedure requires manual handling of the EHTs, which limits its temporal flexibility and poses the risk of contamination.
Recently, Leonard et al. used a similar technique to modulate afterload in EHTs cultured on silicone posts23. Braces of varying lengths were placed around the outside of the posts to restrict their bending motion. The authors of this study reported that a singular small-to-medium increase in load enhanced force development and maturation of human iPS-derived EHTs, while higher loads resulted in a pathological state. However, similar to our own system, this technique only allows for singular increases in afterload, the magnitude of which is dictated by the length of the braces. As such, fine alterations in afterload, modifications in afterload over time, and precise loading regimens are not possible with these techniques.
Here, we provide the protocol for a system that can be used to modulate post-resistance, i.e., afterload of EHTs magnetically24. This platform facilitates the fine-tuning of afterload, enables user-defined afterload regimens, and ensures EHT sterility.
Protocol
1. Preparation of the Afterload Tuning Platform
NOTE: The steps involved in this portion of the protocol are not time-sensitive.
- Manufacturing the magnetically responsive silicone racks
NOTE: These racks serve as the culture platform for EHTs. Each EHT is suspended between two silicone posts, which impart afterload to the tissue. The degree of afterload is directly related to the stiffness of these posts. To enable magnetic afterload tuning, some of the posts need to be magnetically responsive.- Acquire 24-well plate compatible racks of silicone posts (dimensions given in Supplementary Figure 1). The racks used in this study were produced by a commercial silicone goods supplier according to these dimensions using silicone with a shore hardness of 40.
- Determine the polarity of the post magnets (e.g., d = 0.5 mm, h = 2.0 mm; see Table of Materials) by placing them on a larger permanent magnet.
- Keeping a fixed polarity, lubricate the magnets with water and insert them, one at a time, into the outermost posts of the silicone racks.
NOTE: If you attempt to insert more than one magnet at a time, the additional resistance will make it more difficult to push the magnets to the bottom of the post. - Use a blunted piece of stainless-steel dental wire (d ≈ 0.4 mm, see Table of Materials) to carefully push them to the bottom of the hollow post cavity. You can stack up to five magnets in each post.
- Use (round-nose) pliers to bend stainless steel dental wire (d ≈ 0.4 mm, see Table of Materials) into braces 11.25 mm wide and 15 mm long. Use wire cutters to cut the braces and a file to smooth the cutting surface. To ensure the correct dimensions are achieved, one can use a self-made jig to aid in the wire bending.
NOTE: Post immobilization can also be achieved by braces made from other materials, as long as they are non-magnetic and rigid. - Lubricate the braces with water and insert them into the silicone rack, fixing the second- and third- to outermost post in the process (see Figure 1 for complete silicone rack setup).
NOTE: Optionally, in order to adapt the baseline stiffness of the control posts to match that of the magnetically responsive posts, fragments of styrene round rod (see Table of Materials) can be inserted into the empty posts (those without a brace or magnet). - Let the racks stand for 1–2 days to allow for any remaining water to air dry.
- When the posts are dry, seal the holes at the top of the hollow silicone posts containing the magnets using a drop of silicone glue.
- The afterload tuning device
NOTE: As the magnets in the afterload tuning device are moved towards or away from those in the silicone posts, the attractive magnetic forces increase or decrease accordingly, resulting in altered stiffness of the silicone posts. This movement is achieved using a piezoelectric stage. Due to the prototypical nature of the afterload tuning device, detailed step-by-step instructions on how to replicate it will not be provided. Instead, generalized guidelines for constructing a similar afterload tuning device are detailed herein.- Obtain a highly precise piezoelectric linear motor to enable the vertical translation of the magnet plate towards and away from the EHTs (see Table of Materials).
NOTE: It is highly suggested that this motor be fitted with a linear encoder to correct for stage positioning. - Position a set of permanent magnets within a non-magnetic holder such that they are axially aligned with the post magnets when placed directly below them. Here, large cylindrical magnets (d = 13 mm, h = 14 mm; see Table of Materials) were press-fit within an acrylic plastic plate (“magnet plate”).
- Attach the magnet holder to the piezoelectric stage using a non-magnetic material. This can be achieved using an L-shaped piece of aluminum (see Figure 2).
- Construct a frame that can house the components of the afterload tuning device. At a minimum, this structure should have a location on which to vertically mount the piezoelectric stage, as well as a rigid frame on which to place the 24-well plate.
NOTE: It is suggested that the location of this mount be modifiable in the horizontal plane in order to allow for adjustments in axial alignment between the two sets of magnets. A system of mechanical drives was used to achieve this maneuverability in the presented system (Figure 3). The afterload tuning device described here was designed to be compatible with the EHT contractility analysis system (see Table of Materials). As such, its dimensions were restricted to 29 cm in width, 29 cm in depth, and 16 cm in height to fit within this system. - To enable visual analysis of the tissues, install a light source within the afterload tuning device. Here, an array of LEDs was employed (Figure 4) to illuminate the EHTs from below (Figure 5).
- Obtain a highly precise piezoelectric linear motor to enable the vertical translation of the magnet plate towards and away from the EHTs (see Table of Materials).
- Calibrating the afterload tuning system
NOTE: In order to precisely augment EHT afterload to the desired value, the relationship between magnet spacing and the resulting post stiffness will need to be determined.- Measure the closest (dmin) and farthest (dmax) magnet spacing possible in your setup. These distances will dictate the maximum and minimum achievable afterloads.
NOTE: The bottom of the culture plate will prevent direct contact between the magnet plate and the magnetically responsive silicone posts. - Produce a range of non-magnetic weights and mount them on string to serve as test loads.
- Determine the weights of the test loads using a fine scale and label them according to this weight. Here, six different acrylic glass weights ranging from 30 mg to 200 mg were used.
NOTE: Select weights that are heavy enough to bend the post, but not so heavy that they bend the post more than a few millimeters. Using a larger number of test loads ensures that the calibration is more precise but it will also be more time-consuming. - Mount one of the silicone racks vertically (using non-magnetic materials), such that the magnetically responsive silicone posts are oriented horizontally.
- Mount one of the plate magnets (the “calibration magnet”) on a horizontally traveling linear stage such that it is axially aligned with the magnetically responsive post.
- Position the calibration magnet a defined distance from the magnetically responsive silicone post using the horizontal stage (preferably, start at a distance equal to the maximum magnet spacing achievable by the afterload tuning device).
- Place a camera (for an example, see Table of Materials) to the side of this set-up in order to be able to optically record the post’s deflection under the influence of the test loads.
NOTE: It is suggested that the user employ a camera with a resolution of at least 2 megapixels to ensure accurate determination of post deflection. - Take a picture of the post in the absence of any weights to use as a reference for the post’s “neutral” position.
- Without changing the camera’s perspective, attach one of the loads to the very end of the silicone post and take a picture of the post bending under the influence of the weight.
- Repeat this measurement for all of the weights.
- Optically determine the deflection of the silicone post caused by the gravitational force of each weight.
- Graph the deflection of the silicone post (x, on the x-axis) against the gravitational force of each test weight (mg, on the y-axis). This should yield a linear relationship between force and deflection.
NOTE: If the data is non-linear, this may indicate that the post is outside its linear range of deflection, i.e., the utilized weights were too heavy. - Plot a linear regression function passing through (0,0) and the acquired data (see Figure 6A for examples). The slope of this function (mg = kx) is the stiffness k of the magnetically responsive silicone post at the tested magnet spacing.
- Repeat these steps at several spacings between dmax and dmin. Here, deflections at nine different magnet positions ranging from ~31 mm to ~5 mm were analyzed.
- Determine the base stiffness of the magnetically responsive silicone post in the absence of the calibration magnet using the same technique.
- Also determine the stiffness of a mobile, non-magnetically responsive control post using the same technique.
- Plot the resulting k values against the respective magnet distances. This should yield a negative exponential relationship.
- Plot a regression function through these values. For example, use Non-linear fit | One-phase decay function in the analysis software (see the Table of Materials). This regression function describes the relationship between magnet spacing and afterload (see Figure 6B for an example).
- Measure the closest (dmin) and farthest (dmax) magnet spacing possible in your setup. These distances will dictate the maximum and minimum achievable afterloads.
2. EHT Generation and Culture
NOTE: EHT generation and culture have been described in great detail in another article25. Therefore, we will only cover these aspects briefly in our protocol. Please carry out the following steps under sterile conditions, adhering to good cell culture practices.
- EHT generation
- Immerse the previously prepared silicone racks in a container filled with 70% ethanol for at least 20 min.
CAUTION: Do not autoclave the afterload-adjustable silicone posts to sterilize them as high temperatures can damage the permanent magnets. - Bring this container into the biosafety cabinet, rinse the racks 2x with sterile water, and let them air dry.
NOTE: To reduce the likelihood of contamination, this process should be carried out in the same biosafety cabinet that will later be used to cast the EHTs. - Acquire (and thaw if necessary) neonatal rat heart ventricular cells or hiPSC (human induced pluripotent stem cell)-derived cardiomyocytes (also commercially available) and prepare the EHT reconstitution mix according to Table 1.
- Pipet 1.5 mL of warm 2% agarose solution into the leftmost 4 wells of a 24-well culture plate and immediately insert a polytetrafluoroethylene (PTFE) spacer (see Table of Materials) into the liquid agarose solution.
- Repeat the previous step for the remaining 20 wells within the culture plate.
- After allowing the agarose to solidify for ~10 min, carefully remove the PTFE spacers.
NOTE: The agarose turns turbid when it has solidified. - Insert the posts of the magnetically sensitive silicone racks into the agarose voids produced by the PTFE spacers.
- Pipet 100 μL of the reconstitution mix into a 3 μL aliquot of 100 mU/L thrombin solution. Pipette up and down twice to mix and quickly transfer the mixture into the void within the first agarose mold on the culture plate.
- Repeat the previous step for the remaining 23 molds, using a new pipet tip for every EHT.
NOTE: Gently mix the constitution mix every 6–8 EHTs in order to prevent cell sedimentation. - Store the 24-well plate in an incubator (37 °C, 7% CO2, 40% O2) for 90 min. In the meantime, prepare the EHT medium by supplementing Dulbecco's modified Eagle medium (DMEM) with 10% horse serum, 1% penicillin/streptomycin, 10 μg/mL insulin and 33 µg/mL aprotinin.
- Add 500 μL of warm EHT medium to each well.
- Store the 24-well plate in an incubator (37 °C, 7% CO2, 40% O2) for 30 min. During this time, prepare a second 24-well plate with 1.5 mL of EHT medium in each well and place it in the incubator.
- Carefully remove the magnet-sensitive silicone racks with the freshly cast EHTs on them from the agarose molds and transfer them to the second 24-well plate.
- Immerse the previously prepared silicone racks in a container filled with 70% ethanol for at least 20 min.
- EHT culture
NOTE: Following tissue casting, change medium three times per week: on Monday, Wednesdays, and Fridays.- For a medium change, pipet 1.5 mL of fresh EHT medium per well into a new 24-well culture plate and place this plate within the incubator at 37 °C, 7% CO2, and 40% O2 for at least 30 min.
- Transfer the silicone racks from the old 24-well plate to the new plate under a cell culture hood.
- Store the closed EHT plates in an incubator at 37 °C, 7% CO2, and 40% O2.
3. Afterload Modification Experiments
NOTE: The following protocol steps are specific to the piezoelectric motor and optical contractility analysis platform listed in the Table of Materials.
- Preparing the afterload tuning device for experiments
- To measure the effects of afterload manipulations on EHT contractility, disconnect and remove the lighting system from the innermost compartment of the optical contractility analysis platform and insert the afterload tuning device including the light source.
- Install the stage motion control software (see Table of Materials) on the computer that will be used to run the afterload tuning device.
- Connect the piezoelectric stage motor to the motion controller (see Table of Materials), and the motion controller to the computer. Make sure the motion controller is also connected to a power source.
NOTE: There are two lights on the face of the motion controller. Upon connecting to power, both lights flash red for a few seconds. During operation, the upper light remains green while the lower one should only turn red if an error occurs. - Place an empty 24-well culture plate on the plate mount at the top of the afterload tuning device.
- Optically align the empty culture plate with the magnet plate below using the XY mechanical drive system attached to the mount.
- Operating the afterload-tuning device
- Start the motion controller platform software.
- Connect the software to the piezo stage motor by selecting the port designated as the stage port during installation of the motion control software and then click the open port button.
NOTE: After completing this step, the port should be designated as “open” and appear in a green box. - Go to the System panel. Select Open Loop in the Loop dropdown menu.
- Manually move the magnet plate to its highest position, i.e., the closest possible magnet spacing dmin. The magnet plate should make contact with the culture plate mount.
- Go to the Motion panel. Click the Zero button to reset the current position of the piezo stage to 0 mm.
- Manually move the magnet plate to its lowest possible position. Write down the encoder position (indicated in the Motion panel by Enc) to determine the range of motion for the piezoelectric stage motor.
- Set the Travel Limits in the System panel to values within the range of motion determined in the previous step. This prevents the magnet plate from bumping into the culture plate or the bottom of the afterload tuning device.
- Once again, move the magnet plate to its highest position and click the Zero button.
- Go to the system panel and change the feedback loop mode to Closed Loop. Doing this ensures that the stage will correct for any errors in its positioning.
- Click the Save button in the Save Parameters box to store these settings in the system.
- Place a 24-well culture plate containing EHTs on magnetically responsive silicone racks on the culture plate mount.
- To calculate the magnet spacing necessary to achieve a desired afterload, solve the nonlinear regression function from step 1.3.19 for the magnet spacing parameter d. For example, if the equation is:
 , d being the magnet spacing (in mm) necessary to achieve the desired afterload k in mN/mm, a magnet spacing of 12.12 mm would be necessary to achieve an afterload of 5 mN/mm.
 - Subtract dmin from the calculated magnet spacing d. The result is the distance the magnet plate has to travel from its Zero position to achieve the desired afterload.
- Type this value into the Target Position 1 input field in the Motion panel and click Go to adjust the EHTs’ afterload to the calculated value.
- Optional: Programming the stage for an interval afterload regimen
NOTE: The previous section describes how to program the stage to move to and stay at a single position. However, it is also possible to chain different commands together into a program to achieve an automatically executed sequence of motions, which may be repeated on a continuous loop. For more detailed instructions regarding the motion controller platform software, consult the operation manual provided by the stage manufacturer.- After setting up the afterload tuning device as described in the previous section, open the Command panel. Type the command 1PGM1 and press Enter to start recording a program.
- To create a program which, for example, will cause the piezoelectric stage to move down 30 mm from the Zero position (away from the EHTs) and return after 40 s, enter the following chain of commands: 1MVA30 → 1WST → 1WTM40000 → 1MVA0 → 1WST
- Use the command 1END to conclude recording a program and save it.
- Use the command 1EXC1 to execute the recorded program.
- To keep the program running on a continuous loop, enter 1PGL1, followed by the 1EXC1 command.
- To terminate a looping program, enter the command 1EST.
NOTE: Table 2 contains some useful commands for afterload modification experiments. A complete list of available commands for this system can be found in the reference manual for the modular motion control system.
Representative Results
Magnet post stiffness quantification
A horizontally oriented magnetically responsive silicone post was mounted in a fixed position, and an axially aligned calibration magnet was placed at several defined distances (“magnet spacings”) from this post. Test loads of known weight were suspended from the end of the silicone post, causing the post to bend. This deflection was quantified optically. A linear relationship between the gravitational force of the test load and resulting post deflection was observed at all magnet spacings (Figure 6A). The values of stiffness derived from these linear relationships followed a negative exponential trend with increasing magnet spacing (Figure 6B).
Stepwise afterload increase
Control and magnetically responsive EHTs (MR-EHTs) produced from rat hearts were cultured in the absence of magnetic afterload (0.6 mN/mm for control tissues and 0.91 mN/mm for MR-EHTs) until a plateau in contractile force was reached. On this day (24 days following EHT casting), MR-EHTs and control EHTs had similar mean forces (0.29 mN versus 0.22 mN). Over the next week, the afterload exerted on MR-EHTs was incrementally increased from 0.91 to 6.85 mN/mm, while afterload for control EHTs remained constant. Mean contractile force increased with increasing afterload up to 0.95 mN, which marks more than a 3-fold increase in force compared to the average value (0.29 mN) measured for control EHTs (Figure 7A). Post deflection, on the other hand, decreased compared to control tissues. On the last day of culture, the mean deflection measured for MR-EHTs was only 0.11 mm compared to 0.48 mm for control EHTs (Figure 7B). From day 27 on, force production rate and force decay rate were higher in MR-EHTs than in control EHTs while there was only a transient increase in work over days 25–28 (Supplementary Figure 2).
Interval afterload regimen
Rat EHTs on magnetically responsive silicone posts (MR-EHTs) were cultured at a minimal afterload of 0.91 mN/mm until a plateau in contractile force was reached. From this day (17 days following EHT casting) onward, MR-EHTs underwent a 7-day afterload regimen which exposed the EHTs to cycles of afterloads alternating between 0.91 and 6.85 mN/mm (Figure 8A). The afterload of control EHTs was kept constant at 0.60 mN/mm over the entire duration of culture. Following this intervention, average forces for MR-EHTs increased by 12.0% compared to day 17, while those measured for control EHTs only increased by 1.5% over the same time frame (Figure 8B). However, these differences were not statistically significant. Moreover, no significant differences in force production rate, force decay rate and contractile work were measured (Supplementary Figure 3). This implies that the selected afterload regimen was not an efficient means of increasing EHT contractility.
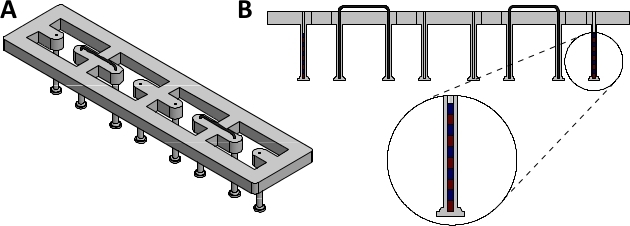
Figure 1: Assembled magnetically responsive silicone racks. (A) Orthogonal view and (B) sectional view of assembled magnetically responsive silicone racks containing five magnets. Please click here to view a larger version of this figure.
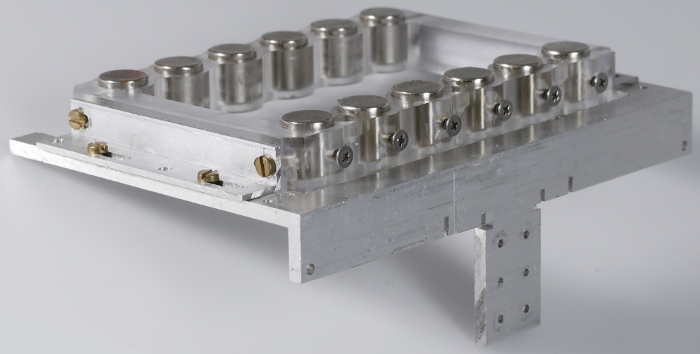
Figure 2: Magnet plate. Photograph of the magnet plate and its attachment bracket. Please click here to view a larger version of this figure.
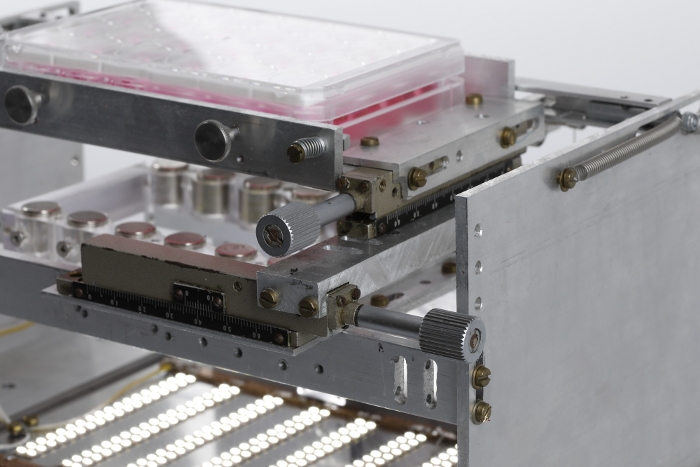
Figure 3: Mechanical drive system. Photograph showing the system of mechanical drives used to adjust the horizontal position of the 24-well plate with respect to the magnet plate. Please click here to view a larger version of this figure.
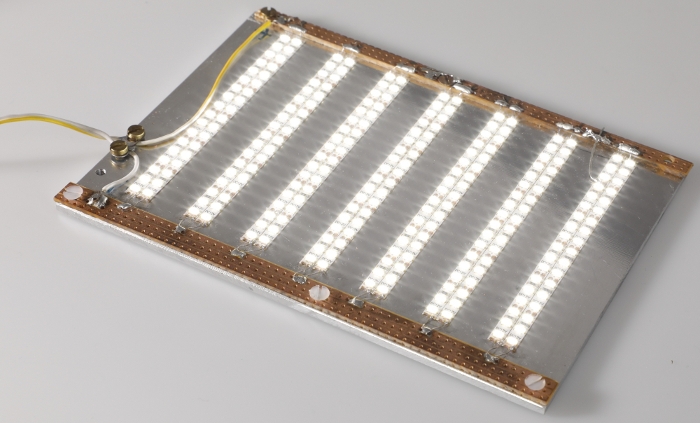
Figure 4: LED plate. Photograph of the LED plate used to illuminate EHTs for optical contractility analysis. Please click here to view a larger version of this figure.
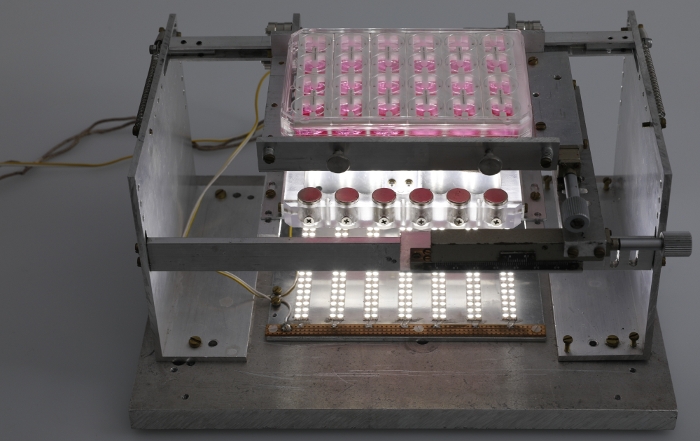
Figure 5: Fully assembled afterload tuning device. Photograph of the fully assembled afterload tuning device including the LED plate. Please click here to view a larger version of this figure.
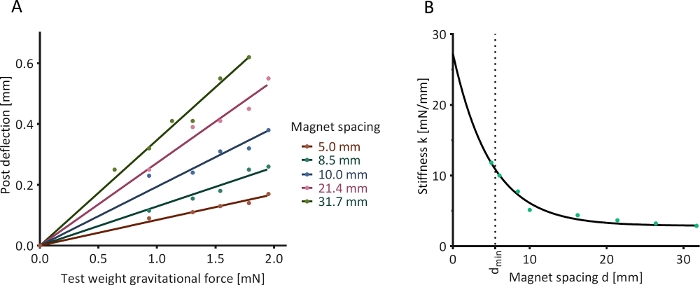
Figure 6: Optical determination of post stiffness. (A) The deflection of a magnetically responsive silicone post in the presence of an external calibration magnet and under the influence of five test weights was assessed at nine determined magnet spacings (five shown as examples). (B) Determined relationship between magnet spacing and post stiffness. Please click here to view a larger version of this figure.
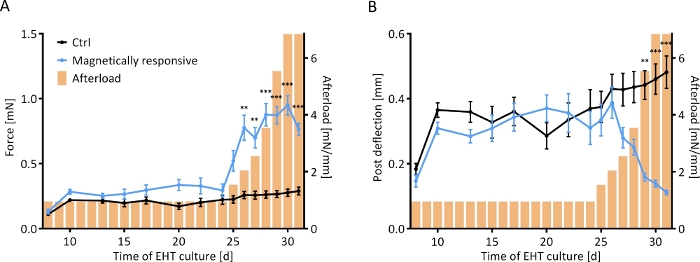
Figure 7: Contractile response of EHTs to a stepwise increase in afterload. Contractile measurements of control EHTs (black line) and EHTs cultured on magnetically responsive posts (MR-EHTs; blue line) over a culture period of 31 days. (A) MR-EHTs had slightly higher average contractile forces than control EHTs under baseline conditions. From day 25 on, however, this difference was amplified with increasing afterload. (B) Post deflection was similar between both groups until day 27. Past afterload values of 3.5 mN/mm, post deflection for MR-EHTs dropped substantially. Here, n = 10 MR-EHTs and n = 10 control EHTs were analyzed by fitting a mixed model (REML = restricted maximum likelihood) and Sidak’s multiple comparison test. The error bars in graphs represent standard error of the mean, ** p < 0.01, *** p < 0.001. Please click here to view a larger version of this figure.
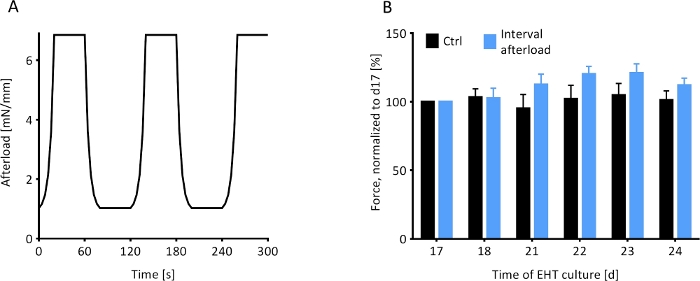
Figure 8: Contractile response of EHTs to an interval afterload protocol. The contractile behavior of magnetically responsive EHTs under the influence of a fluctuating regimen of afterload was observed. (A) The afterload regimen, which was initiated on day 17 (d17), exposed the MR-EHTs to 40 s intervals of minimal afterload (0.91 mM/mm) followed by 40 s intervals of maximal afterload (6.85 mN/mm) for 7 days. (B) MR-EHTs (blue bars) showed a trend towards increasing forces during the interval afterload protocol, while the forces measured for control EHTs (black bars) remained relatively unchanged. For these experiments, n = 10 EHTs were analyzed per group and this data was statistically compared using a 2-way ANOVA and Sidak’s multiple comparison test. Error bars in graphs represent standard error of the mean. Please click here to view a larger version of this figure.
| 1 Rat EHT | 24 Rat EHTs (+10%) | 1 hiPSC-CM EHT | 24 hiPSC-CM EHTs (+10%) | Component | |
| 5 x 10⁵ | 1.3 x 10⁷ | 1 x 10⁶ | 2.6 x 10⁷ | Cells (either neonatal rat heart ventricular cells or hiPSC-derived cardiomyocytes) | |
| 5.57 μL | 147 μL | 5.57 μL | 147 μL | 2x DMEM: 20% heat-inactivated horse serum, 20% 10x DMEM, 2% penicillin/streptomycin, 58% aqua ad iniectabilia | |
| 2.53 μL | 66.8 μL | 2.53 μL | 66.8 μL | Fibrinogen: 200 mg/mL Fibrinogen dissolved in 0.9% NaCl | |
| – | – | 0.1 μL | 2.64 μL | Y-27632 | |
| ad 100 μL | ad 2640 μL | ad 100 μL | ad 2640 μL | EHT-casting medium: 88% DMEM, 10% heat-inactivated fetal calf serum, 1 % penicillin/streptomycin, 1% L-glutamine | |
Table 1: Reconstitution mix for generating EHTs.
| Command name | Syntax | Description | |
| Move absolute | 1MVA[x] | Stage moves to position [x] in mm | |
| Set velocity | 1VEL[x] | Stage movement velocity set to [x] in mm/s | |
| Emergency stop | 1EST | Stops any movement | |
| Wait for stop | 1WST | Only during program recording; Waits for completion of previous movement command before executing next command | |
| Wait for time period | 1WTM[x] | Only during program recording; Waits for time period [x] in ms | |
| Beginn program recording | 1PGM[x] | Begin program recording in slot [x]; Note: Slot [x] needs to be free | |
| End program recording | 1END | End program recording and save program | |
| Erase program | 1ERA[x] | Erase program saved in slot [x] | |
| Execute program | 1EXC[x] | Execute program saved in slot [x] | |
| Loop program | 1PGL[x] | [x]=1 Program loop mode ON [x]=0 Program loop mode turned off | |
| Read and clear errors | 1ERR? | Request error report | |
Table 2: Useful commands for afterload tuning experiments.
Supplementary Figure 1: Dimensions of silicone racks. (A) Top view, (B) sectional side view, and (C) detailed post view of the silicone racks used for these studies. Please click here to download this figure.
Supplementary Figure 2: Additional contractile parameters for stepwise afterload increase. Contractile measurements of control EHTs (black line) and EHTs cultured on magnetically responsive posts (MR-EHTs; blue line) over a culture period of 31 days. (A) MR-EHTs had a significantly higher force production rate than control EHTs from day 27 on. (B) The rate of force decay was also significantly greater in MR-EHTs than in control from day 27 onward. (C) While contractile work measured in control EHTs gradually increased over the entire period of culture, the contractile work produced by MR-EHTs peaked on day 26 and dropped thereafter to levels below control. Yet, work in MR-EHTs was never significantly higher than that in control EHTs. Here, n = 10 MR-EHTs and n = 10 control EHTs were analyzed by fitting a mixed model (REML = restricted maximum likelihood) and Sidak’s multiple comparison test. The error bars in graphs represent standard error of the mean, * p < 0.05, *** p < 0.001. Please click here to download this figure.
Supplementary Figure 3: Additional contractile parameters for interval afterload protocol. The contractile behavior of magnetically responsive EHTs (MR-EHTs) under the influence of a fluctuating regimen of afterload was observed. (A) During the interval afterload protocol, MR EHTs (blue bars) initially showed a trend towards higher force production rates compared to control EHTs (black bars), but these differences were not significant and diminished towards the end of the experiment. (B) Force decay rates measured in MR-EHTs and control EHTs were statistically similar throughout the interval afterload protocol. (C) Contractile work measured for MR-EHTs increased during the first days of the afterload interval protocol but decreased on the last day. The contractile work measured for control EHTs did not noticeably change during this period of time. Work in MR-EHTs was never significantly higher than work in control EHTs. For these experiments, n = 10 EHTs per group were analyzed by 2-way ANOVA and Sidak’s multiple comparison test. Error bars in graphs represent standard error of the mean. Please click here to download this figure.
Discussion
The protocol outlined herein describes a new technique for magnetically altering afterload in engineered heart tissues. This technique relies upon the use of a piezoelectric stage to translate a plate of strong magnets towards and away from magnetically responsive racks of silicone posts. The closer the two sets of magnets, the stronger the afterload experienced by the EHTs cultured on them.
There are several steps that are critical to the successful production and use of this system. While fabricating the magnetically responsive silicone racks, it is crucially important to ensure that all of the magnets within the posts are oriented with the same polarity. If a magnet is placed in the reverse orientation, it will serve to weaken rather than augment the strength of the magnetic field. Similarly, this polarity should match that of all the magnets within the magnet plate, else the two sets of magnets will repel, rather than attract one another. Additionally, where possible, refrain from using magnetic materials in the construction of the afterload adjustment device, as they can interfere with the magnetic field. Aluminum is suggested as a primary construction material for this reason. Similarly, if using a piezoelectric stage other than the one listed in the Table of Materials, ensure that it is resistant to magnetic fields and standard cell culture conditions (e.g., 37 °C, 100% humidity, and high CO2 and O2-concentrations). Lastly, keep in mind that most piezoelectric linear stages are meant to be mounted horizontally, as they tend to have a low load capacity. As such, if the weight of the magnet plate exceeds this load capacity, a counterweight should be used to unload the motor.
Despite best practices, it is quite difficult to keep the encoder surface pristine. When this occurs, the stage will stop moving before reaching the target position when running in closed-loop mode. The motion controller’s red LED will flash, additionally the motion controller software will display a “No encoder detected”-error message. To remedy this, the user should clean the surface of the encoder with a lint-free piece of cloth soaked in isopropyl alcohol and let it air dry.
This protocol demonstrates the steps taken by our lab to produce and implement this system. However, several of these steps could be achieved by different means. For example, one could use a force transducer, rather than optical means, to confirm the relationship between magnet spacing and post stiffness. Additionally, custom posts could be designed and fabricated with embedded magnets and braces. However, we have found that precise positioning of these objects is easier to accomplish manually. To fine-tune the range of afterloads applicable by this system, these posts can be manufactured with differing basal stiffnesses or with a different number of magnets. Though, using too many magnets will impede post bending. Alternatively, this can also be achieved by adjusting the size and strength of the magnets within the magnet plate. Larger and stronger magnets will yield higher afterloads.
There are several limitations to this method that could be improved upon in future versions of this system. Namely, the range of applicable afterloads is physically limited by the maximum and minimum spacing between the post magnets and plate magnets. Ideally, the posts used for this system would place the tissues as close to the base of the tissue culture dish as possible, without directly allowing the tissue to touch the bottom of the plate. However, the posts used in these studies were commercially made prior to the development of this system, so the lengths of the posts were not optimized for this platform. Similarly, since the EHT contractility analysis system was constructed prior to this system, it was not designed to allow for electrical cords in or out of the measurement space. As such, the presence of these cords resulted in a small air gap, which allowed for gases to slowly leak out of the inner chamber. This could be ameliorated by adjusting gas flow rates accordingly. However, ideally, a future embodiment of this system would have insulated exit and entry points for these cords. Should one wish to perform these experiments in the absence of the EHT contractility analysis system, the afterload tuning platform can instead be placed within an incubator. Though, the system in its entirety will only fit within a standard incubator if one or more of the shelves are removed, rendering this space unavailable for other cell and or tissue culture purposes. To optically observe the tissues in either environment, lights will be necessary. The LED lights used for this system were found to give off a substantial amount of heat. If left on for long periods, this heat could potentially damage the tissues. As such, for these studies, the lights were only used for short periods while assessing the contractility of the tissues. However, should one desire to consistently observe the tissues, the lighting system will have to be optimized for these purposes.
Afterload has been previously studied in EHT models16,23. However, these works presented techniques that were only able to achieve a singular static increase in load. Alternatively, this work demonstrated how a magnetics-based platform can be used to fine-tune and temporally regulate afterload in EHTs. The results from two separate sets of experiments were used to exemplify the wide range of afterload regimens that can be applied to EHTs using this device. Intended future applications of this system include studies on the effect of the applied afterload regimen (dose and duration) on both tissue maturation and pathological remodeling.
Açıklamalar
The authors have nothing to disclose.
Acknowledgements
The authors thank Jutta Starbatty for her support in tissue culture work, Axel Kirchhof for photography, Alice Casagrande Cesconetto for editing work, and a special thanks to Bülent Aksehirlioglu for technical support in the development of this device. B.B. was supported by a DZHK (German Centre for Cardiovascular Research) Scholar Grant, M.L.R. by a Whitaker International Postdoctoral Scholar Grant and M.N.H. by funds from the DZHK.
Materials
| Cylindrical plate magnets | HKCM | 9962-55184 | h = 14 mm, d = 13 mm |
| Cylindrical post magnets | HKCM | 9962-63571 | h = 2 mm, d = 0.5 mm |
| Dental wire | Ormco | 266-1316 | d = 0.016 inches (0.406 mm) |
| GraphPad | GraphPad Software, La Jolla, California, USA | version 6.00 for Windows | |
| Motion control software for piezo motor | Micronix USA | free download on manufacturer homepage | |
| Motion controller for piezo motor | Micronix USA | MMC-100-01000 | |
| Optical contractility analysis platform | EHT technologies | A0001 | |
| Piezoelectric linear motor | Micronix USA | PPS-20-15206 | fitted with linear optical encoder, incubator-environment compatible |
| Styrene Rod | Plastruct | MR-15 | d= 0.015 inches (0.381 mm) |
| USB camera | Reichelt Elektronik | REFLECTA 66142 |
Referanslar
- Zipes, D. P., Libby, P., Bonow, R. O., Mann, D. L., Tomaselli, G. F. . Braunwald’s Heart Disease: A Textbook of Cardiovascular Medicine. 11th edn. , (2018).
- McCain, M. L., Yuan, H., Pasqualini, F. S., Campbell, P. H., Parker, K. K. Matrix elasticity regulates the optimal cardiac myocyte shape for contractility. American Journal of Physiology- Heart and Circulatory Physiology. 306 (11), 1525-1539 (2014).
- de Groot, P. C., van Dijk, A., Dijk, E., Hopman, M. T. Preserved cardiac function after chronic spinal cord injury. Archives of Physical Medicine and Rehabilitation. 87 (9), 1195-1200 (2006).
- Perhonen, M. A., et al. Cardiac atrophy after bed rest and spaceflight. Journal of Applied Physiology. 91 (2), 645-653 (2001).
- Levy, D., Larson, M. G., Vasan, R. S., Kannel, W. B., Ho, K. K. The progression from hypertension to congestive heart failure. Journal of the American Medical Association. 275 (20), 1557-1562 (1996).
- Levy, D., et al. Long-term trends in the incidence of and survival with heart failure. The New England Journal of Medicine. 347 (18), 1397-1402 (2002).
- Maggioni, A. P., et al. EURObservational Research Programme: regional differences and 1-year follow-up results of the Heart Failure Pilot Survey (ESC-HF Pilot). European Journal of Heart Failure. 15 (7), 808-817 (2013).
- Mozaffarian, D., et al. Heart disease and stroke statistics–2015 update: a report from the American Heart Association. Circulation. 131 (4), 29 (2015).
- Klautz, R. J., Teitel, D. F., Steendijk, P., van Bel, F., Baan, J. Interaction between afterload and contractility in the newborn heart: evidence of homeometric autoregulation in the intact circulation. Journal of the American College of Cardiology. 25 (6), 1428-1435 (1995).
- Liedtke, A. J., Pasternac, A., Sonnenblick, E. H., Gorlin, R. Changes in canine ventricular dimensions with acute changes in preload and afterload. The American Journal of Physiology. 223 (4), 820-827 (1972).
- Toischer, K., et al. Differential cardiac remodeling in preload versus afterload. Circulation. 122 (10), 993-1003 (2010).
- Zhang, H., et al. Cellular Hypertrophy and Increased Susceptibility to Spontaneous Calcium-Release of Rat Left Atrial Myocytes Due to Elevated Afterload. PloS one. 10 (12), 0144309 (2015).
- Hori, M., et al. Loading sequence is a major determinant of afterload-dependent relaxation in intact canine heart. The American Journal of Physiology. 249, 747-754 (1985).
- Schotola, H., et al. The contractile adaption to preload depends on the amount of afterload. ESC Heart Failure. 4 (4), 468-478 (2017).
- Sonnenblick, E. H., Downing, S. E. Afterload as a primary determinat of ventricular performance. The American Journal of Physiology. 204, 604-610 (1963).
- Hirt, M. N., et al. Increased afterload induces pathological cardiac hypertrophy: a new in vitro model. Basic Research in Cardiology. 107 (6), 307 (2012).
- Hirt, M. N., et al. Deciphering the microRNA signature of pathological cardiac hypertrophy by engineered heart tissue- and sequencing-technology. Journal of Molecular and Cellular Cardiology. 81, 1-9 (2015).
- Dorn, G. W. The fuzzy logic of physiological cardiac hypertrophy. Hypertension. 49 (5), 962-970 (2007).
- Hill, J. A., Olson, E. N. Cardiac plasticity. The New England Journal of Medicine. 358 (13), 1370-1380 (2008).
- Maillet, M., van Berlo, J. H., Molkentin, J. D. Molecular basis of physiological heart growth: fundamental concepts and new players. Nature Reviews Molecular Cell Biology. 14 (1), 38-48 (2013).
- Stenzig, J., et al. DNA methylation in an engineered heart tissue model of cardiac hypertrophy: common signatures and effects of DNA methylation inhibitors. Basic Research in Cardiology. 111 (1), 9 (2016).
- Werner, T. R., Kunze, A. C., Stenzig, J., Eschenhagen, T., Hirt, M. N. Blockade of miR-140-3p prevents functional deterioration in afterload-enhanced engineered heart tissue. Scientific Reports. 9 (1), 11494 (2019).
- Leonard, A., et al. Afterload promotes maturation of human induced pluripotent stem cell derived cardiomyocytes in engineered heart tissues. Journal of Molecular and Cellular Cardiology. 118, 147-158 (2018).
- Rodriguez, M. L., Werner, T. R., Becker, B., Eschenhagen, T., Hirt, M. N. Magnetics-Based Approach for Fine-Tuning Afterload in Engineered Heart Tissues. ACS Biomaterials Science & Engineering. 5 (7), 3663-3675 (2019).
- Mannhardt, I., et al. Automated Contraction Analysis of Human Engineered Heart Tissue for Cardiac Drug Safety Screening. Journal of Visualized Experiments: JoVE. (122), e55461 (2017).

