Monitoring Extracellular pH in Cross-Kingdom Biofilms using Confocal Microscopy
Özet
The protocol describes the cultivation of cross-kingdom biofilms consisting of Candida albicans and Streptococcus mutans and presents a confocal microscopy-based method for the monitoring of extracellular pH inside these biofilms.
Abstract
Cross-kingdom biofilms consisting of both fungal and bacterial cells are involved in a variety of oral diseases, such as endodontic infections, periodontitis, mucosal infections and, most notably, early childhood caries. In all of these conditions, the pH in the biofilm matrix impacts microbe-host interactions and thus the disease progression. The present protocol describes a confocal microscopy-based method to monitor pH dynamics inside cross-kingdom biofilms comprising Candida albicans and Streptococcus mutans. The pH-dependent dual-emission spectrum and the staining properties of the ratiometric probe C-SNARF-4 are exploited to determine drops in pH in extracellular areas of the biofilms. Use of pH ratiometry with the probe requires a meticulous choice of imaging parameters, a thorough calibration of the dye, and careful, threshold-based post-processing of the image data. When used correctly, the technique allows for the rapid assessment of extracellular pH in different areas of a biofilm and thus the monitoring of both horizontal and vertical pH gradients over time. While the use of confocal microscopy limits Z-profiling to thin biofilms of 75 µm or less, the use of pH ratiometry is ideally suited for the noninvasive study of an important virulence factor in cross-kingdom biofilms.
Introduction
Cross-kingdom biofilms comprising both fungal and bacterial species are involved in several pathologic conditions in the oral cavity. Candida spp. have frequently been isolated from endodontic infections1 and from periodontal lesions2,3. In mucosal infections, streptococcal species from the mitis group have been shown to enhance fungal biofilm formation, tissue invasion, and dissemination in both in vitro and murine models4,5,6,7. Most interestingly, oral carriage of Candida spp. has been proven to be associated with the prevalence of caries in children8. As shown in rodent models, a symbiotic relationship between Streptococcus mutans and Candidas albicans increases the production of extracellular polysaccharides and leads to the formation of thicker and more cariogenic biofilms9,10.
In all of the above-mentioned conditions, early childhood caries in particular, the biofilm pH is of importance for disease progression, and the eminent role of the biofilm matrix for the development of acidogenic microenvironments11 calls for methodologies that allow studying pH changes inside cross-kingdom biofilms. Simple and accurate confocal microscopy-based approaches to monitor pH inside bacterial12 and fungal13 biofilms have been developed. With the ratiometric dye C-SNARF-4 and threshold-based image post-processing, extracellular pH can be determined in real-time in all three dimensions of a biofilm14. Compared to other published techniques for microscopy-based pH-monitoring in biofilms, pH ratiometry with C-SNARF-4 is simple and cheap, because it does not require the synthesis of particles or compounds that include a reference dye15 or the use of two-photon excitation16. The use of just one dye prevents problems with probe compartmentalization, fluorescent bleed-through, and selective bleaching16,17,18 while still allowing for a reliable differentiation between intra- and extracellular pH. Finally, incubation with the dye is performed after biofilm growth, which allows studying both laboratory and in situ-grown biofilms.
The aim of the present work is to extend the use of pH ratiometry and provide a method to study pH changes in cross-kingdom biofilms. As proof of concept, the method is used to monitor pH in dual species biofilms consisting of S. mutans and C. albicans exposed to glucose.
Protocol
The protocol for saliva collection was reviewed and approved by the Ethics Committee of Aarhus County (M-20100032).
1. Cultivation of Cross-kingdom Biofilms
- Grow S. mutans DSM 20523 and C. albicans NCPF 3179 on blood agar plates at 37 °C under aerobic conditions.
- Transfer single colonies of each organism to test tubes filled with 5 mL of brain heart infusion (BHI). Grow for 18 h under aerobic conditions at 37 °C.
- Centrifuge the overnight cultures at 1,200 x g for 5 min. Discard the supernatant, resuspend the cells in physiological saline and adjust the OD550 nm to 0.5 for C. albicans (~107 cells/mL) and S. mutans (~108 cells/mL). Dilute the S. mutans suspension 1:10 with sterile physiological saline (~107 cells/mL).
- Pipette 50 µL of sterile salivary solution, prepared according to the method of de Jong et al.19, into the wells of an optical bottom 96-well plate for microscopy. Incubate for 30 min at 37 °C. Wash the wells 3x with 100 µL of sterile physiological saline. Empty the wells.
- Add 100 µL of C. albicans suspension to each well. Incubate at 37 °C for 90 min. Wash 3x with sterile physiological saline.
NOTE:Do not empty the wells completely during washing. Leave a reservoir of 20 µL to avoid excessive shear forces. - Add 100 µL of heat-inactivated fetal bovine serum (inactivated at 56 °C for 30 min) to each well. Incubate at 37 °C for 2 h. Wash 3x with sterile physiological saline. Empty the wells, leaving a reservoir of 20 µL.
- Add 100 µL of S. mutans suspension (prepared in step 1.3) to each well. Add 150 µL of BHI containing 5% sucrose. Incubate at 37 °C for 24 h or longer. When cultivating older biofilms, change the medium daily to fresh BHI. At the end of the cross-kingdom biofilm growth phase, wash 5x with sterile physiological saline.
2. Ratiometric pH Imaging
NOTE:Ratiometric pH imaging needs to be performed immediately after biofilm growth is complete.
- For ratiometric pH imaging, use an inverted confocal laser scanning microscope with a 63x oil or water immersion lens, a 543 nm laser line, and a spectral imaging system (i.e., META detector) to allow for the imaging of overlapping fluorescent signals. Use an incubator to warm the microscope stage to 35 °C.
- Set the detector to ensure the detection of green fluorescence from 576−608 nm and simultaneous detection of red fluorescence from 629−661 nm. Choose an appropriate laser power and gain to avoid over- and underexposure.
NOTE: Exposure of the images is best seen in palette images with false coloring. - Set the pinhole size to 1 Airy Unit or an optical slice of ~0.8 µm. Set the image size to 512 x 512 pixels and the scan speed to 2. Choose a line average of 2, using the mean option.
NOTE:At the beginning of a series of experiments, check that the chosen microscope settings provides a clear contrast between bacterial cells, fungal cell walls, biofilm matrix, and fungal cytoplasm. - Prepare 100 µL of sterile physiological saline containing 0.4% (w/v) of glucose, titrated to pH 7. Prepare a stock solution of C-SNARF-4 (1 mM in dimethyl sulfoxide). Add the dye to a final concentration of 30 µM.
CAUTION: Wear nitrile gloves when handling the ratiometric dye. - Empty one of the wells with a cross-kingdom biofilm, leaving a reservoir of 20 µL. Add the sterile saline containing glucose and the ratiometric dye. Place the 96-well plate on the microscope stage and start imaging the biofilm.
- Acquire single images or Z-stacks in different locations of the biofilm. Mark the X-Y position in the microscope software to follow pH changes in particular fields of view over time. At regular intervals, take images with the laser turned off to correct for detector offset.
- Repeat steps 2.4–2.6 for the analysis of each biofilm grown in a different well.
3. Calibration of the Ratiometric Dye
NOTE: Calibration of the dye and the fitting of a calibration curve can be performed on a different day than ratiometric pH imaging.
- Prepare a series of 50 mM 2-morpholinoethanesulfonic acid (MES) buffer titrated to pH 4.0−7.8 in steps of 0.2 pH units at 35 °C. Pipette 150 µL of each buffer solution into the wells of an optical-bottom 96-well plate for microscopy.
- Add the dye to the buffer-filled wells of the 96-well plate to a final concentration of 30 µM. Let equilibrate for 5 min.
- Warm the microscope stage to 35 °C. Choose the same microscope settings as for ratiometric pH imaging. Place the 96-well plate on the microscope stage. Focus on the bottom of the wells. Acquire two images (green and red channel) for all buffer solutions, 5 µm above the bottom of the well. At regular intervals, take images with the laser turned off to correct for detector offset.
- Perform the calibration experiment in triplicate.
- Export all images as TIF files. Import them into dedicated image analysis software (i.e., ImageJ20). Subtract the images taken with the laser turned off from the respective images of the buffer solutions by clicking Process | Image Calculator | Subtract).
NOTE: If necessary, crop the images to eliminate artifacts at the image borders by performing rectangular selection using Image | Crop. - Divide the green channel images through the red channel images and calculate the average fluorescence intensities in the resulting images by clicking Analyze | Histogram.
- From the triplicate experiments, plot the average green/red ratios against the pH. Use dedicated software to fit a function to the calibration data (i.e., MyCurveFit).
4. Digital Image Analysis
NOTE:Digital image analysis can be performed at any time point after calibration of the dye and ratiometric pH imaging.
- Store the green and red channel biofilm images in separate folders and rename both series of files with sequential numbers (e.g., GREEN_0001). Import the images into dedicated image analysis software (i.e., ImageJ). Click Analyze | Histogram to determine the average fluorescence intensity in the images taken with the laser off and subtract the value from the biofilm images by clicking Process | Math | Subtract.
- Import the 2 image series into dedicated image analysis software (i.e., daime21). Perform a threshold-based segmentation of the red channel images (Segment | Automatic segmentation | Custom threshold). Set the 'low' threshold above the fluorescence intensity of the fungal cytoplasm and the 'high' threshold below the intensity of the fungal cell walls and the bacteria.
NOTE:When appropriate thresholds have been chosen, only extracellular areas are recognized as objects. - Transfer the object layer of the segmented image series to the green channel image series. To do so, click Segment | Transfer object layer.
NOTE: If the contrast between extracellular areas and fungal cytoplasm is too weak in the individual color channels, add the green channel image series to the red channel series prior to segmentation by clicking Edit | Image calculator | Addition. Perform the segmentation as described under 4.2 and transfer the object layer of the segmented image series to both the green and the red channel image series. - Employ the object editor to delete non-object pixels in the red and green channel image series (Visualizer | Object editor | In all images | Delete non-object pixels). Now the biofilm images are cleared from both bacterial and fungal cells. Export the processed image series as TIF files.
- Import both image series to ImageJ. ImageJ assigns an intensity of 0 to all non-object pixels. Remove those pixels by dividing the red image series (R1) by itself (Process | Image calculator | Image 1: R1; Operation: Divide; Image 2: R1) and multiplying the resulting image series (R2) with the original red image series (Process | Image calculator | Image 1: R1; Operation: Multiply; Image 2: R2). A third image series (R3) is created, identical to R1, except for the fact that NaN is assigned to all pixels with an intensity of 0 in R1. Proceed in the same way with the green image series.
- Use the 'Mean' filter (Process | Filters | Mean | Radius | 1 pixel) on the red and green channel image series to compensate for detector noise. Divide the green channel image series by the red channel image series (Process | Image calculator | Image 1: G3; Operation: Divide; Image 2: R3). The resulting image series (G3/R3) shows the green/red ratio for all object pixels.
- Calculate the average ratio for each image (Analyze | Histogram). Apply false coloring for better visual representation of the ratios in the images (Image | Lookup Tables). Convert the green/red ratios to pH values employing the function fitted under 3.6.
Representative Results
After 24 h and 48 h, robust cross-kingdom biofilms developed in the well plates. C. albicans showed varying degrees of filamentous growth, and S. mutans formed dense clusters of up to 35 µm in height. Single cells and chains of S. mutans grouped around fungal hyphae, and large intercellular spaces indicated the presence of a voluminous matrix (Figure S1).
Calibration of the ratiometric dye yields an asymmetrical sigmoidal curve13,14. The extracellular pH in the biofilms dropped quickly in the first 5 min after exposure to glucose at different rates in different microscopic fields of view. Thereafter, acidification slowed down, typically reaching values of 5.5–5.8 after 15 min (Figure 1). Replicate biofilms showed a similar behavior, with only slight variations in average pH (Figure S2).
The accuracy of the pH calculations is strongly dependent on a careful choice of image settings during acquisition. For the biofilms in question, an optical slice of 0.8 µm proved to be ideal to obtain the best possible contrast between extracellular areas and fungal cytoplasm (Figure S3). Moreover, a pixel size of 0.28 µm (Figure S4), a pixel dwell time of 102.4 µs (Figure S5), and a line average of 2 (Figure S6) provided a good contrast along with an acceptable image acquisition time of ~1 min. During image post-processing, all bacterial and fungal cells were removed from the images, while most of the surrounding extracellular areas were included in the subsequent pH analysis. Depending on the brightness of the images, different upper and lower thresholds had to be chosen (Figure 2).
The pH data shown in Figure 1 and Figure S2 were recorded 5 µm from the biofilm-substratum interface. With increasing distance from the substrate, and depending on the cell density in the biofilms, the fluorescence intensity decreases, resulting in a lower contrast between cells and matrix. However, in the thin biofilms (~35 µm) grown in the present study, contrast at the top of the biofilm allowed reliable image analysis (Figure S7A).
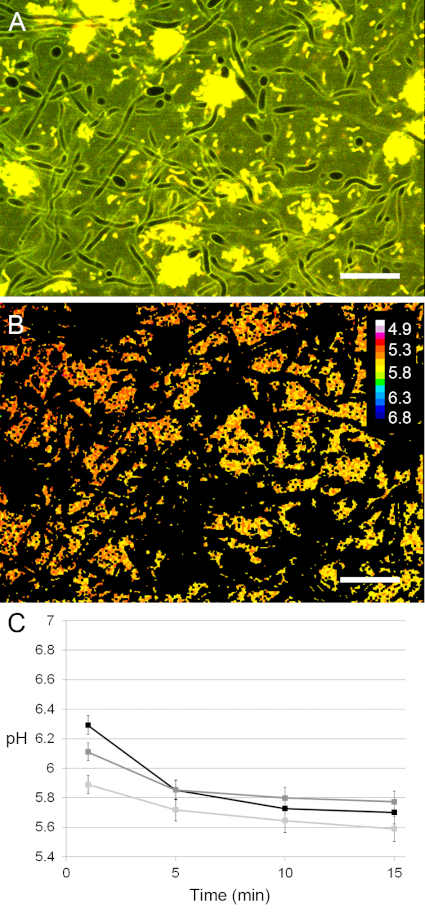
Figure 1: Use of pH ratiometry in cross-kingdom biofilms exposed to glucose. (A) A field of view in a stained biofilm was imaged with confocal microscopy and the area covered by bacterial and fungal cells was removed prior to ratiometric analysis. (B) The pH in the extracellular space was calculated and visualized using a lookup table (16 colors). Scale bars = 20 µm. (C) The pH in the 24 h cross-kingdom biofilms dropped rapidly upon exposure to glucose at slightly different rates in different fields of view. Error bars = standard deviation (SD). Please click here to view a larger version of this figure.
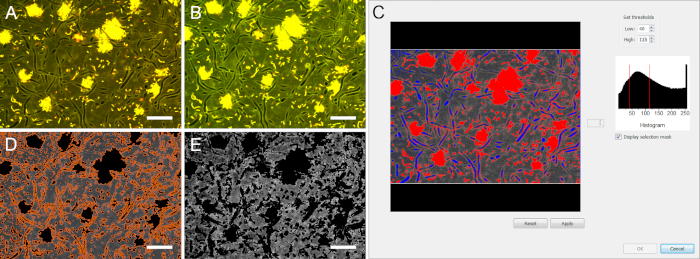
Figure 2: Threshold-based image segmentation of stained biofilms. Due to the local pH changes, fluorescence intensity in the biofilms changes over time. (A) and (B) show the same microscopic field of view after 1 min and 15 min of exposure to glucose, respectively. During image segmentation, high and low thresholds need to be chosen adequately to eliminate all areas covered by bacterial and fungal cells. (C) Blue areas were eliminated by the low threshold (40), red areas by the high threshold (115). (D) Only extracellular areas were recognized as objects (surrounded by orange lines). (E) After elimination of the area covered by microbial cells, the pH calculation could be performed in the biofilm matrix. Scale bars = 20 µm. Please click here to view a larger version of this figure.

Figure S1: Typical 24 h cross-kingdom biofilm stained with the ratiometric dye. Many C. albicans cells displayed filamentous growth, while S. mutans (yellow) cells formed dense clusters or localized around fungal hyphae as single cells or chains. Large intercellular spaces indicated the presence of a voluminous biofilm matrix. Scale bars = 20 µm. Please click here to view a larger version of this figure.

Figure S2: The pH development in 24 h cross-kingdom biofilms exposed to glucose. (A), (B), and (C) The pH was determined ratiometrically in three replicate biofilms for 15 min after exposure to glucose. After a rapid pH drop in the first 5 min, acidification slowed down, and levels of 5.5−5.8 were reached after 15 min. Slightly different rates were observed in different microscopic fields of view (each represented by a line). Calibration of the ratiometric probe was only performed once. Error bars = SD. Please click here to view a larger version of this figure.
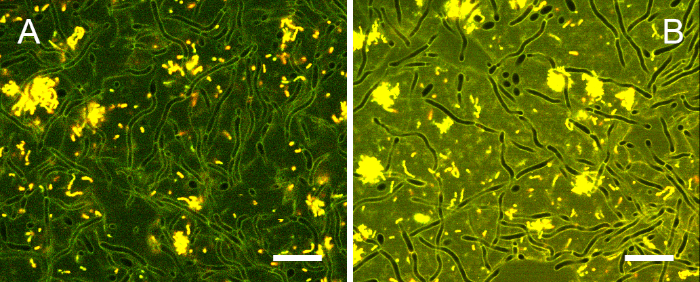
Figure S3: Impact of optical slice thickness on image contrast. Images of stained biofilms were acquired with (A) a pinhole size of 2 Airy Units and an optical slice thickness of 1.6 µm, and (B) 1 Airy Unit and an optical slice of 0.8 µm. At 1 Airy Unit, a higher laser power/gain was needed for image acquisition, but the contrast between fungal cytoplasm and extracellular areas improved. Scale bars = 20 µm. Please click here to view a larger version of this figure.

Figure S4: Impact of resolution on image contrast. Images of stained biofilms were acquired with pixel sizes of (A) 1.12 µm, (B) 0.56 µm, (C) 0.28 µm, (D) 0.14 µm, and (E) 0.11 µm. Reduction of the pixel size below 0.28 µm did not improve the contrast between extracellular areas and fungal cytoplasm. Scale bars = 20 µm. Please click here to view a larger version of this figure.

Figure S5: Impact of scan speed on image contrast. Images of stained biofilms were acquired with pixel dwell times of (A) 12.8 µs, (B) 25.6 µs, (C) 51.2 µs, (D) 102 µs, and (E) 164 µs. Increasing the pixel dwell time beyond 102 µs did not improve the contrast between extracellular and intracellular areas. Scale bars = 20 µm. Please click here to view a larger version of this figure.
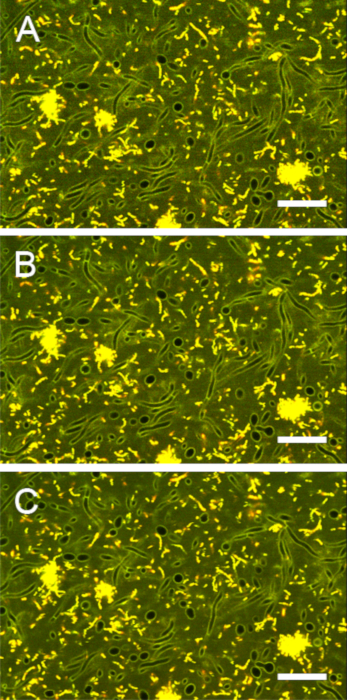
Figure S6: Impact of averaging on image contrast. Images of stained biofilms were acquired with line averages (mean) of (A) 1, (B) 2, and (C) 4. A line average of 2 provided the best compromise between contrast and acquisition time. Scale bars = 20 µm. Please click here to view a larger version of this figure.
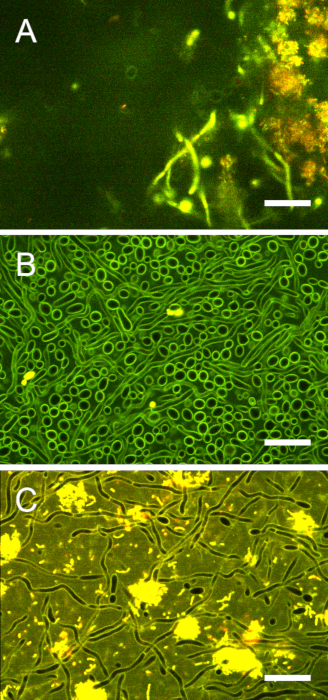
Figure S7: Image contrast in purely fungal biofilms and cross-kingdom biofilms. (A) The top of a stained cross-kingdom biofilm was imaged 30 µm from the interface. The contrast between extracellular and intracellular areas was lower than at the biofilm base but still sufficient for ratiometric pH analysis. (B) A C. albicans monospecies biofilm was imaged for pH ratiometry. Laser power/gain could be increased to optimize the contrast between fungal cell walls and cytoplasm. (C) In cross-kingdom biofilms, the brightly fluorescent bacteria precluded further increase of laser power/gain. Hence, the contrast between fungal cell walls and cytoplasm is less pronounced than in purely fungal biofilms. Scale bars = 20 µm. Please click here to view a larger version of this figure.
Discussion
Different protocols for the cultivation of cross-kingdom biofilms involving C. albicans and Streptococcus spp. have been described previously9,22,23,24,25. However, the present setup focuses on simple growth conditions, a time schedule compatible with regular working days, a balanced species composition, and the development of a voluminous biofilm matrix. Moreover, 96-well plates were coated with salivary solution to mimic oral conditions of adhesion to some extent.
The use of pH ratiometry with C-SNARF-4 is an inexpensive method for rapid measurements of biofilm pH, the advantages and disadvantages of which have been discussed in detail elsewhere12,26. In brief, the technique allows for the assessment of pH in different locations inside biofilms and thus the monitoring of horizontal pH gradients and pH developments over time27. Vertical pH profiles can be recorded, too, but the penetration depth is limited by the use of confocal microscopy. Hence, pH ratiometry represents a faster, more versatile, and less invasive alternative to pH microelectrodes, which are currently the method of choice for Z-profiling of thick biofilms28. Compared to other microscopy-based methods for pH recordings in biofilms, pH ratiometry with C-SNARF-4 has the advantage of only employing one stain. Therefore, several problems that may arise from the differential fluorescent behavior and the interaction between different dyes are circumvented26.
In cross-kingdom biofilms, threshold-based differentiation between microbial biomass and extracellular areas poses some problems when compared to biofilms that only comprise bacterial or fungal cells. Bacterial cells internalize the ratiometric dye and display a bright fluorescent signal compared to the biofilm matrix, but also compared to fungal cell walls. Fungal cell walls appear somewhat brighter than the biofilm matrix, which in turn shows higher fluorescence than the fungal cytoplasm. In biofilms that only consist of fungal cells, images can be acquired with a high laser power/gain, which results in sufficient contrast between the biofilm matrix and the fungal cytoplasm (Figure S7B). When bacteria are present, laser power/gain must be reduced to avoid overexposure of bacterial cells (Figure S7C). Hence, the contrast between fungal cytoplasm and extracellular areas is not as pronounced, and image settings such as pinhole size, pixel size, and pixel-dwell time must be chosen with great care for ratiometric analysis.
As for all microscopy-based techniques, image quality and acquisition time are inversely correlated. In the present cross-kingdom biofilms, an imaging time of ~30 s, ideally 1 min, was necessary to obtain an appropriate quality for subsequent pH analysis. In comparison, biofilms that only harbor bacteria can be imaged with sufficient quality in 10 s or less29. For microscopy analyses of biofilm growth, structure, or composition, acquisition times of 1 min do not pose a problem, and in many instances, this may also apply to pH recordings. However, extreme pH changes, such as the rapid acidification observed immediately after exposure to glucose (ΔpH > 1 unit/min), are difficult to monitor in cross-kingdom biofilms.
The present work demonstrates that ratiometric pH recordings with C-SNARF-4 are feasible in cross-kingdom biofilms composed of S. mutans and C. albicans. Future studies may employ the method to analyze pH changes in cross-kingdom biofilms with greater species diversity, especially in biofilms grown in situ (i.e. in children with early childhood caries)30. In this study, the pH in the biofilms was monitored under static conditions and for a limited observation time of 15 min, right after a glucose pulse. Further advancements may include the application of a fluid flow to mimic in situ conditions more closely14,31,32. Moreover, pH ratiometry may be used to study the impact of various nutritional conditions on long-term pH changes in cross-kingdom biofilms and contribute to elucidate the effect of biofilm pH on the underlying host tissues. Again, the demineralization of dental enamel in early childhood caries may serve as a prominent example.
Açıklamalar
The authors have nothing to disclose.
Acknowledgements
Anette Aakjær Thomsen and Javier E. Garcia are acknowledged for excellent technical support. The authors thank Rubens Spin-Neto for fruitful discussions on image analysis.
Materials
| Blood agar plates | Statens Serum Institut | 677 | |
| Brain heart infusion | Oxoid | CM1135 | |
| Brain heart infusion + 5 % sucrose | BDH laboratory supplies | 10274 | |
| Candida albicans | National Collection of Pathogenic Fungi | NCPF 3179 | |
| D-(+)-Glucose | Sigma-Aldrich | G8270 | |
| daime: digital image analysis in microbial ecology | Universität Wien | N/A | Freeware; V2.1; https://dome.csb.univie.ac.at/daime |
| Dimethyl sulfoxide | Life Technologies | D12345 | |
| Fetal bovine serum | Gibco Life technologies | 10270 | |
| GS-6R refrigerated centrifuge | Beckman | N/A | |
| ImageJ | National Institutes of Health | N/A | Freeware; V1.46r; https://imagej.nih.gov/ij |
| Java | Oracle | N/A | Freeware necessary to run ImageJ; V8.0; https://java.com/en/download |
| µ-Plate 96 Well Black | Ibidi | 89626 | |
| MyCurveFit | MyAssays Ltd. | N/A | |
| 2-(N-Morpholino)ethanesulfonic acid (MES) buffer | Bioworld | 700728 | |
| PHM210 pH-meter | Radiometer Analytical | ||
| Plan-Apochromat 63x oil immersion objective | Zeiss | N/A | NA=1.4 |
| SNARF®-4F 5-(and-6)-Carboxylic Acid | Life Technologies | S23920 | |
| Sterile physiological saline | VWR | 6404 | |
| Streptococcus mutans | Deutsche Sammlung von Mikroorganismen und Zellkulturen | DSM 20523 | |
| Vis-spectrophotometer V-3000PC | VWR | N/A | |
| XL Incubator | PeCON | N/A | |
| Zeiss LSM 510 META | Zeiss | N/A |
Referanslar
- Siqueira, J. F., Sen, B. H. Fungi in endodontic infections. Oral Surgery, Oral Medicine, Oral Pathology, Oral Radiology, and Endodontics. 97 (5), 632-641 (2004).
- Matic Petrovic, S., et al. Subgingival areas as potential reservoirs of different Candida spp in type 2 diabetes patients and healthy subjects. PloS One. 14 (1), 0210527 (2019).
- De-La-Torre, J., et al. Oral Candida colonization in patients with chronic periodontitis. Is there any relationship. Revista Iberoamericana De Micologia. 35 (3), 134-139 (2018).
- Xu, H., et al. Streptococcal co-infection augments Candida pathogenicity by amplifying the mucosal inflammatory response. Cellular Microbiology. 16 (2), 214-231 (2014).
- Xu, H., Sobue, T., Bertolini, M., Thompson, A., Dongari-Bagtzoglou, A. Streptococcus oralis and Candida albicans Synergistically Activate μ-Calpain to Degrade E-cadherin From Oral Epithelial Junctions. The Journal of Infectious Diseases. 214 (6), 925-934 (2016).
- Dongari-Bagtzoglou, A., Kashleva, H., Dwivedi, P., Diaz, P., Vasilakos, J. Characterization of mucosal Candida albicans biofilms. PloS One. 4 (11), 7967 (2009).
- Diaz, P. I., et al. Synergistic interaction between Candida albicans and commensal oral streptococci in a novel in vitro mucosal model. Infection and Immunity. 80 (2), 620-632 (2012).
- Xiao, J., et al. Candida albicans and Early Childhood Caries: A Systematic Review and Meta-Analysis. Caries Research. 52 (1-2), 102-112 (2018).
- Falsetta, M. L., et al. Symbiotic relationship between Streptococcus mutans and Candida albicans synergizes virulence of plaque biofilms in vivo. Infection and Immunity. 82 (5), 1968-1981 (2014).
- Hwang, G., et al. Candida albicans mannans mediate Streptococcus mutans exoenzyme GtfB binding to modulate cross-kingdom biofilm development in vivo. PLoS Pathogens. 13 (6), 1006407 (2017).
- Koo, H., Falsetta, M. L., Klein, M. I. The exopolysaccharide matrix: a virulence determinant of cariogenic biofilm. Journal of Dental Research. 92 (12), 1065-1073 (2013).
- Schlafer, S., Dige, I. Ratiometric Imaging of Extracellular pH in Dental Biofilms. Journal of Visualized Experiments. (109), 53622 (2016).
- Schlafer, S., Kamp, A., Garcia, J. E. A confocal microscopy-based method to monitor extracellular pH in fungal biofilms. FEMS Yeast Research. 18 (5), (2018).
- Schlafer, S., Bælum, V., Dige, I. Improved pH-ratiometry for the three-dimensional mapping of pH microenvironments in biofilms under flow conditions. Journal of Microbiological Methods. 152, 194-200 (2018).
- Hidalgo, G., et al. Functional tomographic fluorescence imaging of pH microenvironments in microbial biofilms by use of silica nanoparticle sensors. Applied and Environmental Microbiology. 75 (23), 7426-7435 (2009).
- Vroom, J. M., et al. Depth Penetration and Detection of pH Gradients in Biofilms by Two-Photon Excitation Microscopy. Applied and Environmental Microbiology. 65, 3502-3511 (1999).
- Lawrence, J. R., Swerhone, G. D. W., Kuhlicke, U., Neu, T. R. In situ evidence for metabolic and chemical microdomains in the structured polymer matrix of bacterial microcolonies. FEMS Microbiology Ecology. 92 (11), (2016).
- Franks, A. E., et al. Novel strategy for three-dimensional real-time imaging of microbial fuel cell communities: monitoring the inhibitory effects of proton accumulation within the anode biofilm. Energy Environmental Science. 2 (1), 113-119 (2009).
- de Jong, M. H., van der Hoeven, J. S., van OS, J. H., Olijve, J. H. Growth of oral Streptococcus species and Actinomyces viscosus in human saliva. Applied and Environmental Microbiology. 47 (5), 901-904 (1984).
- Schneider, C. A., Rasband, W. S., Eliceiri, K. W. NIH Image to ImageJ: 25 years of image analysis. Nature Methods. 9 (7), 671-675 (2012).
- Daims, H., Lücker, S., Wagner, M. Daime, a novel image analysis program for microbial ecology and biofilm research. Environmental Microbiology. 8 (2), 200-213 (2006).
- Barbosa, J. O., et al. Streptococcus mutans Can Modulate Biofilm Formation and Attenuate the Virulence of Candida albicans. PloS One. 11 (3), 0150457 (2016).
- Thein, Z. M., Samaranayake, Y. H., Samaranayake, L. P. Effect of oral bacteria on growth and survival of Candida albicans biofilms. Archives of Oral Biology. 51 (8), 672-680 (2006).
- Krzyściak, W., et al. Effect of a Lactobacillus Salivarius Probiotic on a Double-Species Streptococcus Mutans and Candida Albicans Caries Biofilm. Nutrients. 9 (11), 1242 (2017).
- Liu, S., et al. Nicotine Enhances Interspecies Relationship between Streptococcus mutans and Candida albicans. BioMed Research International. 2017, 7953920 (2017).
- Schlafer, S., Meyer, R. L. Confocal microscopy imaging of the biofilm matrix. Journal of Microbiological Methods. 138, 50-59 (2017).
- Schlafer, S., et al. Ratiometric imaging of extracellular pH in bacterial biofilms with C-SNARF-4. Applied and Environmental Microbiology. 81 (4), 1267-1273 (2015).
- Ohle, C., et al. Real-time microsensor measurement of local metabolic activities in ex vivo dental biofilms exposed to sucrose and treated with chlorhexidine. Applied and Environmental Microbiology. 76 (7), 2326-2334 (2010).
- Schlafer, S., et al. pH landscapes in a novel five-species model of early dental biofilm. PloS One. 6 (9), 25299 (2011).
- Divaris, K., et al. The Supragingival Biofilm in Early Childhood Caries: Clinical and Laboratory Protocols and Bioinformatics Pipelines Supporting Metagenomics, Metatranscriptomics, and Metabolomics Studies of the Oral Microbiome. Methods in Molecular Biology. 1922, 525-548 (2019).
- Stewart, P. S. Mini review: convection around biofilms. Biofouling. 28 (2), 187-198 (2012).
- Stoodley, P. Biofilms: Flow disrupts communication. Nature Microbiology. 1, 15012 (2016).

