Procedure and Key Optimization Strategies for an Automated Capillary Electrophoretic-based Immunoassay Method
Özet
A capillary-based immunoassay using a commercial platform to measure target proteins from total protein preparations is demonstrated. In addition, assay parameters of exposure time, protein concentration, and antibody dilution are optimized for a cell culture model system.
Abstract
New technologies that utilize capillary-based immunoassays promise faster and more quantitative protein assessment compared to traditional immunoassays. However, similar to other antibody-based protein assays, optimization of capillary-based immunoassay parameters, such as protein concentration, antibody dilution, and exposure time is an important prerequisite to the generation of meaningful and reliable data. Measurements must fall within the linear range of the assay where changes in signal are directly proportional to changes in lysate concentration. The process of choosing appropriate lysate concentrations, antibody dilutions, and exposure times in the human bronchial epithelial cell line, BEAS-2B, is demonstrated here. Assay linearity is shown over a range of whole cell extract protein concentrations with p53 and α-tubulin antibodies. An example of signal burnout is seen at the highest concentrations with long exposure times, and an α-tubulin antibody dilution curve is shown demonstrating saturation. In addition, example experimental results are reported for doxorubicin-treated cells using optimized parameters.
Introduction
Capillary electrophoretic immunoassays measure protein expression in cell lysates using size or charge separation systems and provide several advantages over the traditional immunoassays. For example, when compared to western blot, the automated capillary-based procedure eliminates the need for gels, transfer devices, and manual washes. In addition, the absolute amount of protein required is approximately 10 times less, making capillary-based systems ideal for use with rare cell types or limited sample1,2. Results are obtained in as little as 3 h using automated systems and have previously been demonstrated to be more quantitative and reproducible than conventional western blot procedures3,4,5. The process for size-based assays consists of loading samples containing sodium dodecyl sulfate (SDS), dithiothreitol (DTT), and fluorescently labeled molecular weight markers into capillary columns containing stacking and separation matrices. Voltage applied to the capillaries separates the proteins in the samples according to size, and UV light immobilizes the separated proteins to the capillary wall. The capillary is then immuno-probed with target-specific primary antibody and horseradish peroxidase (HRP)-conjugated secondary antibody. Luminol and peroxide catalyze chemiluminescent light generation which is measured by a charge coupled device (CCD) camera and analyzed to quantitate protein.
Despite the relative ease and speed of an automated capillary-based electrophoretic immunoassay platform, optimization of assay conditions such as protein concentration, antibody dilution, and exposure time is important for obtaining accurate, reproducible results. In general, the following procedures should be performed to optimize an assay for these systems:
1) A screen should be performed to evaluate and choose antibodies for signal and specificity to the protein target. If available, purified protein or target epitope can be used to assess specificity; however, it is still important to assess potential non-specific signal in total protein sourced from the model system.
2) Next, the dynamic range of the assay needs to be determined. In an ideal situation, signal doubling (measured using peak area) is observed as sample concentration is doubled; however, in practice, a proportional change in signal to input in a predictable manner (e.g., linear fit) is sufficient for protein quantification. Additionally, this optimization will define protein concentration with high signal but still within the linear range for the experimental model.
3) Determine the optimal antibody concentration using the fixed protein concentration chosen in optimization step 2. As the antibody concentration increases, the signal increases until it plateaus at saturation. An antibody concentration near this saturation level is required for accurate measurement of protein concentration.
The process used to optimize protein concentrations, antibody dilutions, and exposure times for an automated capillary-based size assay6 is demonstrated using whole cell extracts isolated from BEAS-2B, an SV-40 transformed human bronchial epithelial cell line. Protein isolation from cell or tissue extracts can be performed using a number of published protocols7,8,9 and will not be covered here. Results of a trial experiment using the optimized conditions are also reported for total and phosphorylated (serine 15, serine 20) p53 in cultures exposed to doxorubicin (a common chemotherapeutic agent that induces cell apoptosis10) at 1.2, 1.8, and 2.4 µg/mL media for 4 h prior to harvest. The p53 peak areas are normalized to ɑ-tubulin, which is used as a loading control.
Protocol
NOTE: Ensure that all reagents and samples are prepared according to the manufacturer's protocol, outlined below. Please wear proper personal protection equipment during this procedure, which includes nitrile gloves, lab coat, closed-toed shoes, and safety goggles. A table of specific materials, reagents and equipment required is provided separately. Total protein concentration of samples should be determined beforehand using established methodologies that are compatible with the lysate buffer used, such as Bradford assay11.
1. Preparation of samples and reagents from the standard pack as supplied by the manufacturer
- To prepare the 400 mM working solution of dithiothreitol (DTT), add 40 µL deionized water to the clear tube containing the supplied stock from the manufacturer. It is important to avoid introducing bubbles to the solution by mixing the solution with slow and gentle pipetting.
- Add 20 µL 10X sample buffer and 20 µL of the prepared 400 mM DTT solution to the pink tube containing fluorescent 5X master mix (see the Table of Materials).
NOTE: The Master Mix (MM) is sealed by the manufacturer with a foil cover and must be pierced by a pipette tip. Mix gently by slow pipetting to avoid splashing DTT in the pipette. - Next, add 16 µL deionized water, 2 µL of supplied 10X sample buffer, and 2 µL of the prepared 400 mM DTT solution to the white biotinylated ladder tube supplied by the manufacturer. Mix gently and transfer into a 0.6 mL tube for denaturing.
- Prepare 0.1x sample buffer by diluting the supplied 10X solution 1:100 with water. Prepare enough 0.1x sample buffer to dilute all samples.
- Calculate the amount of 0.1x sample buffer that is added to a sample, which will depend on the final desired concentration of the total protein. Mix 1 part 5x fluorescent MM with 4 parts diluted sample to achieve the desired final protein concentration.
- Calculate volumes as follows: (i) Volume 5x fluorescent MM = (Desired final protein concentration)/5; (ii) Volume of protein stock = (Desired final protein concentration x Total volume needed)/ Protein stock concentration; (iii) Volume 0.1x sample buffer = Total volume – 5x MM volume – Protein stock volume.
2. Denaturation of samples and ladder
- Place prepared samples and biotinylated ladder in a 95 °C heat block for 5 min. Vortex tubes immediately after incubation, execute a spin for ~5 s in a tabletop centrifuge, and place on ice.
NOTE: Some proteins may require gentler denaturing conditions (e.g., 70 oC for 10 min) to prevent protein aggregation and improve migration in the capillary matrix. Consider this option if there is heavy smearing at the higher molecular weights (see video for example).
3. Preparation of antibodies
- As determined by optimization (see Representative Results and video), prepare the desired dilution(s) of primary antibody (e.g., 1:50, 1:100) in the provided Antibody Diluent 2.
NOTE: Antibodies are generally used at higher concentrations for capillary-based immunoassay than for traditional western blotting. The supplied secondary antibody is ready to use without dilution.
4. Preparation of Luminol-S and Peroxide
- Prepare a 1:1 mixture of luminol-S and peroxide.
- Vortex to mix and store on ice.
NOTE: It is important that this mixture is prepared fresh for each experimental assay. 250ul total mix is needed to run a full plate.
5. Preparation of the assay plate
- As shown in Figure 1, load the samples and reagents prepared above into the assay plate. See detailed instructions below for each row. To minimize evaporation from the wells, ensure that the plate lid is replaced between reagent additions.
- In row A, pipet 5 µL of Biotinylated Ladder into well A1. For the remaining row, pipet prepared samples (5 µL each) into wells A2-A25.
NOTE: It is imperative that the A1 well always contains ladder, as the first capillary in the cartridge is optimized for running this standard. - In row B, pipet 10 µL of Antibody Diluent 2 into each well (B1-B25).
- In row C, pipet 10 µL of Antibody Diluent 2 into well C1. In the remaining row C wells, pipet 10 µL of primary antibody (wells C2-C25).
- In row D, pipet 10 µL of Streptavidin-HRP into well D1. In the remaining row D wells, pipet 10 µL of secondary antibody (wells D2-D25).
- In row E, pipet 10 µL of the freshly prepared luminol-peroxide mix into each well (E1-E25).
- Finally, add 500 µL wash buffer per compartment to each of the top 3 rows of buffer wells.
NOTE: It is important to minimize bubble formation by pipetting gently and not expelling the final volume from the tip as bubbles may interfere with the capillary loading and run. - Once all wells are loaded, centrifuge the plate at ~1000 x g for 5 min at room temperature to remove bubbles and ensure the liquid is in the bottom of the wells. Pop any visible bubbles with a small pipette tip or clean needle (e.g., 25 gauge sterile "rep top" needle).
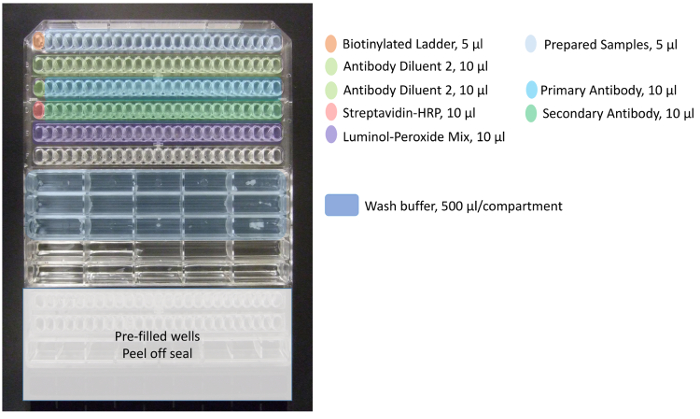
Figure 1. Pipetting template for assay plate. Color coding represents proper reagents and samples (up to 24 total) added to the assay plate. Add biotinylated ladder to well A1 (orange), prepared samples from wells A2 up to A25 (light blue), Antibody Diluent 2 to wells B1-B25 and C1 (light green), primary antibody to wells C2 up to C25 (blue), streptavidin-HRP to well D1 (dark pink), secondary antibody to wells D2 up to D25 (dark green), and luminol-peroxide mix to wells E1 up to E25 (purple). Wash buffer is added to the first three rows of the larger mid-plate wells (dark blue). Please click here to view a larger version of this figure.
6. Starting the capillary immunoassay instrument
- Ensure that the instrument and the accompanying computer are turned on. No warm up time is needed.
- Open the instrumentation software on the computer. First, select the "Assay" tab on the right of the window and "New Assay" under the "File Menu" on the left. Select the size, size range (e.g., 12-230 kDa), and cartridge type (e.g., 25 capillary) that was used for the particular assay.
NOTE: One may also input assay parameters, including protein concentration, antibody type, and dilution, if desired, but these are not required to start the assay. - Open the door on the instrument by pushing the button on top of the orange panel.
- Carefully remove the capillary cartridge from its packaging. Without touching the glass capillaries themselves, place the cartridge into the cartridge holder. Verify cartridge seating by observing the interior light change from orange to blue.
- Hold the plate firmly on the bench and carefully peel off the evaporation seal from the lower portion of the plate. Pop any bubbles seen in these separation matrix wells with a small pipet tip or clean needle (e.g., 25 gauge sterile "rep top" needle).
- Place the assay plate on the plate holder, ensuring it is fully seated, and close the instrument door.
- Click the "Start" button in the software.
NOTE: If no Start button appears, the connection with the instrument has been lost. Choose Instrument from the top left menu, then Connect. A pop-up should appear with the instrument serial number; select this, then click Connect. The Start button should now appear. - When the run is complete, discard the plate. Remove the cartridge and place in a sharps container for disposal, along with any needles that may have been used to pop bubbles. Leave the power on to avoid connection problems if the instrument is being used regularly (e.g., at least weekly).
7. Experiment analysis
- Before analysis, ensure the following quality checks are performed.
- Verify fluorescent standards by selecting the "Show Standards" icon. Check that the standards are correctly identified in the "Graph View" tab. If they are incorrect, go to the "Single View" icon, right click on the correct peak, and select "Force Standard", or right click on the incorrect peak and select "Not a Standard". Perform this check for each new capillary.
- Verify biotinylated ladder by clicking on the "Samples" and "Single View" icons. Select the ladder in the experiment tab. If a peak is incorrectly identified, right click on it in "Graph View" and select "Remove Peak".
NOTE: For example, the biotinylated ladder used for the 12 – 230 kDa kit should show 12, 40, 66, 116, 180, and 230 kDa sizing peaks. If this step is not performed, the sizing of the sample peaks will be incorrectly calculated, producing spurious results. - View and analyze sample peaks. Derive data from the peaks table, including molecular weight, peak area, peak height, and signal to noise (S/N), as needed for experimental calculations.
Representative Results
Exposure time – Determining signal burnout
Signal burnout can occur when the luminol and peroxide substrate is depleted too quickly. This can be determined by examining the data at different chemiluminescence exposure times. In the analysis software, go to "Edit -> Analysis -> Images". Exposures range from 5 to 480 s. The y-axis in an electropherogram reports signal/time, so the data from each exposure should have a similar signal/time coefficient. This coefficient decreases with sequentially longer exposures if luminol becomes depleted, as seen with the p53 DO-1 antibody (Figure 2). Because of substrate depletion, this assay can be considered measurable up to the 0.2 µg/µL concentration only at the 5 – 30 s exposures. Therefore, in this example, 15 s was determined to be the optimal data analysis exposure time for p53.
Lysate titration – Determining linear dynamic range
It is important that measurements be taken within the linear dynamic range of each assay, where changes in signal as measured by peak area are proportional to changes in the amount of protein in the sample. Using the optimal exposure time of 15 s chosen in the previous section, assay linearity is demonstrated for both p53 and ɑ-tubulin over greater than a 15-fold range of concentration (Figure 3). In our experience, a R2 value of >0.9 of a linear regression fit is considered acceptable for a dilution range of purified protein of known quantity (if assay is an absolute quantitative measurement) or sample lysate of unknown target protein (if assay is a relative quantitative measurement).
Optimization of antibody dilution
Using antibodies at saturating concentrations helps ensure that any signal changes measured are due only to changes in protein amount. As a demonstration, two BEAS-2B cell line whole cell extracts (0.2 µg/µL total protein loaded into the assay) were probed with serially diluted ɑ-tubulin antibody concentrations ranging from 1:25 – 1:800 (Figure 4). Chemiluminescent signal (here, measured as peak area) was plotted against antibody dilution. Saturation was observed near the 1:50 dilution where the curve begins a noticeable plateau.
Experimental trial – Doxorubicin treatment in BEAS-2B cells
Using optimized assay conditions, BEAS-2B cell culture was treated with three different concentrations of doxorubicin (1.2, 1.8, and 2.4 µg/mL) for 4 h (Figure 5, Table 1). Activation of p53 through post-translational modifications mediates several cellular responses, including cell cycle arrest, senescence, and apoptosis12. Specifically, the phosphorylation of serine 15 has been attributed to transcriptional activation of p53, resulting in apoptosis after doxorubicin treatment13. In this demonstration, ɑ-tubulin normalized peak areas are presented as fold of control. Interestingly, 3.5 to 4-fold increases in p53 phosphorylation at serine 15 and 2-fold increases in the level of p53 phosphorylated at serine 20 were observed after 4 h exposure to doxorubicin. These results indicate activation of p53; however, no dose-response is seen for the concentrations chosen (conversely, the lowest dose tested elicited the highest response). Total p53 did not demonstrate a clear treatment response in this model system. We have previously observed activation of p53 phosphorylation in the absence of increased levels of total p53 under similar conditions in zinc-treated BEAS-2B cells14.
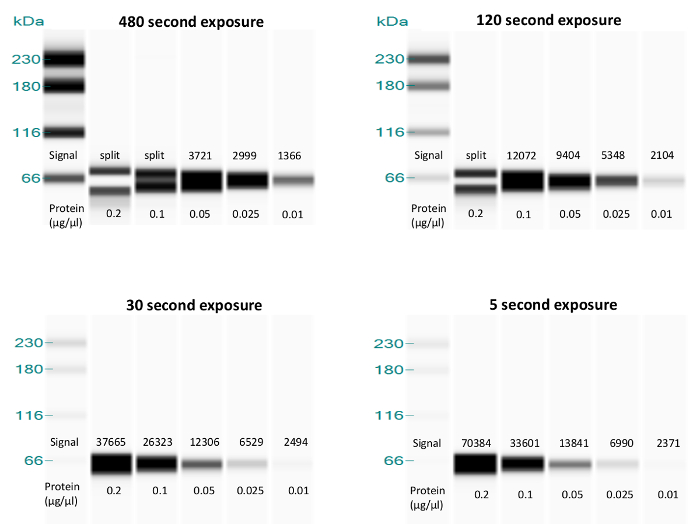
Figure 2. Exposure image comparison to detect signal burnout. Lane views show decreasing protein concentrations for BEAS-2B lysates probed with p53 DO-1 antibody at a 1:500 dilution. Chemiluminescence signal coefficients, reported as peak heights in the instrument software, are superimposed. Unlike the peak heights, the visual band intensities are automatically generated and adjusted by the instrument to aid viewing of the bands and are not comparable from one panel to another. Note the decrease in chemiluminescence signal as exposure time increases, with the signal beginning to disappear (split peak) at the two longest exposures, indicating substrate depletion. Please click here to view a larger version of this figure.
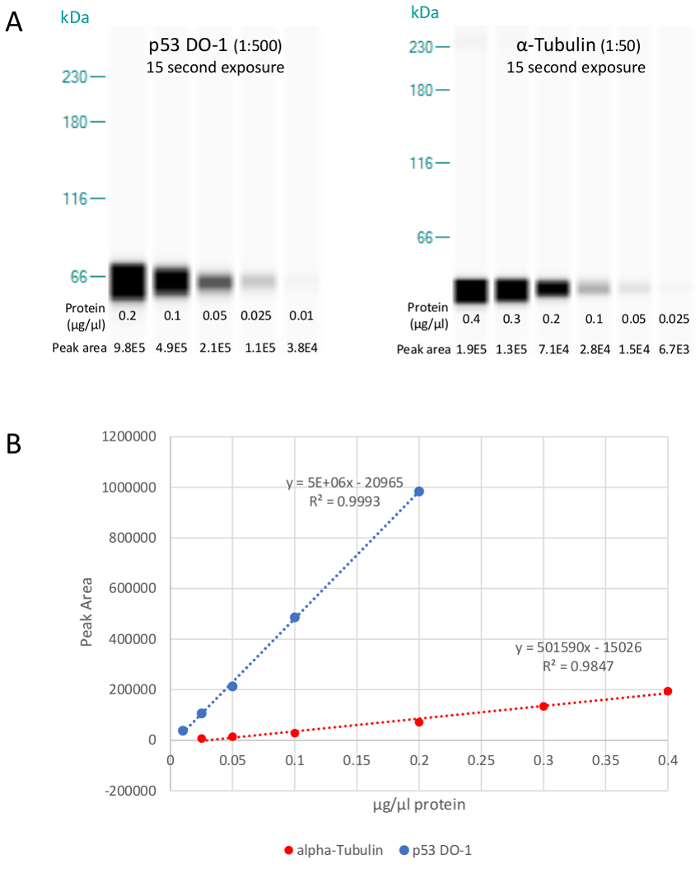
Figure 3. Lysate titration showing the lane views. Lysate titration showing the lane views (A) of BEAS-2B lysate when probed with 1:500 p53 DO-1 or 1:50 ɑ-tubulin. Unlike the peak area values, the visual band intensities are automatically generated and adjusted by the instrument to aid viewing of the bands and are not comparable from one panel to another. Linear regression analysis (B) confirms the assays are linear over the entire range tested, from 0.01 to 0.20 µg/µL and 0.025 to 0.40 µg/µL, with R2 values of 0.999 and 0.985, respectively. Total protein concentrations in the middle of the linear range were chosen to accommodate potential target protein variation in either direction (e.g., 0.2 µg/µL for α-tubulin). Please click here to view a larger version of this figure.
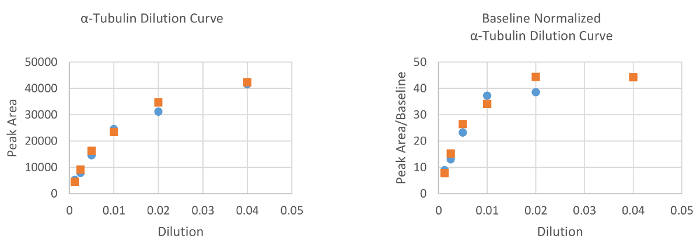
Figure 4. α-tubulin antibody dilution curves for two separate BEAS-2B protein lysates with and without baseline normalization. A definite departure from linearity is seen at the 1:50 (0.02) dilution, indicating saturation. 1:50 was therefore chosen as the optimal dilution for this antibody. Please click here to view a larger version of this figure.
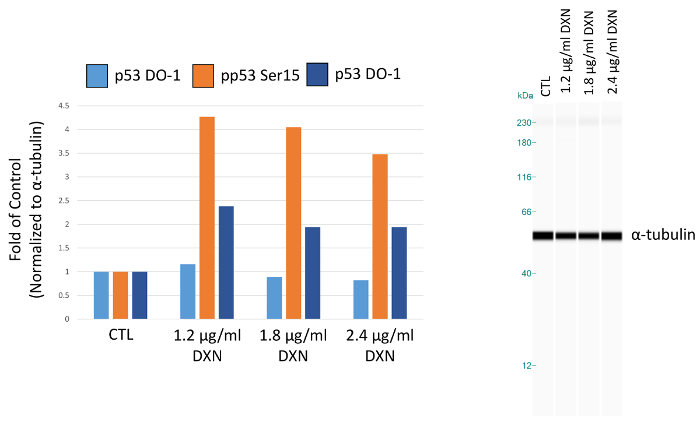
Figure 5.Effect of 4 h doxorubicin (DXN) treatment on total and serine phosphorylated p53 protein expression of BEAS-2B cells. Peak areas are normalized to α-tubulin and plotted as fold of control (CTL). Please click here to view a larger version of this figure.

Table 1. Effect of 4 h doxorubicin (DXN) treatment on total and serine phosphorylated p53 protein expression of BEAS-2B cells. Please click here to view a larger version of this table.
Discussion
For decades, there has been sustained interest in the development of capillary electrophoretic-based immunoassay methods because of low sample and reagent expenditure, decreased processing time when compared to traditional methods, and high compatibility to automate the procedure4,15. There are a number of different protocols for the separation of proteins that have utilized capillaries, including electrophoretic, electrokinetic, polymer sieving, and isoelectric methods, which isolate proteins by different properties (respectively, electrostatic charge, partition equilibrium, sieving properties of the separating matrix, and pH)16. Here, we describe an antibody-based (or immunoassay) capillary electrophoresis method, using a polymer sieving separation, that has been automated and commercially adopted3. Advantages of this system include ease of use and operation, standardized and commercially available reagents, and reliable, sensitive measurements that require less reagent and samples compared to traditional protein assays such as western blot, enzyme-linked immunoassay, and other formats3,4,5. It has been noted in previous assessments of this technology that the size range of protein that can be assessed has been limited by the available separation matrix4, however recent offerings have expanded the measurable range from 2 to 440 kDa17. In addition, some lysate buffers are known to be incompatible with the assay18, therefore selection of the experimental reagents used must be considered beforehand.
A major advantage of an automated procedure with commercially available components is consistency of results through standardized methods and reagents. This minimizes chances of assay failure by automating critical steps within the procedure. However, it is important to note that certain practices must be adhered to during the protocol to minimize issues with the capillary electrophoretic-based immunoassay. First, it is critical that the luminol-S/peroxide mixture is prepared fresh and immediately before plate loading. Consistent timing will result in consistent luminescence after the oxidizing agent is added, which will result in consistent measurements for a particular antibody assay after assay. Furthermore, it is important that non-expired reagents are used, which primarily affects the potency of the oxidizing agent. Additionally, it is important that the loading order of samples, antibodies, and other reagents be strictly followed (see Figure 1). Any reagent pipetted out of place will result in assay failure and a wasted run.
Besides these critical steps, primary issues experienced with the technique can generally be overcome through optimization. Indeed, these conditions are specific to each model system/antibody combination and therefore should be determined empirically for each new assay. In this article, we focus on three common optimization procedures: exposure time, lysate titration, and primary antibody dilution. The ability to generate measurable results depends on analysis of an exposure time when the luminol substrate is not being rapidly depleted, as substrate depletion results in loss of signal. Lysate titration determines the linear dynamic range of each assay, which can differ with different model systems, as well as different antibodies, even for the same protein target. Antibody dilutions chosen at or near saturating concentrations ensure changes in signal will not be affected by a shortage of free antibody, but only by differing amount of available protein target epitope. Other considerations during the optimization process may include antibody incubation time and stacking/sample loading time. In most cases the default settings for the instrument offer the best balance of resolution and sensitivity. However, in some cases, poor resolution or sensitivity can be improved by adjusting these parameters.
Capillary electrophoretic-based immunoassay methods provide fast, efficient, and reproducible protein measurements. While these methods have primarily been utilized in research and development settings, the consistency of these technologies has potential utility in regulatory and clinical applications. For example, the identification of susceptible subpopulations to environmental toxicants or patients with progression of disease can be based on protein biomarkers measured in accessible matrices, such as blood, urine, and saliva. As reagent and operation costs drop and the number of samples and targets that can be simultaneously assessed increases, we will likely see capillary electrophoretic-based immunoassay methods used for these types of applications.
Açıklamalar
The authors have nothing to disclose.
Acknowledgements
The authors would like to thank Keith Tarpley of the US EPA Office of Research and Development-Research Triangle Park (ORD-RTP) Graphic and Media team for development, taping, and editing of the instructional video. We would also like to thank Deborah Pritchett from ProteinSimple for helpful conversations regarding optimization of our data. JM Guynn was supported by the Oak Ridge Institute for Science and Education Research/Participation Program at the US Environmental Protection Agency.
Materials
| Wes instrument | ProteinSimple (Santa Clara, CA) | 004-600 | |
| P53 DO-1 primary antibody | Santa Cruz Biotechnology, Inc. | sc-126 | |
| phosphorylated p53 (ser 15) primary antibody | Cell Signaling Technology | 9286 | |
| phosphorylated p53 (ser 20) primary antibody | Cell Signaling Technology | 9287 | |
| alpha-tubulin primary antibody | Cell Signaling Technology | 3873 | used as a loading control |
| Compass Software | ProteinSimple (Santa Clara, CA) | provided with the Wes | |
| 12-230 kDa Master kit | ProteinSimple (Santa Clara, CA) | PS MK02 (since replaced by a new kit #) | |
| www.proteinsimple.com/consumables_sw_wes.html | INCLUDES PART NO: Wash Buffer (60 mL) 042-202 10X Sample Buffer (440 μL) 042-195 Pre-Filled Microplates (8) PS-PP01 Capillary Cartridges (8) PS-CC01 Antibody Diluent II (20 mL) 042-203 Luminol-S (1.5 mL) 042-233 Peroxide (1.5 mL) 042-234 Streptavidin-HRP (132 μL) 042-414 Standard Pack (8): Biotinylated ladder, fluorescent 5X master mix, DTT, and empty 0.6 mL tube PS-ST01 Anti-Rabbit Secondary Antibody 042-206 or Anti-Mouse Secondary Antibody 042-205 |
||
| Name | Company | Catalog Number | Yorumlar |
| Cell culture, treatment, and harvest (using vendor recommended protocols; protocols not included in manuscript) | |||
| BEAS-2B cells | American Type Culture Collection (ATCC, Manassas, VA) | CRL-9609 | |
| keratinocyte growth medium, KGM Gold | Lonza Ltd (Basel, Switzerland) | 192152 | for cell culture |
| keratinocyte basal medium, KBM Gold | Lonza Ltd (Basel, Switzerland) | 192151 | serum free medium for chemical dosing |
| doxorubicin | Sigma-Aldrich (St. Louis, MO) | D1515 | |
| Coomassie Blue Bradford Assays | ThermoFisher Scientific (Waltham, MA) | 23200 | for protein quantification |
| Nuclear Extract kit | Active Motif (Carlsbad, CA) | D1515 | used to prepare whole cell lysates |
| INCLUDES: | |||
| Lysis Buffer AM1 | |||
| 1M dithiothreitol (DTT) | |||
| Protease Inhibitor Cocktail | |||
| 10X PBS | |||
| Phosphatase Inhibitors | |||
Referanslar
- Bradley, H. L., Sabnis, H., Pritchett, D., Bunting, K. D. . Hematopoietic stem cell protocols. 1185, (2014).
- Guo, L., Eldridge, S., Furniss, M., Mussio, J., Davis, M. Use of Human Induced Pluripotent Stem Cell-Derived Cardiomyocytes (hiPSC-CMs) to Monitor Compound Effects on Cardiac Myocyte Signaling Pathways. Curr Protoc Chem Biol. 7 (3), 141-185 (2015).
- Chen, J. Q., et al. Absolute quantitation of endogenous proteins with precision and accuracy using a capillary Western system. Anal Biochem. 442 (1), 97-103 (2013).
- Chen, J. Q., Wakefield, L. M., Goldstein, D. J. Capillary nano-immunoassays: advancing quantitative proteomics analysis, biomarker assessment, and molecular diagnostics. J Transl Med. 13, 182 (2015).
- Liu, S., et al. The Application of a Novel Nanovolume Capillary Electrophoresis- Based Protein Analysis System in Personalized & Translational Medicine Research. J Bioanal Biomed. S3 (004), (2013).
- ProteinSimple Western. . Size Assay Development Guide, Revision 1. , (2014).
- Eaton, S. L., et al. A guide to modern quantitative fluorescent western blotting with troubleshooting strategies. J Vis Exp. (93), (2014).
- Eslami, A., Lujan, J. Western blotting: sample preparation to detection. J Vis Exp. (44), (2010).
- Silva, J. M., McMahon, M. The fastest Western in town: a contemporary twist on the classic Western blot analysis. J Vis Exp. (84), e51149 (2014).
- Thorn, C. F., et al. Doxorubicin pathways: pharmacodynamics and adverse effects. Pharmacogenet Genomics. 21 (7), 440-446 (2011).
- Ernst, O., Zor, T. Linearization of the bradford protein assay. J Vis Exp. (38), (2010).
- Taira, N., Yoshida, K. Post-translational modifications of p53 tumor suppressor: determinants of its functional targets. Histol Histopathol. 27 (4), 437-443 (2012).
- Thompson, T., et al. Phosphorylation of p53 on key serines is dispensable for transcriptional activation and apoptosis. J Biol Chem. 279 (51), 53015-53022 (2004).
- Currier, J. M., Cheng, W. Y., Menendez, D., Conolly, R., Chorley, B. N. Developing a Gene Biomarker at the Tipping Point of Adaptive and Adverse Responses in Human Bronchial Epithelial Cells. PLoS One. 11 (5), e0155875 (2016).
- Moser, A. C., Hage, D. S. Capillary electrophoresis-based immunoassays: principles and quantitative applications. Electrophoresis. 29 (16), 3279-3295 (2008).
- Shintani, H. . Handbook of Capillary Electrophoresis Applications. , (1997).
- . Wes reagents and consumables :: ProteinSimple Available from: https://www.proteinsimple.com/consumables_sw_wes.html (2017)

