High-frequency High-resolution Echocardiography: First Evidence on Non-invasive Repeated Measure of Myocardial Strain, Contractility, and Mitral Regurgitation in the Ischemia-reperfused Murine Heart
Summary
High frequency Doppler ultrasound is a novel technology for assessing regional myocardial function. This work presents first evidence demonstrating applicability of this versatile imaging platform for the repeated measure of myocardial strain, dp/dt, and mitral regurgitation in the ischemia-reperfused (IR) murine heart.
Abstract
Protocol
Experimental Protocols
The following different protocols were used to establish feasibility of measurements aimed at investigating the IR murine heart non-invasively. Baseline echocardiographic imaging was followed by surgical induction of ischemia-reperfusion (IR, protocol 1) which was followed by echocardiography at multiple time-points during recovery from IR.
Protocol 1. Left Anterior Descending (LAD) artery IR: Surgical Procedure
Male C57BL/6 adult mice (8-week old; 24.5±1.5g, mean±SD; Harlan Technologies, IN) were maintained under standard laboratory housing conditions with access to chow and drinking water ad libitum. Mice were anesthetized using intraperitoneal injection of a mixture of ketamine (100 mg/kg) and xylazine (10mg/kg), laid on a warm surgical table, and intubated endotracheally. Proper anesthetic plane for rodents is deduced by a cessation of toe pinch reflexes and a slowing of respiration. Instruments were sterilized via 70% ethanol washes and autoclaving. Any instruments that left the sterile field were inserted into a hot-bead instrument sterilizer for 1 minute before continuing use. The mice were ventilated (Harvard Apparatus, Boston, MA) using air-isoflurane mixture at an appropriate rate and tidal volume. Cardiac electrophysiology was monitored throughout the surgery using a three-lead ECG setup, and changes were recorded using PC Powerlab software (AD Instruments).
The heart was accessed via left thoracotomy. The left lung was retracted to allow access to the pericardium. The left auricle was elevated to expose the coronary LAD artery, which was isolated using 7-0 Prolene suture mounted on a tapered needle. The suture was tightened over a piece of PE-10 tubing to induce reversible ischemia. LAD was occluded for 60 minutes. After 60 min, the suture was released to allow for reperfusion of the injured myocardium. Upon successful reperfusion, the thorax was closed with interrupted 7-0 Prolene sutures as well as the skin incision with 5-0 Prolene sutures.
Throughout the surgery, body temperature was maintained at 36.7 ± 0.5°C using a heated surgical table and monitored with a rectal thermal probe. The ischemic-episode causes pale coloration of LV myocardium that can be visually appreciated. Thorax was closed, sutured, and tracheal tube was disconnected enabling the mouse to breathe on its own. The animal was then returned to its cage and placed on a heating block set to 37°C. Once the recovery was complete, the animal was returned to the rodent vivarium unit prior to echocardiographic imaging. All procedures were approved by the Institutional Laboratory Animal Care and Use Committee (ILACUC) of the Ohio State University.
Protocol 2. M-mode imaging protocol for the determination of cardiac function and detection of wall motion abnormality
To assess radial and longitudinal changes in cardiac function and wall motion abnormalities, we performed pre-IR imaging using high frequency, high resolution ultrasound scanner (Visual Sonics Inc., Toronto, Canada). Standard M-mode echocardiography parameters such as wall dimensions, volumes at systole, diastole and stroke volume, ejection fractions (EF), fractional shortening (FS), cardiac output (CO), and internal diameters at systole and diastole, were assessed using in-built M-mode protocol at each time point (pre-IR, day 3 and day 7).
Protocol 3. VevoStrain Speckle tracking algorithm protocol
B-mode movies were acquired and subjected to process using in-built VevoStrain algorithm to perform strain analyses. This allows assessment of velocity, displacement, strain, and strain rate through separate radio buttons provided in the interface giving interactive plots and M-mode images along with the data values which was done by clicking desired icons in the control panel.
Speckle Tracking Assessment of Strains
2-D Grayscale cine loops were acquired in the LV short-axis view at a frame rate of >275 frames/s. For each experiment, at least three consecutive cardiac cycles were recorded and digitally stored on a hard disk for offline analysis on a workstation. We used a speckle-tracking algorithm incorporated into Vevo2100. The strain analysis was performed by the same trained observer. The region of interest was overlaid across a cross section of the ventricle at the image corresponding to the minimal endocardial area. The software algorithm then automatically divided the LV short-axis view into six segments for speckle tracking throughout the cardiac cycle. The tracking quality was then visually inspected, and, if it was satisfactory for at least five segments, the tracing was accepted.
Protocol 4. Doppler flow measurement protocol
To study the mitral valve regurgitation and to calculate the rate of change of LV systolic blood pressure (dP/dt), Doppler flow detection protocol was used. For this purpose, power Doppler blood flow velocity profiles were acquired by placing the probe on the mitral valve regurgitant jet and aortic jet. Imaging of blood flow velocity was followed by measurement to obtain values of the parameters such as peak and mean velocity, peak and mean pressure gradients, velocity time integral, and time. For the computation of dP/dt, mitral valve regurgitant velocity profile was used to measure velocity at early systole (steepest slope of the velocity profile to minimize load dependency) and corresponding time of slope. Finally, Bernoulli s equation provided the velocity-pressure conversion to determine the rate of increase of systolic pressure.
Echocardiographic Data Acquisition
Mice were imaged in a conscious state at a room temperature of 37°C with decreased ambient lighting while held by an experienced handler in a prone left decubitus position. The heart was imaged in the 2-D mode in the parasternal long- and short-axis views with a depth setting of 1.0 cm and at a frame rate of ≥ 270 frames/s. An M-mode image was obtained at a sweep speed of 200 mm/s. All measurements were done according to guidelines provided by the American Society of Echocardiography.
Imaging was performed in conscious mice along with tandem registration of the electrocardiogram. End systole was defined as the minimum LV area. Segmental Scirc and Srad curves were then constructed by integrating appropriate signals starting from the end-diastolic points and then averaged to obtain average segmental strain curves. End-systolic strains were then obtained from the average strain curve.
Representative Results
Two-dimensional movies acquired at high frame rate (8 kHz) were utilized to estimate high-quality myocardial strain. Two-dimensional elastograms (strain images), as well as strain profiles as a function of time helped appreciate the functional consequence of IR. The above-mentioned approach led to the reliable detection of the following parameters:
Standard IR Outcomes (commonly reported in the literature)
- left-ventricular (LV) contraction
- injury impairs the contraction and relaxation in the heart resulting in functional loss
- changes in LV chamber area and mass (hypertrophy)
- LV relaxation of isovolumetric phases of both pre-IR and post-IR of beating hearts
- compromised sector-wise wall motion
- turbulence in blood flow pattern as revealed by the color Doppler movies and velocity profiles
- LV shape changes towards sphericity
- compromised ejection fraction
- attenuated fractional shortening
Unique post-IR Outcomes
(never before reported in a murine IR setting but known to be of clinical significance in humans)
- effective regurgitant orifice (ERO)
- a fundamental measure of valvular incompetence
- decreased myocardial strains (circumferential as well as radial)
- a fundamental measure of myocardial strength and anatomical deformation
- asynchrony in LV sectors
- a fundamental measure of inherent periodic pumping characteristics of the heart
- wall motion and symmetry
- changes in magnitude and direction of vectors demonstrating magnitude, direction and symmetry at the affected site
- dimension of mitral valve and aorta
- changes in internal diameters of mitral valve orifice and aorta
- mitral regurgitation
- back flow of blood from LV to left atrium due to incomplete closure of mitral leaflets
- sector-wise changes in magnitude of the radial (Srad) and circumferential (Scir) strain
- changes in strain rates along with the marked variation in their changing patterns relative to pre-IR data
- synchronicity of LV sectors as divided according to the American Society of Echocardiography
- association of ventricular mechanical synchronicity with the myocardial stiffness and decreased myocardial strength as assessed by tissue Doppler and strain imaging
- changes in magnitude and direction of vectors shown in movies depicting compromised movement (slow and asymmetric) of the IR-affected site
- internal diameters of mitral valve orifice and aorta
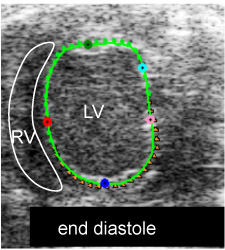
Fig. 1i. myocardial strain measurement: end-diastole full relaxation shown by shortest vectors (M1)
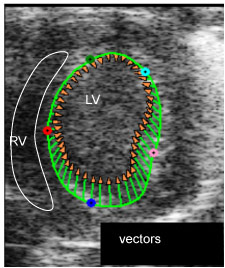
Fig. 1ii. myocardial strain measurement: LV is contracting shown by length and direction of vectors, the injury site (green point) has limited contraction (M2)
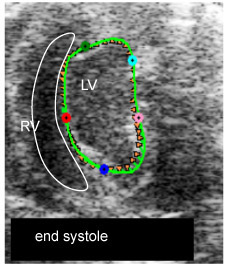
Fig. 1iii. myocardial strain measurement: end-systole, full contraction shown by shortest vectors (M3)
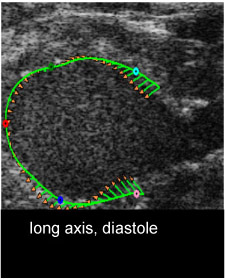
Fig. 1iv. myocardial strain measurement: long axis at diastole (M4)
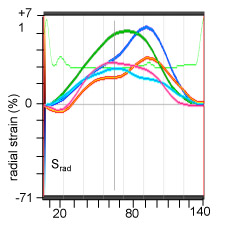
Fig. 1v. myocardial radial strain (Srad) measurement: the color coded curves represent the strain at respective colored points in images of Fig1.i-iv (M5)
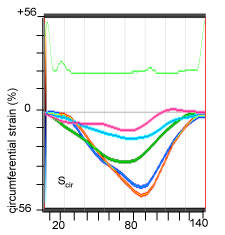
Fig. 1vi. myocardial circumferential strain (Scir) measurement: the color coded curves represent the strain at respective colored points in images of Fig1.i-iv (M6)
Figure 1. B-mode movies visualizing end-diastole (ED) and end-systole (ES) and changes in LV chamber size post-IR.
B-mode images to determine left ventricular (LV) circumferential strain (Scirc) and radial strain (Srad) by two-dimensional speckle tracking echocardiography.
VevoStrain speckle tracking algorithm to observe vectors depicting the magnitude and direction of the motion of myocardium, axial and parasternal long axis views demonstrating the vectors at the injury site of the impaired myocardium.
Radial and longitudinal strains on a baseline mouse and a mouse post IR day7. The color coded strain profiles showing different color coded points in sites on the myocardium of baseline (pre-IR) and treated (post-IR, day7) hearts. LV-left ventricle, RV-right ventricle, Srad-radial strain, Scir-circumferential strain.
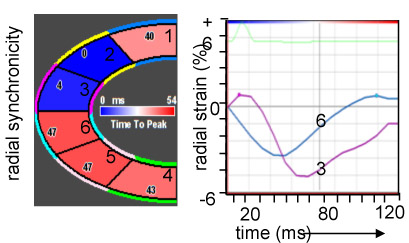
Figure 2. Myocardial sectoral synchronicity.
Analyses based on the strain data pre- and post-IR. LV divided into six sectors (1 = posterior basal, 4 = anterior basal, 2 = posterior mid, 5 = anterior mid, 3 = posterior apex, 6 = anterior apex) according to American Society of Echocardiography. Validation of ventricular mechanical synchrony to see its association with myocardial stiffness as assessed by tissue Doppler and strain imaging.
Color coded image panel showing the sectors from 1-6 with values for time to peak on the corresponding sectors in milliseconds. Radial and longitudinal synchronicities provided for pre-IR and post-IR in terms of graphs. The colors on the graphs correspond to colors of the corresponding sectors.
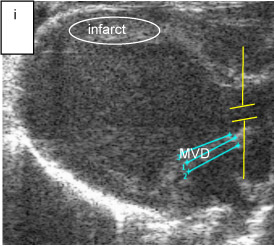
Fig. 3i. anatomical measurements: mitral regurgitation orifice diameter in mice heart (blue lines with repeated measurements), sample volume in aorta (yellow lines) (M8)
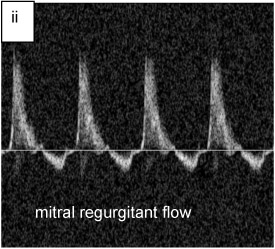
Fig. 3ii. regurgitant flow profiles in mouse heart, upper forward and lower backward flow at mitral valve (M9)
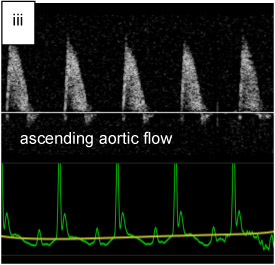
Fig. 3iii. aortic out flow velocity profiles in mouse heart (M10)
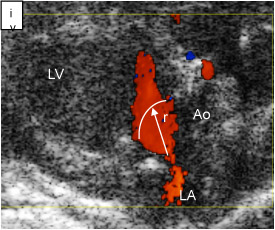
Fig. 3iv. regurgitant orifice at mitral Valve, Ao = aorta, LA = left atrium, LV = left ventricle, r = radius (M11)
Figure 3. Mitral valve V regurgitant fraction (RF).
Echocardiographic image panel for the measurement of regurgitant fraction (RF). Measurement of aortic diameter (AoD) and mitral valve orifice diameter (MVD) showing placement of the sample volume in the regurgitant jet and aorta. These measurements provide the regurgitant velocity profiles and ascending aortic flow in which velocity profiles above and below baseline indicate forward and backward blood flow to the LV and back to left atrium. RF (in %) computation using the formula, RF = MV CSA*VTI of MV jet at diastole – Ao CSA*VTI of Ao jet at systole)*100 / MV CSA*VTI of MV.
Quantification of regurgitant fraction showing the regurgitant fraction in post-IR mice indicator to regurgitated mitral valve. Changes in mitral valve effective regurgitant orifice (ERO) post-IR due to sphericity of LV. Representative color Doppler images depicting the blood flowing from left atrium to the LV. Enlarged blood flow orifice indicates turbulent flow and increased abnormal flow velocity. ERO indicating valvular incompetence. The flow velocity aliased. The pulsed wave is utilized as to benefit in determining transitions from laminar to turbulent flow. ERO computed using the formula, ERO = Flow/Vmax = 2 π r2 Va /Vmax, Va = Aliasing velocity, r = orifice radius, Vmax = maximum velocity.
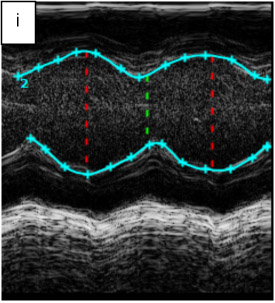
Fig. 4i. measurement of functional parameters in pre-IR mouse. Soft ware calculates parameters by tracing, red vertical line = diastole, green vertical line systole (M12)

Fig. 4ii. measurement of functional parameters in post-IR mouse. Soft ware calculates parameters by tracing, red vertical line = diastole, green vertical line systole (M13)
Figure 4. The rate of change of ventricular systolic pressure (dP/dt): pre- and post-IR.
Correlation of ejection fraction (EF) with dP/dt. Image panel showing an M-mode from which the basic functional measurements are taken.
The discrimination of heart contractility over time; bar graphs showing dP/dt post-IR. Indicating measurement of one parameter gives clinical information to the other.
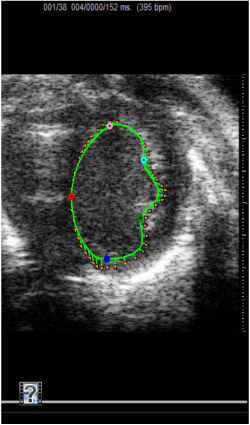
Figure 5. Short axis movie demonstrating pre-IR strain measurement.
Echocardiographic movie obtained from the parasternal view of heart to visualize the morphology in the mouse heart pre-IR.
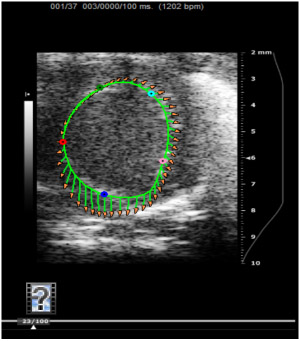
Figure 6. Short axis movie demonstrating post-IR LV strain measurement
Representative axial movie of a mouse LV traced to endocardium demonstrating the tissue strain vectors with five specific points in measurement considered.
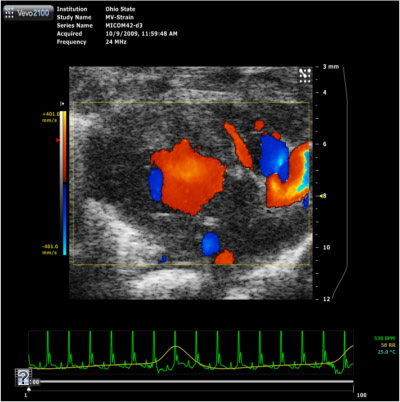
Figure 7. Parasternal long-axis color Doppler movie
Color Doppler flow movie demonstrating the blood pumped in from left atrium through mitral valve into the LV during diastole and the blood is pumped out through the aorta during systole phase of the heart with the direction of flow blue color away and red color towards (BART) the ultrasound probe.
Discussion
The strain data based on the measurement using speckle tracking algorithm is relatively less observer dependent as the most of the analysis is performed by the software. However the observer should be careful during tracing the boarders of epicardium and endocardium in the B-mode movies which depends more on the experience. Moreover, M-mode analysis and measurement of velocity profiles is also minimal observer dependent. However, in the measurement of pressure rise and measurement of times, observer requires very careful attention during measurements because the pressure depends directly with the square of the peak velocity as expressed by Bernoulli s formula in which even a small amount of error in the measurement can produce squared effect on the total error in the measurement of dP/dt. Furthermore, the regurgitant orifice is not necessarily constant throughout systole, and this can potentially affect the estimation of regurgitant severity. The higher doses of anesthesia may result in the dramatic reduction of the fractional shortening affecting other functional parameters. Therefore, standard use of sedation is important for better outcome. Most parameters can be measured using other modalities, for example, MRI tagging can measure 2D and 3D strains. However, echocardiography is more user friendly.
Acknowledgements
NHLBI R01 HL073087 to CKS.
Materials
| Material Name | Type | Company | Catalogue Number |
| Vevo2100 | VisualSonics, Inc., Canada | SN2100-0032 | |
| Ventilation device | Harvard Apparatus, MA | n/a | |
| PC Powerlab software | AD Instruments | n/a | |
| Isoflurane | VEDCO, Inc., MO | 5260-04-12 | |
| Aquasonic gel 100 | Parker Lab. Inc., NJ | 01-02 |
References
- Moiduddin, N., Asoh, K., Slorach, C., Benson, L. N., Friedberg, M. K. Effect of transcatheter pulmonary valve implantation on short-term right ventricular function as determined by two-dimensional speckle tracking strain and strain rate imaging. Am J Cardiol. 104, 862-867 (2009).
- Strudwick, R., Marwick, M., H, T. Comparison of two-dimensional speckle and tissue velocity based strain and validation with harmonic phase magnetic resonance imaging. Am J Cardiol. 97, 1661-1666 (2006).
- Popovic, Z. B., Benejam, C., Bian, J., Mal, N., Drinko, J., Lee, K., Forudi, F. Speckle-tracking echocardiography correctly identifies segmental left ventricular dysfunction induced by scarring in a rat model of myocardial infarction. Am J Physiol Heart Circ Physiol. 292, 2809-2816 (2007).
- Bansal, M., Cho, G. Y., Chan, J., Leano, R., Haluska, B. A., Marwick, T. H. Feasibility and accuracy of different techniques of two-dimensional speckle based strain and validation with harmonic phase magnetic resonance imaging. J Am Soc Echocardiogr. 21, 1318-1325 (2008).
- Li, Y., Garson, C. D., Xu, Y., Beyers, R. J., Epstein, F. H., French, B. A., Hossack, J. A. Quantification and MRI validation of regional contractile dysfunction in mice post myocardial infarction using high resolution ultrasound. Ultrasound Med Biol. 33, 894-904 (2007).
- Kim, M. S., Kim, Y. J., Kim, H. K., Han, J. Y., Chun, H. G., Kim, H. C., Sohn, D. W. Evaluation of left ventricular short- and long-axis function in severe mitral regurgitation using 2-dimensional strain echocardiography. Am Heart J. 157, 345-351 (2009).
- Shiota, T., Jones, M., Yamada, I., Heinrich, R. S., Ishii, M., Sinclair, B., Holcomb, S. Effective regurgitant orifice area by the color Doppler flow convergence method for evaluating the severity of chronic aortic regurgitation. An animal study. Circulation. 93, 594-602 (1996).
- Peng, Y., Popovic, Z. B., Sopko, N., Drinko, J., Zhang, Z., Thomas, J. D., Penn, M. S. Speckle tracking echocardiography in the assessment of mouse models of cardiac dysfunction. Am J Physiol Heart Circ Physiol. 297, 811-820 (2009).
- Leitman, M., Lysyansky, P., Sidenko, S., Shir, V., Peleg, E., Binenbaum, M., Kaluski, E. Two-dimensional strain-a novel software for real-time quantitative echocardiographic assessment of myocardial function. J Am Soc Echocardiogr. 17, 1021-1029 (2004).
- O’Gara, P., Sugeng, L., Lang, R., Sarano, M., Hung, J., Raman, S., Fischer, G. The role of imaging in chronic degenerative mitral regurgitation. JACC Cardiovasc Imaging. 1, 221-237 (2008).
- Marciniak, A., Sutherland, G. R., Marciniak, M., Claus, P., Bijnens, B., Jahangiri, M. Myocardial deformation abnormalities in patients with aortic regurgitation: a strain rate imaging study. Eur J Echocardiogr. 10, 112-119 (2009).
- Salvo, G. D. i., Pacileo, G., Verrengia, M., Rea, A., Limongelli, G., Caso, P., Russo, M. G. Early myocardial abnormalities in asymptomatic patients with severe isolated congenital aortic regurgitation: an ultrasound tissue characterization and strain rate study. J Am Soc Echocardiogr. 18, 122-127 (2005).
- Bijnens, B. H., Cikes, M., Claus, P., Sutherland, G. R. Velocity and deformation imaging for the assessment of myocardial dysfunction. Eur J Echocardiogr. 10, 216-226 (2009).
- Rosner, A., Bijnens, B., Hansen, M., How, O. J., Aarsaether, E., Muller, S., Sutherland, G. R. Left ventricular size determines tissue Doppler-derived longitudinal strain and strain rate. Eur J Echocardiogr. 10, 271-277 (2009).
- Marciniak, A., Claus, P., Sutherland, G. R., Marciniak, M., Karu, T., Baltabaeva, A., Merli, E. Changes in systolic left ventricular function in isolated mitral regurgitation. A strain rate imaging study. Eur Heart J. 28, 2627-2636 (2007).
- Neilan, T. G., Jassal, D. S., Perez-Sanz, T. M., Raher, M. J., Pradhan, A. D., Buys, E. S., Ichinose, F. Tissue Doppler imaging predicts left ventricular dysfunction and mortality in a murine model of cardiac injury. Eur Heart J. 27, 1868-1875 (2006).
- Sebag, I. A., Handschumacher, I. c. h. i. n. o. s. e., Morgan, F., Hataishi, J. G., Rodrigues, R., Guerrero, A. C., L, J. Quantitative assessment of regional myocardial function in mice by tissue Doppler imaging: comparison with hemodynamics and sonomicrometry. Circulation. 111, 2611-2616 (2005).
- Mai, W., Floc’h, J. L. e., Vray, D., Samarut, J., Barthez, P., Janier, M. Evaluation of cardiovascular flow characteristics in the 129Sv mouse fetus using color-Doppler-guided spectral Doppler ultrasound. Vet Radiol Ultrasound. 45, 568-573 (2004).
- Bose, A. K., Mathewson, J. W., Anderson, B. E., Andrews, M., Martin Gerdes, A., Benjamin Perryman, M., Grossfeld, D. P. Initial experience with high frequency ultrasound for the newborn C57BL mouse. Echocardiography. 24, 412-419 (2007).
- Phoon, C. K., Aristizabal, O., Turnbull, D. H. 40 MHz Doppler characterization of umbilical and dorsal aortic blood flow in the early mouse embryo. Ultrasound Med Biol. 26, 1275-1283 (2000).
- Claessens, P., Meulendijks, J., Claessens, C., Claessens, M., Claessens, J. Importance of strain imaging in cardiac rehabilitation. Asian Cardiovasc Thorac Ann. 17, 240-247 (2009).
- Goodman, J. M., Busato, G. M., Frey, E., Sasson, Z. Left ventricular contractile function is preserved during prolonged exercise in middle-aged men. J Appl Physiol. 106, 494-499 (2009).
- Salvo, G. D. i., Russo, M. G., Paladini, D., Felicetti, M., Castaldi, B., Tartaglione, A., Pietto, L. d. i. Two-dimensional strain to assess regional left and right ventricular longitudinal function in 100 normal foetuses. Eur J Echocardiogr. 9, 754-756 (2008).
- Baggish, A. L., Yared, K., Wang, F., Weiner, R. B., Hutter, A. M., Picard, M. H., Wood, M. J. The impact of endurance exercise training on left ventricular systolic mechanics. Am J Physiol Heart Circ Physiol. 295, H1109-H1116 (2008).
- Chow, P. C., Liang, X. C., Cheung, E. W., Lam, W. W., Cheung, Y. F. New two-dimensional global longitudinal strain and strain rate imaging for assessment of systemic right ventricular function. Heart. 94, 855-859 (2008).
- Weytjens, C., Franken, P. R., D’Hooge, J., Droogmans, S., Cosyns, B., Lahoutte, T., Van Camp, G. Doppler myocardial imaging in the diagnosis of early systolic left ventricular dysfunction in diabetic rats. Eur J Echocardiogr. 9, 326-333 (2008).
- Masutani, S., Iwamoto, Y., Ishido, H., Senzaki, H. Relationship of maximum rate of pressure rise between aorta and left ventricle in pediatric patients. Circ J. 73, 1698-1704 (2009).
- Luo, J., Fujikura, K., Konofagou, E. E. Detection of murine infarcts using myocardial elastography at both high temporal and spatial resolution. Conf Proc IEEE Eng Med Biol Soc. 1, 1552-1555 (2006).
- Luo, J., Fujikura, K., Homma, S., Konofagou, E. E. Myocardial elastography at both high temporal and spatial resolution for the detection of infarcts. Ultrasound Med Biol. 33, 1206-1223 (2007).
- Garson, C. D., Li, Y., Hossack, J. A. Free-hand ultrasound scanning approaches for volume quantification of the mouse heart Left ventricle. IEEE Trans Ultrason Ferroelectr Freq Control. 54, 966-977 (2007).
- Gnyawali, S. C., Roy, S., McCoy, M., Biswas, S., Sen, C. K. Remodeling of the ischemia-reperfused murine heart: 11.7T cardiac magnetic resonance imaging of contrast enhanced infarct patches and transmurality. Antioxid Redox Signal. , (2009).
- Ojha, N., Roy, S., Radtke, J., Simonetti, O., Gnyawali, S., Zweier, J. L., Kuppusamy, P. Characterization of the structural and functional changes in the myocardium following focal ischemia-reperfusion injury. Am J Physiol Heart Circ Physiol. 294, H2435-H2443 (2008).
- Roy, S., Khanna, S., Hussain, S. R., Biswas, S., Azad, A., Rink, C., Gnyawali, S. MicroRNA expression in response to murine myocardial infarction: miR-21 regulates fibroblast metalloprotease-2 via phosphatase and tensin homologue. Cardiovasc Res. 82, 21-29 (2009).
- Lang, R. M., Bierig, M., Devereux, R. B., Flachskampf, F. A., Foster, E., Pellikka, P. A., Picard, M. H. Recommendations for chamber quantification: a report from the American Society of Echocardiography’s Guidelines and Standards Committee and the Chamber Quantification Writing Group, developed in conjunction with the European Association of Echocardiography, a branch of the European Society of Cardiology. J Am Soc Echocardiogr. 18, 1440-1463 (2005).
- Du, X. J., Cole, T. J., Tenis, N., Gao, X. M., Kontgen, F., Kemp, B. E., Heierhorst, J. Impaired cardiac contractility response to hemodynamic stress in S100A1-deficient mice. Mol Cell Biol. 22, 2821-2829 (2002).
- Barwe, S. P., Jordan, M. C., Skay, A., Inge, L., Rajasekaran, S. A., Wolle, D., Johnson, C. L. Dysfunction of ouabain-induced cardiac contractility in mice with heart-specific ablation of Na,K-ATPase beta1-subunit. J Mol Cell Cardiol. 47, 552-560 (2009).
- Faber, L., Lamp, B. Mitral valve regurgitation and left ventricular systolic dysfunction: corrective surgery or cardiac resynchronization therapy. Herzschrittmacherther Elektrophysiol. 19, 52-59 (2008).

