Sometimes, in order to identify and study bacteria we first need to isolate and enrich them from a sample. For example, samples obtained from a Winogradsky Column are mixed, meaning they contain multiple species or strains of bacteria, so studying an individual bacterium or enumerating the different kinds present can be challenging. To this end, serial dilution and plating techniques are typically employed to reliably quantify bacterial load and isolate individual colonies.
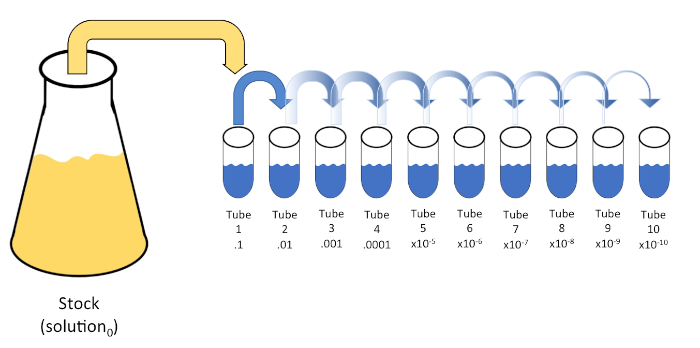
Serial dilution is a process through which the concentration of an organism, bacteria in this example, is systematically reduced through successive resuspension in fixed volumes of liquid diluent. Usually the volume of the diluent is a multiple of 10 to facilitate logarithmic reduction of the sample organism. For example, one gram of sediment is first removed from the Winogradsky zone of interest and added to 10 milliliters of an appropriate liquid medium. Then, one milliliter of this first dilution is added to another tube containing nine milliliters of medium. The process can be repeated until several different concentrations of bacteria have been prepared. Serial dilution is the key to enumeration of bacteria in this example, since mixed samples from a Winogradsky Column contain an unknown, often large, number of bacteria.
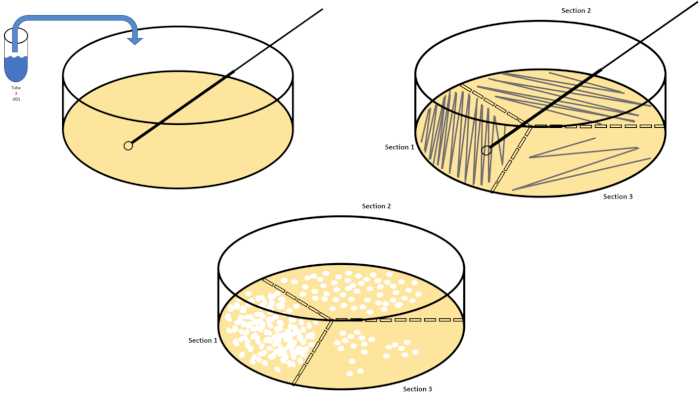
Next, streak plating and spread plating enable the isolation and enumeration of bacteria within a sample, respectively. Streaking is accomplished by introducing a diluted sample to one section of the solid medium supplemented with nutrient, which is divided into thirds. This inoculum is then spread over each third of the plate in a zig-zag pattern. As different sections of the plate are streaked, crossing from the previous sample only once, the sample is spread more thinly. This means that you may only need to streak from one dilution to achieve individual colonies in the later sections. After incubation, the streaked plates allow for observations of colony morphology, information that can help differentiate between different bacterial species.
Alternatively, if the main goal is the enumeration of the bacteria in the sample spread plating may be used. In spread plating, an aliquot of a single sample is spread evenly over the entire surface of solid medium. Typically, because we don’t know the bacterial numbers in the mixed sample, a spread plate is made for each of the dilutions or a representative sample of them. After incubation, enumeration can be performed using these spread plates. Any plates with colony counts fewer than 30 should be discarded, since small counts are subject to greater error. Similarly, any counts over 300 should be discarded because colony crowding and overlapping can lead to underestimation of colony count. If the colony counts of each of these remaining dishes is recorded and multiplied by the dilution factor, and then divided by the volume plated, this yields the colony forming units, or CFUs, per milliliter of suspension. In this video, you will learn how to qualitatively and quantitatively evaluate a sample containing a known bacterium, and the microbial communities contained in various regions of a Winogradsky Column via serial dilution, spread plating, and streak plating.
First, put on any appropriate personal protective equipment including a lab coat, gloves, and goggles. Next, sterilize the workspace with 70% ethanol and wipe down the surface. Next, gather two 500 milliliter Erlenmeyer flasks and label one broth and the other agar. To prepare LB agar solution, mix approximately 6.25 grams of LB agar, three grams of technical agar, and 250 milliliters of distilled water in the flask labeled agar.
Then, prepare LB broth by combining 2. 5 grams of LB media and 100 milliliters of distilled water in the flask labeled broth. After autoclaving the flasks, use a heat resistant glove to remove the flasks from the autoclave and place them in a 40 to 50 degree Celsius water bath. Once the flasks are 50 degrees Celsius, carefully prepare three 100 milliliter aliquots of the broth solution and label each aliquot solution zero. Next, gather 10 sterile petri dishes and label them with the date, name, type of media used, and the Winogradsky Column zone that the organisms will be harvested from. Pipette 15 milliliters of agar from the agar flask into each petri dish. Then, use the pipette tip to remove any bubbles, replace the plate lids, and allow them to solidify on the bench top overnight.
The next day, wipe down the bench top with 70% ethanol. Next, label 10 20 milliliter test tubes T1 through T10 and place them in a rack. Pipette nine milliliters of .45% saline into each tube. Now, cover each of the 10 test tubes loosely with their caps and transfer them to an autoclave-compatible test tube rack. After the cycle is complete, remove the saline blanks using heat resistant gloves and allow them to cool. Store the tubes at room temperature until they have reached approximately 22 degrees Celsius.
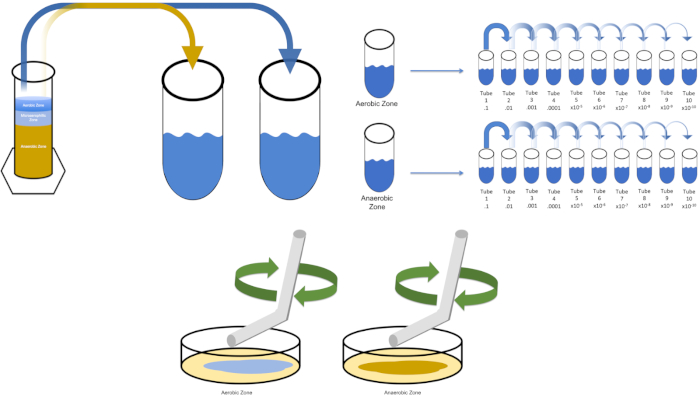
To cultivate a known target organism, E. coli in this example, inoculate 100 milliliters of solution zero with a single colony from a previously streaked plate. Then, cover the tube and incubate it over night at 37 degrees Celsius. To evaluate the regions of a Winogradsky Column, add approximately one gram of material from the aerobic zone to T1 and resuspend by vortexing. Then, repeat this process with one gram of material from the anaerobic zone.
Remove the tube containing solution zero inoculated with E. coli from the incubator and shake it. Then, pipette one milliliter of the solution into a T1 test tube and vortex to mix. Remove one milliliter of solution from T1 and transfer it to T2, vortexing to mix. Repeat this process through tube T10. To evaluate the aerobic and anaerobic zones of the Winogradsky Column, remove one milliliter of solution from each of the previously prepared T1 tubes and transfer it to the appropriate T2 tubes. Then, continue the serial dilutions through the T10 tubes as previously demonstrated.
To spread plate, pipette 100 microliters of the diluted sample from each T3 tube on to the corresponding petri dish. Then, use a sterile spreading rod to gently distribute the sample on to the petri dish and replace the plate lid. Repeat this process for the T6 and T9 dilutions, as previously demonstrated. Incubate the plates containing aerobic organisms in a 37 degree Celsius incubator for 24 hours. Incubate the plates containing anaerobic organisms in an anaerobic chamber set to 37 degrees Celsius for 24 hours. The next day remove the T3, T6, and T9 dilution plates from the incubator and the anaerobic chamber and transfer them to the bench top. Working with one plate at a time, glide a sterile inoculating loop across the top of the media in a zig-zag pattern. Then, replace the petri dish lid. Next, rotate the plate by 1/3 and sterilize the loop to reduce the frequency of the previously made zig-zag pattern. Again, after sterilizing the loop, rotate the plate by 1/3, reduce the frequency of the zig-zag pattern one last time, and replace the lid. Repeat this streaking method for the remaining plates, as previously shown. Then, place the streaked plates containing aerobic organisms in a 37 degree Celsius incubator overnight and the streaked plates containing anaerobic organisms in an anaerobic chamber set to 37 degrees Celsius overnight.
Cultures were harvested from the aerobic and anaerobic zones of a seven day Winogradsky Column. Then, the cultures were serially diluted prior to streaking and spreading on LB agar plates. Streaking revealed a mixed population from each of the evaluated Winogradsky zones, and the spread plates produced similar results. A plate streaked from a mixed population will result in bacterial colonies of different shapes, sizes, textures, and colors. In contrast, the streaked and spread plates containing the known organism, E. coli, demonstrated a homologous population. Generally, it is best to calculate CFUs per milliliter using the average colony count of three plates spread with the same sample and dilution factor. Multiply the average number of colonies by the dilution factor and divide by the amount aliquoted. Finally, isolated colonies chosen from each plate can be used in further enrichment assays to determine species identity.