Human Serum Anti-aquaporin-4 Immunoglobulin G Detection by Cell-based Assay
Summary
Cell-based assay is a widely used method to detect serum anti-aquaporin-4 immunoglobulin G. This method could be applied to clinical diagnosis and scientific researches of neuromyelitis optical spectrum disorders.
Abstract
Anti-aquaporin-4 (AQP4) immunoglobulin G (IgG) is the core diagnostic biomarker for neuromyelitis optica spectrum disorders (NMOSD). The cell-based assay (CBA) is a widely used method to detect anti-AQP4 IgG in human serum with high sensitivity and specificity. Briefly, serum anti-AQP4 IgG is captured by AQP4-transfected cell that is fixed on the biochip then detected by a fluorescein-labelled secondary antibody. Fluorescence microscopy is utilized to visualize the fluorescence, and the intensity of fluorescence is evaluated by at least two experienced clinicians. A final diagnosis of NMOSD can be made based on the combination of anti-AQP4 IgG detection results, clinical manifestations, and neuroradiological findings. According to previous studies, CBA is more sensitive and specific than other anti-AQP4 IgG detection methods, and it can be applied to both clinical diagnosis and studies of NMOSD. The method has limitations; for example, an international scale to evaluate serum anti-AQP4 IgG titers is still lacking. Here, a detailed protocol for human serum anti-AQP4 IgG detection using CBA is described.
Introduction
Serum AQP4 IgG is a core diagnostic biomarker for neuromyelitis optica spectrum disorders (NMOSD)1. The cell-based assay (CBA) is a widely used anti-AQP4 IgG detection method with high sensitivity and specificity. Here, a detailed protocol for CBA is introduced.
AQP4, a water channel protein, has six membrane-spanning units and two helical domains surrounding one aqueous pore2. Anti-AQP4 IgG is involved in the pathogenesis of NMOSD through binding to its target AQP4, which is mainly located on the endfeet of astrocytes3. It has been shown that anti-AQP4 IgG is positive in approximately two-thirds of NMOSD patients4. In the most recent international diagnostic criteria for NMOSD, anti-AQP4 IgG is considered to be a core diagnostic biomarker5. In this regard, it is crucial to establish a reliable protocol to detect human serum anti-AQP4 IgG and facilitate clinical diagnosis of NMOSD.
Currently, various anti-AQP4 IgG detection methods are available, such as CBA, tissue-based assay, enzyme-linked immunosorbent assay, and flow cytometry6,7. CBA employs EU90 cells, which are transfected with human AQP4, to capture anti-AQP4 IgG. The captured anti-AQP4 IgG is detected by fluorescent secondary antibodies and subsequently visualized by microscopy. Accumulating evidence has shown that CBA is more sensitive and specific than other anti-AQP4 IgG detection methods6,7. According to a meta-analysis, the sensitivity and specificity of CBA were shown to be 76% and 99%, which were higher than tissue-based and enzyme-linked immunosorbent assays6. Furthermore, a multicenter comparison of diagnostic assays of anti-AQP4 IgG was conducted7. A total of 193 study subjects from 15 European diagnostic centers were enrolled7. Four different methods were utilized to detect serum anti-AQP4 IgG7. It was demonstrated that CBA was more sensitive and specific than the other methods7. As AQP4 is expressed as two major isoforms (AQP4-M1 and AQP4-M23), anti-AQP4 IgG capture cell is transfected with either AQP4-M1 or AQP4-M23. However, which type of capture cell is better remains controversial. One investigation has supported AQP4-M1 based CBA8, while others have indicated that AQP4-M23 based CBA is better7,9,10. However, AQP4-M23-based CBA may yield false positive results due to unspecific IgG binding8. Jarius et al.11 reported that there was no significant difference in anti-AQP4 IgG detection rates between AQP4-M1 and AQP4-M23-based CBAs.
In summary, serum anti-AQP4 IgG is a core biomarker for NMOSD. CBA has higher specificity and sensitivity than other anti-AQP4 IgG detection methods. It remains controversial whether AQP4-M1- or AQP4-M23-based CBA is better. In this article, a detailed protocol for AQP4-M1-based CBA is described, which can apply to clinical diagnosis and studies of NMOSD.
Protocol
This procedure was approved by the Ethics Committee of the First Hospital of Jilin University and was performed on approximately 1,500 subjects.
1. Patient Enrollment and Blood Sample Collection
- Apply the laboratory detection of serum anti-AQP4 IgG to clinic patients with the chief complaints and symptoms listed below. Perform physical examinations as well.
Optic neuritis: Patients suffer with visual deficits, such as loss of visual fields and reduction of visual acuity.
Acute myelitis: Patients may present with paralysis, sensory deficits and autonomic dysfunction.
Area postrema syndrome: Patients may have symptoms of unexplained hiccups, nausea or vomiting.
Acute brainstem syndrome: Brainstem lesions could result in different symptoms and physical signs depending on the location of the lesions.
Symptomatic narcolepsy or acute diencephalic clinical syndrome with NMOSD-typical diencephalic MRI lesions.
Symptomatic cerebral syndrome with NMOSD-typical brain lesions.
NOTE: According to the international consensus diagnostic criteria for NMOSD5, a diagnosis of NMOSD can be made if the patient is serum anti-AQP4 IgG-positive and has at least one of the core clinical characteristics mentioned above. However, we do not recommend testing of anti-AQP4 IgG in patients with optic neuritis only. - Blood sample collection
NOTE: Patients do not need to be fasting.- Draw 2-3 mL of venous blood in a 4 mL vacuum blood collection tube.
- Allow the serum to clot for 30 min at room temperature (RT).
NOTE: Prolonged clotting can increase serum levels due to leakage from platelets. - Centrifuge at 2100 x g for 5 min. Carefully transfer the serum to a new tube.
- Analyze the serum immediately or aliquot and store at -20 or -80 °C.
NOTE: Storage at -20 °C is for storage of months, while -80 °C is for storage of years.
2. Anti-AQP4 Antibody Detection
CAUTION: Patient samples and used kit reagents should be considered infectious materials. Sodium azide-containing reagents in the kit are toxic. A flow chart of the protocol is provided in Figure 1.
- Preparation
- Bring the kit to RT before use.
NOTE: Store the kit at 2-8 °C. - Prepare at least 200 mL of PBS wash buffer containing 0.2% Tween 20. Pour 100 mL of wash buffer into a 500 mL beaker.
- Dilute the serum samples 10x with wash buffer. Prepare the positive and negative controls according to the instructions of the distributor.
- Bring the kit to RT before use.
- Sample incubation
- Add 30 µL of the pre-diluted samples, positive control, or negative control to the reaction fields of the reagent tray (Figure 2).
NOTE: Avoid air bubbles. - Remove the protective cover on the biochip slides.
NOTE: Do not touch the biochips to avoid the detachment and contamination of fixed cells. Hold the slide side-by-side before removing the cover. - Apply the biochip slide to the reagent tray (Figure 2). Start a 30 min incubation at RT.
NOTE: Every sample should be an individual droplet connected to the corresponding biochip without mixing with other droplets. - Gently rinse the biochip slide once with wash buffer. Immerse the biochip slide into the 500 mL beaker filled with 100 mL of wash buffer for at least 5 min. Place the beaker on a shaker if possible.
- Take out the biochip slide from the wash buffer. Carefully wipe away the residual wash buffer outside of the reaction fields with a paper towel. Expose the biochip slide in open air for 1-2 min to evaporate the residual wash buffer on the reaction field.
NOTE: Do not dry out the reaction fields. Do not touch the biochips with paper towel.
- Add 30 µL of the pre-diluted samples, positive control, or negative control to the reaction fields of the reagent tray (Figure 2).
- Secondary antibody incubation
- Prepare the secondary antibody solution according to the instructions of the distributor.
- Add 25 µL of fluorescent secondary antibody to the reaction fields of a clean reagent tray.
- Apply the biochip slide to the reagent tray loaded with secondary antibody. Incubate for 30 min at RT.
- Mounting
- Pour out the used wash buffer and add 100 mL of fresh wash buffer into the beaker. Repeat the washing as described in steps 2.2.4 and 2.2.5.
- Carefully add embedding medium to the reaction fields on a biochip slide (one drop per reaction field). Seal the biochip slide with one piece of cover glass. Avoid air bubbles.
- Fluorescence detection
- Turn on the fluorescent lamp of microscope and pre-heat for 15 min. Choose a 488 nm filter.
- Open photograph software. Take pictures from both transfected and untransfected areas of all reaction fields with different magnifications. First, take one picture with 4x magnification for an overview, then take more pictures with 10x and 20x magnifications.
NOTE: The detailed protocol is shown in Table 1. Interpretation of the results is discussed in the representative results section.
3. Diagnosis of Patients
- If the patient is serum anti-AQP4 IgG-positive and shows at least one core clinical characteristic of NMOSD (see discussion section), diagnose the patient with NMSOD5. However, if the patient is anti-AQP4 IgG-negative, a diagnosis of NMOSD may not be excluded.
Representative Results
Using the procedure described here, specific anti-AQP4 IgG in serum is detectable. During the procedure, pre-diluted samples, a positive control, and a negative control were added to the reaction fields, which contain transfected and untransfected areas (Figure 2). Fluorescence of the negative control in a transfected area mainly indicated the unspecific binding of secondary antibody to the transfected cells on biochips (Figure 3). Homogeneously weak fluorescence was visible (Figure 3). As for the positive control, anti-AQP4 antibody was added to the reaction field. Strong fluorescence was observed in the transfected area, which indicated the specific binding of anti-AQP4 IgG to AQP4-M1 in the transfected cells (Figure 4). Fluorescence of the positive control in an untransfected area showed hints of unspecific binding of anti-AQP4 IgG to fixed cells on biochips (Figure 4). For 10x diluted samples, anti-AQP4 IgG-negative serum showed a fluorescent pattern similar to the negative control, while the positive serum showed a pattern similar to the positive control (Figure 5). The intensity of fluorescence was associated with the anti-AQP4 IgG titer. Examples of different intensity of fluorescence are presented in Figure 5. Figure 5A and 5B were from anti-AQP4 IgG-negative samples, while Figure 5C-H were from anti-AQP4 IgG-positive samples. As long as heterogeneous and granular fluorescence appeared in transfected areas, the sample was considered anti-AQP4 IgG-positive, regardless of the strength of the fluorescence. The diagnostic criteria for NMOSD, which is based on the serum anti-AQP4 IgG, will be further described in the discussion section.
In a few samples, only a small number of cells was strongly stained in transfected areas, and it was hard to determine whether the serum was anti-AQP4 IgG-positive or negative (Figure 6). In this case, "probable positive" can be reported. In rarer cases, the fluorescence of a sample in transfected areas was homogeneously stronger than in untransfected areas (Figure 7). In this case, the sample should be regarded as anti-AQP4 IgG-negative. The high intensity of background fluorescence might be nonspecific. To create a reliable report, all photographs should be blindly evaluated by at least two clinicians. The clinicians should be trained before evaluation. In this protocol, they were shown representative photographs of different sample types and were informed as to how to evaluate results. Then, they evaluated photographs together with an experienced clinician. Finally, the trained clinicians worked independently. In an ideal situation, it should be always the same clinicians who evaluate results.
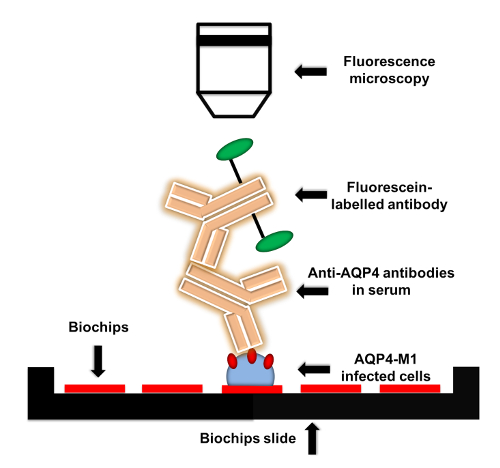
Figure 1: Flow chart of anti-AQP4 IgG detection protocol. AQP4-M1-transfected or untransfected EU 90 cells are fixed on the biochips. When adding serum to biochips, anti-AQP4 IgG in serum is captured by the fixed transfected cells. Then, fluorescein-labelled secondary antibody is applied to detect anti-AQP4 IgG. The fluorescence can be visualized by microscopy with various magnifications. Please click here to view a larger version of this figure.
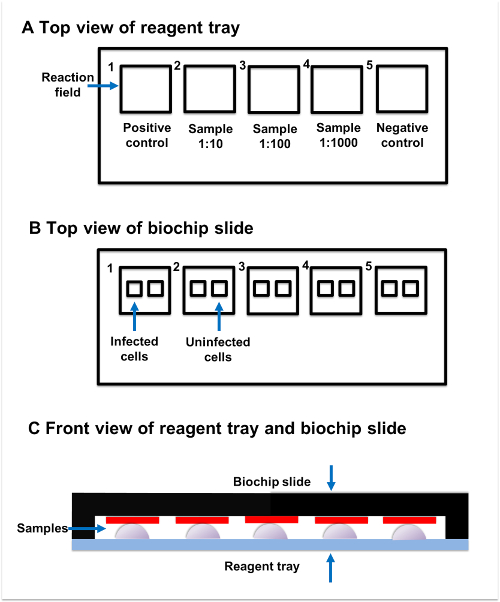
Figure 2: Sample incubation. (A) Top view of reagent tray. Every reagent tray contains five individual reaction fields. The positive control, samples, and negative control should be added to the separate reaction fields. (B) Top view of biochip slide. Every biochip slide contains five reaction fields, which have two subsections. The transfected subsection contains fixed AQP4-M1-transfected cells, while the untransfected subsection contains untransfected cells. (C) Front view of reagent tray and biochip slide. Reaction fields on the reagent tray and biochip slide are paired with each other. The sample added to the reaction field on reagent tray should be connected to the corresponding reaction field on the biochip slide. Please click here to view a larger version of this figure.
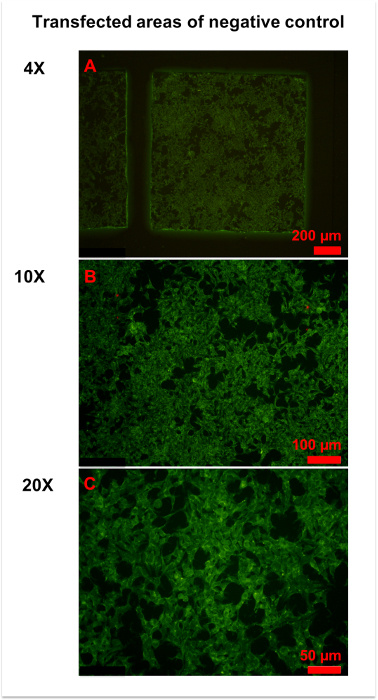
Figure 3: Representative figures for negative control. (A) An overview of the transfected area of the negative control was obtained by 4x magnification microscopy. Homogeneously weak fluorescence was observed throughout the area. (B,C) More details were observed in 10x (B) and x (C) magnification photographs. Generally, the cell membrane and plasma were slightly stained, and the cell nucleus was unstained. Please click here to view a larger version of this figure.
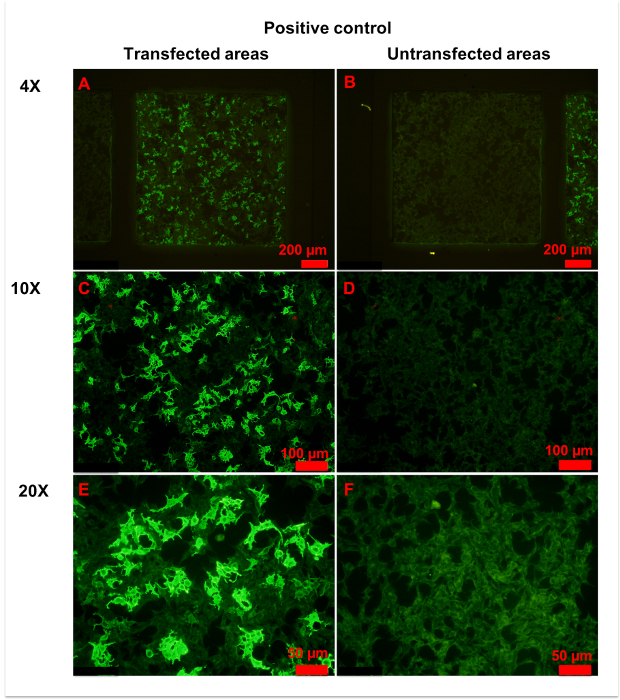
Figure 4: Representative figures for positive control. (A,B) Transfected (A) and untransfected (B) areas of positive control are shown. Homogeneously weak fluorescence was observed in untransfected areas, indicating unspecific binding of anti-AQP4 IgG to fixed cells. Conversely, heterogeneous strong fluorescence was observed in transfected areas, indicating specific binding of anti-AQP4 IgG to AQP4-M1 expressed on fixed cells. (C-F) More details of transfected (C,E) and untransfected (D,F) areas are observed in with 10x (C, D) or 20x (E,F) magnification. Weak and even fluorescence appeared in untransfected areas. However, a large percentage of cells in transfected areas showed intense fluorescence. In the plasma of strongly stained cells, anti-AQP4 IgG showed smooth and granular fluorescence. The cell nucleus was unstained or slightly stained. Please click here to view a larger version of this figure.
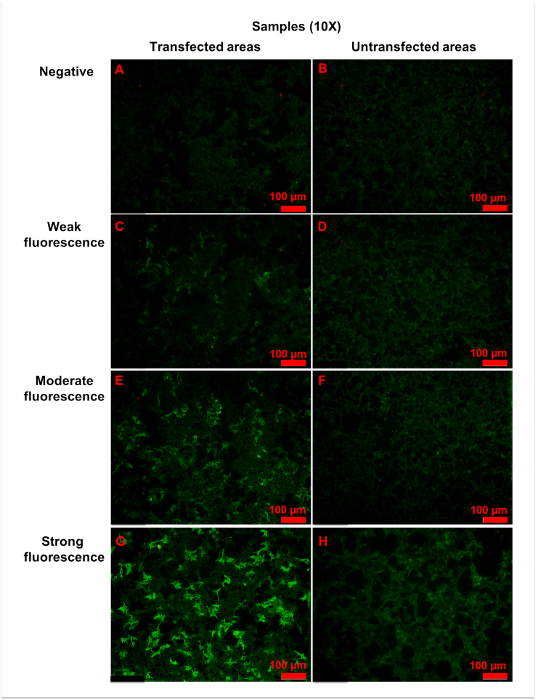
Figure 5: Representative figures for anti-AQP4 antibody negative or positive samples. Samples were 10x diluted, and all figures shown were taken with a 10x objective. (A,B) Negative fluorescence sample: the fluorescence was homogeneously weak in both (A) transfected and (B) untransfected areas. (C,D) Weak fluorescence sample: when compared with untransfected areas (D), a small amount of cells (approximately 25% to 50%) in transfected areas (C) showed more intense fluorescence. (E,F) Moderate fluorescence sample: in transfected areas (E), strong granular fluorescence was observed in a medium amount of cells (approximately 50% to 75%). (G,H) Strong fluorescence sample: cells in untransfected areas (H) were weakly stained. However, in transfected areas (G), granular fluorescence with high intensity appeared in a large number of cells (approximately over 75%). Generally, as the titer of anti-AQP4 IgG increased, both fluorescence intensity and percentage of strongly stained cells elevated correspondingly. The fluorescence of untransfected areas was always homogeneously weak. Please click here to view a larger version of this figure.
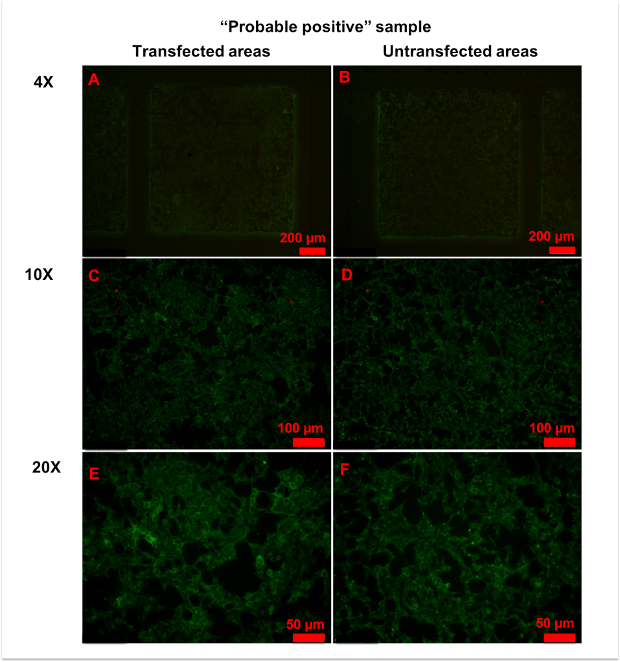
Figure 6: Representative figures for anti-AQP4 antibody "probable positive" samples. (A,B) No significant differences in fluorescence patterns were observed between transfected (A) and untransfected (B) areas at 4x magnification. (C-E) With 10x (C,D) or 20x (E,F) magnification, a few cells in transfected areas (C,E) showed strong granular fluorescence. Please click here to view a larger version of this figure.
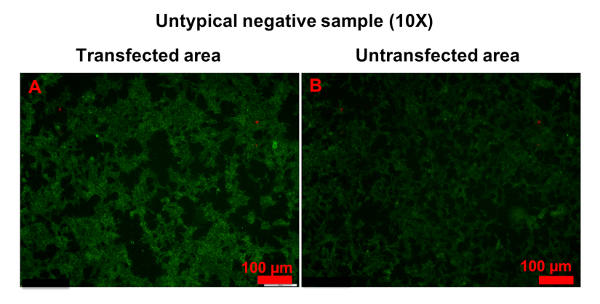
Figure 7: Example of untypical anti-AQP4 IgG-negative sample. Both transfected (A) and untransfected (B) areas were homogeneously stained. However, the fluorescence in transfected areas was stronger than in untransfected areas. Please click here to view a larger version of this figure.
| Magnification | Transfected area | Untransfected area |
| 4x | 1 picture | 1 picture |
| 10x | 4 pictures | 1 picture |
| 20x | 5 pictures | 1 picture |
Table 1: Fluorescence microscopy. It is recommended to use 4x, 10x, and 20x objectives for imaging of transfected and untransfected areas.
Discussion
We have described a widely accessible method to detect anti-AQP4 IgG in human serum. Anti-AQP4 IgG is closely related to NMOSD, and establishing a reliable anti-AQP4 IgG detection method is crucial for the clinical diagnosis of NMOSD. First, anti-AQP4 IgG is specific for NMOSD. Multiple sclerosis is also an immune-mediated disease of the central nervous system and shares many similarities with NMOSD12. However, anti-AQP4 IgG is only positive in NMOSD13. Second, anti-AQP4 IgG is common among NMOSD patients. Approximately two-thirds of NMOSD patients are serum anti-AQP4 IgG-positive4. Third, the most recent diagnosis criteria for NMOSD is based on serum anti-AQP4 IgG testing5. Taken together, serum anti-AQP4 IgG detection could facilitate the clinical diagnosis of NMOSD.
Among various anti-AQP4 IgG detection methods, CBA is widely used for clinical diagnosis due to its high sensitivity and specificity6,7. Although CBA is a quick and straightforward method, some key points should be addressed. First, experimenters should be careful when working with biochips, as AQP4-M1-transfected and untransfected cells are fixed on the biochips. During the whole procedure, biochips should not be touched by hand or dried out. Additionally, slides with biochips should be handled gently, otherwise the fixed cells on the biochips may fall down or become contaminated, which may result in fluorescence defective zones or a high fluorescent background. Second, when adding samples to the reaction fields on the reagent tray, researchers must ensure that the drops of samples are not mixed with each other. Air bubbles between the samples and biochips should be avoided.
This method has limitations; for example, when using CBA to detect anti-AQP4 IgG, it is hard to quantify fluorescence intensity and describe the anti-AQP4 IgG titer in the serum. Currently, in our diagnostic center, the intensity of fluorescence is subjectively reported by two clinicians after comparing photographs of samples vs. controls. In most cases, it is not hard to determine whether the serum is anti-AQP4 IgG-positive or negative. However, in rare cases, the fluorescence from samples may seem only slightly stronger than the negative control, and the sample is considered to be "probable positive". In this situation, clinicians should be more careful in making a diagnosis. Another possible solution is repeating the CBA. A more accurate method to quantify the intensity of fluorescence and an international definition of "anti-AQP4 IgG-positive" are warranted. Notably, the positive rate of anti-AQP4 IgG in cerebrospinal fluid is much lower than in serum, and testing for anti-AQP4 IgG in cerebrospinal fluid is not informative14,15.
CBA can be applied to both clinical diagnosis and scientific studies of NMOSD. Clinical diagnosis of NMOSD is made based on the combination of clinical manifestations, serum anti-AQP4 IgG, and neuroradiological findings. Serum anti-AQP4 IgG-positive patients with at least one core clinical characteristic of NMOSD can be diagnosed with NMOSD5; however, if the patient is anti-AQP4 IgG-negative, a diagnosis of NMOSD should not be excluded5, and clinicians should further evaluate the clinical manifestations and neuroradiological findings5,16,17. Serum myelin oligodendrocyte glycoprotein antibody may be detected to assist the diagnosis18,19,20. Notably, although the serum anti-AQP4 IgG titer may be changed with rituximab treatment21, it is not predictive of disease course and response to immunotherapy22,23. CBA is also widely used for scientific research. For example, Yang et al.24 described the clinical features of anti-AQP4 IgG-positive NMOSD patients. Additionally, Kitley et al.25 analyzed the prognostic factors for anti-AQP4 IgG-positive NMOSD patients25. Both studies used CBA to detect serum anti-AQP4 IgG.
In summary, CBA is a widely used method to detect anti-AQP4 IgG and can be applied to clinical diagnosis and scientific research of NMOSD.
Declarações
The authors have nothing to disclose.
Acknowledgements
The authors are grateful for the support from grants from the National Science Foundation of China (No. 31600820), The Health and Family Planning Commission of Jilin Province (No. 2016Q036), and The Science and Technology Planning Project of Jilin Province (No. 20180520110JH).
Materials
| Anti-aquaporin-4 IIFT | Euroimmun | FA 1128-2005-50 | Contains biochip slides coated with AQP4-M1 transfected and untransfected EU 90 cells, fluorescein-labelled anti-human IgG, anti-AQP4 antibody as positive control, antibody negative sample, salt for PBS pH 7.2, Tween 20 and embedding medium. |
| CellSens Dimension | OLYMPUS | N/A | photograph software |
| Gel & clot activator tube | Improve medical | 623040202 | From a local Chinese company |
Referências
- Zekeridou, A., Lennon, V. A. Aquaporin-4 autoimmunity. Neurology Neuroimmunology & Neuroinflammation. 2 (4), 110 (2015).
- Ho, J. D., et al. Crystal structure of human aquaporin 4 at 1.8 A and its mechanism of conductance. Proceedings of the National Academy of Sciences of the United States of America. 106 (18), 7437-7442 (2009).
- Takeshita, Y., et al. Effects of neuromyelitis optica-IgG at the blood-brain barrier in vitro. in vitro.Neurology Neuroimmunology & Neuroinflammation. 4 (1), 311 (2016).
- Sato, D. K., et al. Distinction between MOG antibody-positive and AQP4 antibody-positive NMO spectrum disorders. Neurology. 82 (6), 474-481 (2014).
- Wingerchuk, D. M., et al. International consensus diagnostic criteria for neuromyelitis optica spectrum disorders. Neurology. 85 (2), 177-189 (2015).
- Ruiz-Gaviria, R., et al. Specificity and sensitivity of aquaporin 4 antibody detection tests in patients with neuromyelitis optica: A meta-analysis. Multiple Sclerosis and Related Disorders. 4 (4), 345-349 (2015).
- Waters, P., et al. Multicentre comparison of a diagnostic assay: aquaporin-4 antibodies in neuromyelitis optica. Journal of Neurology, Neurosurgery, and Psychiatry. 87 (9), 1005-1015 (2016).
- Fryer, J. P., et al. AQP4 autoantibody assay performance in clinical laboratory service. Neurology Neuroimmunology & Neuroinflammation. 1 (1), 11 (2014).
- Long, Y., et al. Aquaporin-4 antibody in neuromyelitis optica: re-testing study in a large population from China. The International Journal of Neuroscience. 127 (9), 790-799 (2017).
- Pisani, F., et al. Aquaporin-4 autoantibodies in Neuromyelitis Optica: AQP4 isoform-dependent sensitivity and specificity. PloS One. 8 (11), 79185 (2013).
- Jarius, S., et al. Aquaporin-4 antibody testing: direct comparison of M1-AQP4-DNA-transfected cells with leaky scanning versus M23-AQP4-DNA-transfected cells as antigenic substrate. Journal of Neuroinflammation. 11, 129 (2014).
- Juryńczyk, M., Craner, M., Palace, J. Overlapping CNS inflammatory diseases: differentiating features of NMO and MS. Journal of Neurology, Neurosurgery, and Psychiatry. 86 (1), 20-25 (2015).
- Chen, H., et al. Clinical Features of Patients with Multiple Sclerosis and Neuromyelitis Optica Spectrum Disorders. Chinese Medical Journal. 129 (17), 2079-2084 (2016).
- Majed, M., Fryer, J. P., McKeon, A., Lennon, V. A., Pittock, S. J. Clinical utility of testing AQP4-IgG in CSF: Guidance for physicians. Neurology Neuroimmunology & Neuroinflammation. 3 (3), 231 (2016).
- Jarius, S., et al. Cerebrospinal fluid antibodies to aquaporin-4 in neuromyelitis optica and related disorders: frequency, origin, and diagnostic relevance. Journal of Neuroinflammation. 7, 52 (2010).
- Asgari, N., et al. Disruption of the leptomeningeal blood barrier in neuromyelitis optica spectrum disorder. Neurology Neuroimmunology & Neuroinflammation. 4 (4), 343 (2017).
- Kim, H. J., et al. MRI characteristics of neuromyelitis optica spectrum disorder: an international update. Neurology. 84 (11), 1165-1173 (2015).
- Jarius, S., et al. MOG encephalomyelitis: international recommendations on diagnosis and antibody testing. Journal of Neuroinflammation. 15 (1), 134 (2018).
- Narayan, R., et al. MOG antibody disease: A review of MOG antibody seropositive neuromyelitis optica spectrum disorder. Multiple Sclerosis and Related Disorders. 25, 66-72 (2018).
- Ogawa, R., et al. MOG antibody-positive, benign, unilateral, cerebral cortical encephalitis with epilepsy. Neurology Neuroimmunology & Neuroinflammation. 4 (2), 322 (2017).
- Valentino, P., Marnetto, F., Granieri, L., Capobianco, M., Bertolotto, A. Aquaporin-4 antibody titration in NMO patients treated with rituximab: A retrospective study. Neurology Neuroimmunology & Neuroinflammation. 4 (2), 317 (2016).
- Kessler, R. A., et al. Anti-aquaporin-4 titer is not predictive of disease course in neuromyelitis optica spectrum disorder: A multicenter cohort study. Multiple Sclerosis and Related Disorders. 17, 198-201 (2017).
- Mealy, M. A., et al. Aquaporin-4 serostatus does not predict response to immunotherapy in neuromyelitis optica spectrum disorders. Multiple Sclerosis. , (2017).
- Yang, Y., et al. The role of aquaporin-4 antibodies in Chinese patients with neuromyelitis optica. Journal of Clinical Neuroscience. 20 (1), 94-98 (2013).
- Kitley, J., et al. Prognostic factors and disease course in aquaporin-4 antibody-positive patients with neuromyelitis optica spectrum disorder from the United Kingdom and Japan. Brain. 135 (6), 1834-1849 (2012).

