High Frequency Ultrasound for the Analysis of Fetal and Placental Development In Vivo
概要
Here we describe the technique of high frequency ultrasound for in vivo analysis of fetuses in mice. This method allows the follow-up of fetuses and the analysis of placental parameters as well as maternal and fetal blood flow throughout pregnancy.
Abstract
Ultrasound imaging is a widespread method used to detect organ anomalies and tumors in human and animal tissues. The method is non-invasive, harmless, and painless, and the application is easy, fast, and can be done anywhere, even with mobile devices. During pregnancy, ultrasound imaging is standardly used to closely monitor fetal development. The technique is important to assess intrauterine growth restriction (IUGR), a pregnancy complication with short- and long-term health consequences for both the mother and fetus. Understanding the process of IUGR is indispensable for developing effective therapeutic strategies.
The ultrasound system used in this manuscript is an ultrasound device produced for the analysis of small animals and can be used in various research fields, including pregnancy research. Here we describe the usage of the system for in vivo analysis of fetuses from natural killer (NK) cell/mast cell (MC)-deficient mothers that give birth to growth-restricted pups. The protocol includes preparation of the system, handling of the mice before and during measurements, and the usage of the B-mode, color doppler mode, and pulse-wave doppler mode. Fetal size, placental size, and blood supply to the fetus were analyzed. We found reduced implantation sizes and smaller placentas in NK/MC-deficient mice from mid-gestation onwards. In addition, MC/NK-deficiency was associated with absent and reversed end diastolic flow in the fetal Arteria umbilicalis(UmA) and an elevated resistance index. The methods described in the protocol can easily be used for related and non-related research topics.
Introduction
Ultrasound is sound waves with frequencies above the audible range of the human ear, higher than about 20 kHz1. Animals like bats, wales, dolphins2,3, mice4, rats5, and mouse lemurs6 all use ultrasound for orientation or communication. Humans take advantage of ultrasound for several technical and medical applications. An ultrasound device is able to create the sound wave and distribute and represent the signal. If ultrasound encounters an obstacle, the sound is reflected, absorbed or can go through it. The application of ultrasound as an imaging method, called sonography, is used for the analysis of organic tissues in human or veterinary medicine like the heart (echocardiography)7,8, lung9, thyroid gland10, kidneys11, and urinary and reproductive tracts12,13; detecting gallstones14 and tumors15; and evaluating perfusion of blood vessels or organs16,17. Ultrasound is a standard method in prenatal care during pregnancy, and fetal developmental disabilities or impairments can be recognized early. Specifically, the growth of a fetus is closely monitored at regular intervals to recognize a possible IUGR. Finally, fetal blood flow can be monitored, as this can point out growth restrictions18,19,20,21.
A major advantage of ultrasound imaging compared to other methods like radiography is the sound's harmlessness of the tissues to be analyzed. This easy and fast method is non-invasive, painless, and can be used a number of times. The initial outlay of an ultrasound device is expensive; however, the consumable materials needed are cheap. The ultrasound system used in this manuscript is suitable for a range of animal models (i.e., mice and fish) While for humans an ultrasound device requires a frequency of 3-15 mHz, a frequency of 15-70 mHz is required for mice.
The present manuscript describes a protocol for the use of B-mode, color doppler mode, and pulse-wave doppler mode. The description includes preparation of the mice as well as performance, data acquisition, and storage. This method has been successfully applied to different mouse strains at all gestational days and can be used to investigate fetal and placental development as well as maternal and fetal blood parameters. Here, all applications are explained based on our studies employing pregnant MC/NK-deficient and control mice.
Protocol
All methods described here have been approved by the “Landesverwaltungsamt Sachsen Anhalt: 42502-2-1296UniMD.”
1. Experimental Procedure
- Mate 6 to 8-week-old female MC-deficient C57BL/6J-Cpa3Cre/+ (Cpa3Cre/+) mice and MC-sufficient C57BL/6J-Cpa3+/+ (colony controls; Cpa3+/+) with BALB/c males.
- Define the gestation day (gd) 0 after confirmation of the vaginal plug and treat the females immediately after plug confirmation.
NOTE: A plug is the sperm of the male in the vaginal orifice of the female.- Inject 250 µL of PBS intraperitoneally in control Cpa3+/+ females.
- Inject 250 µL of anti-CD122 (0.25 mg) intraperitoneally in MC-deficient Cpa3Cre/+ females.
Note: An injection of 0.25 mg of anti-CD122 depletes peripheral NKs and uNKs in MC-deficient Cpa3Cre/+ females as described previously22.
- Wait until gd5.
NOTE: At gd5, there is the earliest possibility for implantation analysis.- Proceed with steps 2-5 for the ultrasound analysis.
- Perform the ultrasound imaging at gd5, 8, 10, 12, and 14.
2. Preparation of the Ultrasound System
- Turn on the system (Figure 1A; main power on the back and computer standby at the left site), the heated platform (Figure 1B; at the control pad), and the gel warmer (Figure 1C).
NOTE: Ultrasound gel needs to warm up for approximately 0.5 h. - Ensure that the isoflurane unit is filling sufficiently (Figure 1D).
- Open a New Study or New Series in an existing study in the browser. Fill in all the required information (owner, study name, series name, animal data) in the Study Info window. Click Ok.
- After clicking Ok, ensure that the B-mode imaging window appears and the imaging in B-mode begins automatically.
3. Mouse Handling
- Anesthetization of the mouse
- Place the mouse in the knockdown box (Figure 1E), close the box, open the isoflurane tube to the knockdown box, and turn on the isoflurane (concentration 3.5%).
- When the mouse is anesthetized, lower (to concentration 1.5%) and redirect the isoflurane flow by opening the tube in the direction of the heating platform and close the flow to the knockdown box.
NOTE: To reach sufficient anesthesia, wait an additional 10 s after the mouse is no longer moving. - Transfer the mouse quickly from the knockout box to the heating platform (Figure 1F) in a dorsal position, and gently position its nose in the anesthesia nose tube located on the top of the platform.
- Fixation, depilation, and preparation of the mouse for measuring
- Place eye protection cream in each eye of the mouse to prevent dry eyes.
- Place one drop of electrode gel on each of the four copper areas on the heated platform (Figure 1F).
- Tap the paws with surgical tape on the electrode gel-coated areas of the heating platform.
- Check ECG [optimal value = 450-550 beats/min (BPM)] and respiratory physiology at all times.
NOTE: By using a rectal probe, body temperature measurement is possible, but not necessary. - Place depilatory cream at the abdomen of the mouse, rub the cream with a cotton swab and wait around 1 min. Remove the cream with a water-soaked compress. Repeat this step if not all hairs are gone.
- Apply the pre-warmed ultrasound gel on the depilated skin.
4. Measurements and Acquisition of Images and Videos
- Hold the transducer (Figure 1G) in the hand or clamp it in the holding device (Figure 1H; holding device is recommended).
- Identify the bladder with the transducer and use it as reference point. Move the transducer to the left and right sites of the abdomen to trace implantations.
- B-mode for visualization of anatomical structures in 2D grayscale image
- Move the transducer or heating platform table where the mouse is fixated until the first implantation is visible on the screen at its largest size.
- Select Image Label and enter a name, or Frame Store (storage without name) to store single frames, or Cine Store to store a cineloop for whole implantation measurements.
- Move the transducer or table to bring the placenta to a position where blood flow in the UmA is visible. Store a single frame or cineloop (see step 4.3.1.1) for placental measurements.
NOTE: Placental measurements are possible from gd10 onwards. - Continue with all implantations using the same method.
- Move the transducer or heating platform table where the mouse is fixated until the first implantation is visible on the screen at its largest size.
- Color doppler mode to visualize and determine the direction of blood flow
- Press the Color button.
- Move the Color Box (in this area, the signal is visible) to the required position by using the trackball. If necessary, change the size of the box by pressing Update and move the trackball (to the right side/upward = bigger; to the left side/downward = smaller). When the box has the right size, press Select.
- Store single frames or cineloops as described in step 4.3.1.1.
- Pulse-wave (PW) doppler mode to quantify blood flow through the vessels in the Arteria uterina (uterine artery, UA) and UmA
- Locate the region of interest in the color doppler acquisition.
NOTE: The UA is located caudal to the bladder, and the UmA is located between the fetus and placenta. - Press PW, and a dashed line will appear. Move this line to the blood vessel of interest and adjust the angle of the line using the “Doppler Angle” knob in line with the blood flow. Press Update.
NOTE: The angle between the direction of the blood flow and the transducer must be consistent in all animals, especially when using angles of greater than 60° (here, 70° for UAs and 45° for UmAs were used). - Store a cineloop of the appearing doppler lines in the PW doppler acquisition window.
- Locate the region of interest in the color doppler acquisition.
5. Reviewing and Finishing Data Acquisition and Saving a Series
- To review data, press Study Management. Scroll to the thumbnail image of interest and double-click Update.
- Press first Study Management then Close in the browser window to finish data acquisition and save a recorded series.
NOTE: After closing a series, it is not possible to store frames or cineloops in this series anymore.
6. Mouse Handling Following Acquisition of Data
- Remove the gel from the anaesthetized animal with the help of dry compresses.
- Remove the surgical tape carefully from the paws.
- Close the isoflurane tube (concentration 0%).
- Proceed with following ultrasound analysis at gd5, 8, 10, and 12.
- Place the animal alone in a cage for a minimum of 5 min so it has time to wake up and orientate.
- Place the mouse back in the original cage.
NOTE: Do not turn off the isoflurane before removing the gel and surgical tape, as mice wake up very quickly (around 20 s) after turning off the isoflurane.
- Proceed with the following ultrasound analysis at gd14.
- Sacrifice the female before it wakes up by cervical dislocation. Open the animal, remove the uterus, separate the fetuses and placentas, and measure fetal and placental weights.
7. Copying and Importing the Data
- Mark one or more series by clicking Export To and choose the storage space to copy data onto a hard disk.
- Open the software at a computer and click Copy From and select the study/series from the hard disk to import a study/series into the software.
- Analyze the data with the software.
Representative Results
Individual components of the ultrasound system used in this manuscript are shown in Figure 1. Figure 2 shows representative ultrasound images acquired in B-mode at gd5, 8, 10, and 12 (B) and corresponding implantation area measurement results (A), demonstrating a significant reduced implantation area of anti-CD122-treated Cpa3Cre/+ mice from gd10 onwards.
Figure 3 shows single parts of an implantation (decidua basalis, placenta, embryo) acquired in B-mode (Figure 3A) and conduced placental measurement (area, thickness, diameter) (Figure 3B). Placental measurements resulted in a significantly reduced placental area (Figure 3A), thickness (Figure 3B), and diameter (Figure 3C) in anti-CD122-treated Cpa3Cre/+ mice compared to WTs at gd10 and gd12. In contrast, placental area and diameter were comparable between the groups at gd14, and thickness was significantly increased in anti-CD122-treated Cpa3Cre/+ mice in comparison to WTs at gd14.
Figure 4 shows fetal and placental weight at gd14. Results revealed a significantly decreasedfetal weight (Figure 4A), comparable placental weight (Figure 4B), and significantly decreased feto-placental index (FPI) (Figure 4C) in anti-CD122-treated Cpa3Cre/+ mice compared to WTs. Figure 5 shows a representative PW doppler image of the UA of a WT mouse (Figure 5A) and measurements of peak systolic velocity (PSV) (Figure 5B), end diastolic velocity (EDV) (Figure 5C), and the calculated resistance index (Figure 5D), whereby all values were comparable between the groups. Figure 6 shows a representative color doppler image of a WT fetal UmA at gd14 (Figure 6A) and representative PW doppler images with normal, absent, or reversed end diastolic flow (Figure 6B) and measurements of PVS (Figure 6C), EDV (Figure 6D), systolic/diastolic ratio (Figure 6E), and resistance index (Figure 6F). The resistance index of anti-CD122-treated Cpa3Cre/+ mice was significantly increased compared to WT mice.
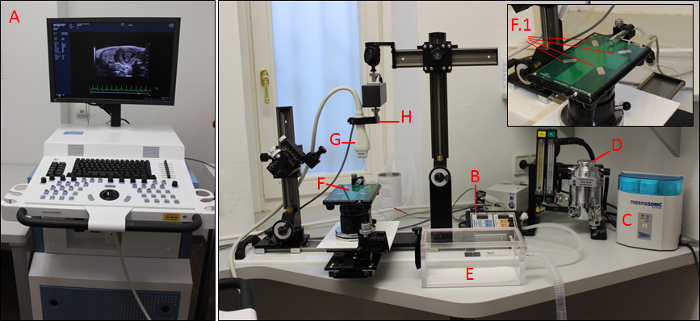
Figure 1: The imaging system. Main control unit (A) with heating platform control pad (B), gel warmer (C), isoflurane control unit (D), knockdown box (E), heated platform with four copper areas (F; F.1), transducer (G), and transducer holding device (H). Please click here to view a larger version of this figure.
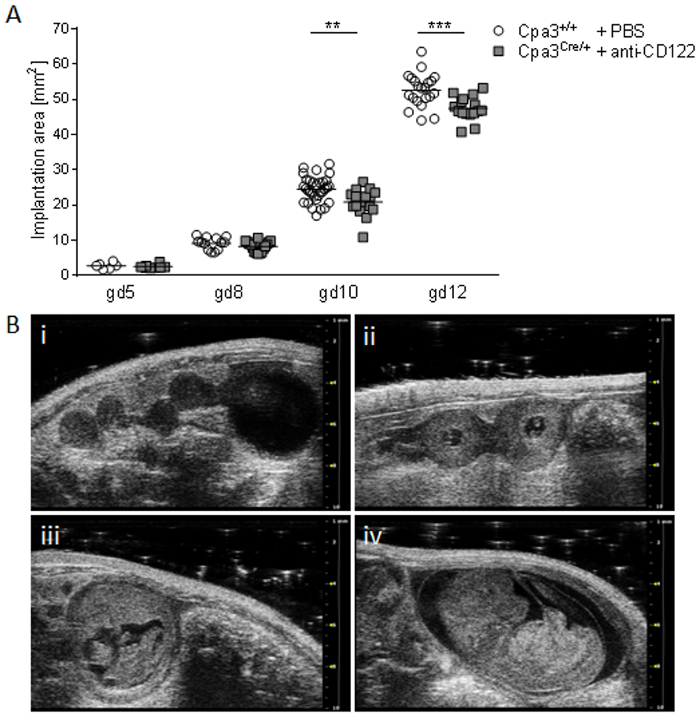
Figure 2: Comparison of implantation areas at gd5, 8, 10, and 12. (A) Implantation areas from WT Cpa3+/+ + PBS mice (mice n = 2-5, implantations n = 6-31 per day) and MC/NK-deficient Cpa3Cre/+ + anti-CD122 mice (mice n = 3, implantations n = 8-16 per day) at gd5, 8, 10, and 12. Results are presented as individual values for each single implantation and mean. Statistical differences were obtained using an unpaired t-test (**p < 0.01, ***p < 0.001). (B) Representative ultrasound images from Cpa3+/+ + PBS mice at gd5 (i), gd8 (ii), gd10 (iii), and gd12 (iv). gd, gestation day; WT, wild type; MC, mast cell; NK, natural killer cell. This figure is republished from a previous publication23. Please click here to view a larger version of this figure.
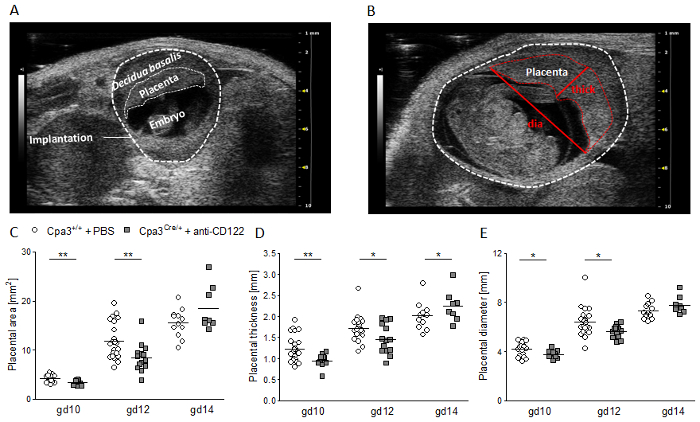
Figure 3: Placental measurements at gd10, 12, and 14. (A) Representative ultrasound image of a WT implantation at gd10 showing the decidua basalis, placenta, and embryo. (B) Representative ultrasound image of a WT implantation at gd12 showing placental thickness (thick) and placental diameter (dia). Placental area (C), placental thickness (D), and placental diameter (e) from WT Cpa3+/+ + PBS mice (mice n = 3-5, placentas n = 12-22 per day) and MC/ NK-deficient Cpa3Cre/+ + anti-CD122 mice (mice n = 3-4, placentas n = 8-14 per day) at gd10, 12, and 14. Results are presented as individual values for each single placenta and mean. Statistical differences were obtained using an unpaired t-test (*p < 0.05, **p < 0.01). gd, gestation day; WT, wild type; thick, thickness; dia, diameter; MC, mast cell; NK, natural killer cell. This figure is republished from a previous publication23. Please click here to view a larger version of this figure.

Figure 4: Fetal and placental weight measurements and feto-placental index (FPI) at gd14. Fetal weights (A), placental weights (B), and FPIs (C) from progeny of WT Cpa3+/+ + PBS mice (mice n = 4, fetus/placentas n = 35) and MC/NK-deficient Cpa3Cre/+ + anti-CD122 mice (mice n = 3, fetus/placentas n = 28) at gd14. Results are presented as individual values and mean. Statistical differences were obtained using unpaired t-test (*p < 0.05, **p < 0.01). gd, gestation day; WT, wild type; MC, mast cell; NK, natural killer cell. This figure is republished from a previous publication23. Please click here to view a larger version of this figure.
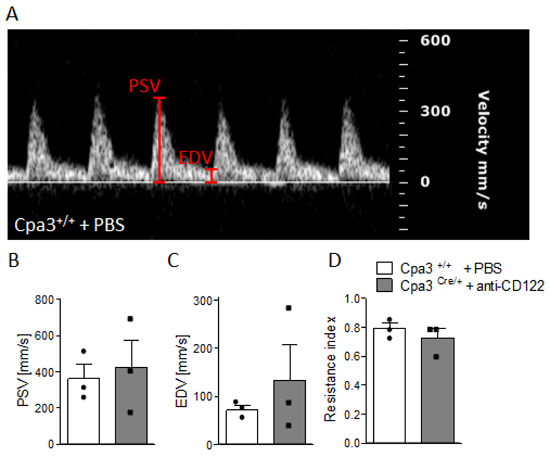
Figure 5: Analysis of uterine artery velocities at gd10. (A) Representative pulse-wave doppler images from WT Cpa3+/+ + PBS mice showing PSV and EDV. PSV (B), EDV (C), and resistance index (D) of uterine arteries from Cpa3+/+ + PBS (n = 3) and Cpa3Cre/+ + anti-CD122 (n = 3) mice at gd10 of pregnancy. Data are presented as mean with SEM. Statistical analysis was performed using the Mann-Whitney U test. gd, gestation day; WT, wild type; MC, mast cell; NK, natural killer cell; PSV, peak systolic velocity; EDV, end diastolic velocity. This figure is republished from a previous publication23. Please click here to view a larger version of this figure.
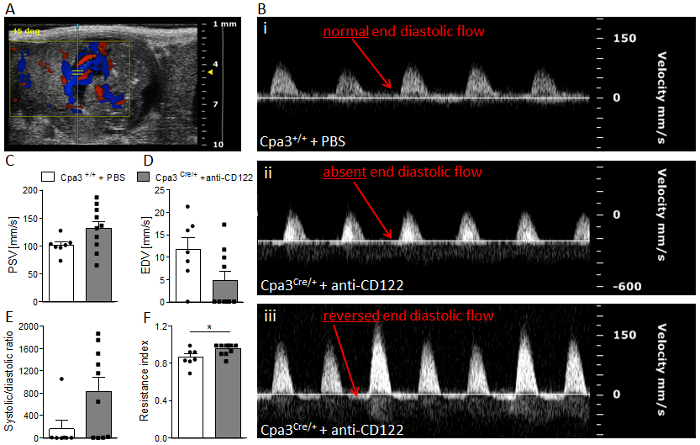
Figure 6: Analysis of umbilical artery velocities at gd14. (A) Representative Color Doppler image of a fetal UmA at gd 14. (B) Representative pulse-wave doppler images from Cpa3+/+ + PBS (i) and Cpa3Cre/+ + anti-CD122 (ii, iii) mice, showing normal end diastolic flow (i), absent end diastolic flow (ii), or reversed end diastolic flow (iii). PSV (C), EDV (D), systolic/diastolic ratio (E), and resistance index (F) of UmAs of fetuses from Cpa3+/+ + PBS (mice n = 3, UmA measurements n = 7) and Cpa3Cre/+ + anti-CD122 (mice n = 3, UmA measurements n = 10) mice at gd14. Data are presented as mean with SEM. Statistical analysis was performed using an unpaired t-test (*p < 0.05). UmA, umbilical artery; gd, gestation day; PSV, peak systolic velocity; EDV, end diastolic velocity. This figure is republished from a previous publication23. Please click here to view a larger version of this figure.
Discussion
Using our ultrasound system, we demonstrated fetal growth restriction in MC/NK-deficient mothers from gd10 on. Furthermore, at gd10 and 12, we observed reduced placental dimensions, and at gd14 the absence or reversion of end diastolic flow in the UmAs of some fetuses of uMC/uNK-deficient mice. This sign of poor vascularization was associated with a significant resistance index of the arteries indicating IUGR. Results confirm the important role of uMCs and uNKs in pregnancy and fetal well-being and in understanding the course of IUGR.
The protocol is applicable at every gestation day from gd5 onwards (after implantation). There are some critical steps in the protocol that must be taken into consideration. Firstly, hair removal must be done carefully. For example, excessive contact with the depilation cream may cause skin irritation. However, incomplete hair removal leads to signal interference visible as a shadow on the screen. Another reason for an insufficient signal (shadows or grainy pictures) can also be a too-low amount of gel placed between the mouse and ultrasound beam. In our experience, rather a high amount of gel (approximately 10 mL) is necessary for sufficient signal visibility. Second, 2D measurements can be somehow prone to inaccuracy. To minimize measurement differences between implantations, we advise the use of the largest available size when encircling the implantation. For precise placenta measurements, all implantations were positioned in a way in which UmA blood flow could be seen. Additionally, in order to minimize sources of mistakes, measurements should be always performed by the same operator. Third, for pulse-wave doppler measurements, it is important to watch the angle between the direction of blood flow and the ultrasound beam. A too-high angle or different angles between the animals in a single experiment may lead to inaccurate velocity measurements. Attention should also be paid to the risk of repetitive anesthetization of the females. To reduce this risk and stress for the mother, ultrasound measurements should be done no more than every second day.
The possibility to follow-up fetuses at relevant gestational days throughout pregnancy is a great advantage of the ultrasound technology. Contrary to sacrificing mice at different pregnancy stages, the technology enables us to perform accurate longitudinal analyses of individual pregnant mice. Despite this strength, there are some limitations of the system that should be considered. For example, fetuses may change positions during the course of pregnancy. Hence, it may be difficult to allocate certain data sets obtained at different times to individual fetuses. Additionally, sometimes it is not possible to monitor some fetuses at later gestation days, as i) their position can be difficult to reach with the beam, ii) fetuses may be too large to fit the screen, or iii) they may be hidden underneath the intestine. Depending on the mouse strain, whole implantation measurements are possible until gd12 or gd14. Later on, only single organs of the fetuses, including the heart, can be measured and recorded. The whole implantation itself is too large at later pregnancy stages to fit in the screen.
To the best of our knowledge, ultrasound imaging is (together with magnetic resonance imaging and computer tomography) the only available method to analyze the indicated parameters during pregnancy without sacrificing several animals at different gestational days. This is especially true for doppler imaging, which is the only method able to accurately evaluate blood flow and direction (red = flow in the direction of the ultrasound beam; blue = flow in the opposite direction of the ultrasound beam). During pulse-wave doppler imaging, the ultrasound beam sends out several pulses that are returned by the tissue and provide velocity information about blood flow24.
As ultrasound itself seems to be harmless for the mother and fetus, ultrasound imaging is perfectly suited for pregnancy research. Nevertheless, the methods described in this manuscript can be applied to numerous other research areas, as well; for example, the system also allows for 3D measurements, visualization and quantification of tissue movement over time, visualization of blood flow in tumors, detection of biomarkers on the cell surface, blood pressure measurements, and ultrasound-guided injections.
開示
The authors have nothing to disclose.
Acknowledgements
Many thanks to the Imaging Instrument company (especially to Magdalena Steiner, Katrin Suppelt, and Sandra Meyer) for their pleasant and fast support and for answering all our questions concerning the Imaging System and its usage promptly and completely. We are grateful to Prof. Hans-Reimer Rodewald and Dr. Thorsten Feyerabend (DKFZ Heidelberg, Germany) for providing the Cpa3 colony. Additionally, we thank Stefanie Langwisch, who was in charge of the mouse colonies and who generated the pictures in Figure 1.
The work and the Imaging System were funded by grants from the Deutsche Forschungsgemeinschaft (DFG) to A.C.Z. (ZE526/6-1 and AZ526/6-2) that were projects embedded in the DFG priority program 1394 "Mast cells in health and disease."
Materials
| LEAF anti-Maus CD122 (IL-2Rb) | BioLegend | 123204 | Klon TM-β1; 500 µg |
| Vevo 2100 System | FujiFilm VisualSonics Inc. | Transducer MS550D-0421 | |
| Vevo LAB Software | FujiFilm VisualSonics Inc. | ||
| Isoflurane | Baxter | PZN: 6497131 | |
| Electrode gel | Parker | 12_8 | |
| Surgical tape | 3M Transpore | 1527-1 | |
| Eye cream | Bayer | PZN: 1578675 | |
| Cotton tipped applicators | Raucotupf | 11969 | 100 pieces |
| Depilatory cream | Reckitt Benckiser | 2077626 | |
| Compresses | Nobamed Paul Danz AG | 856110 | 10 x 10 cm |
| Ultrasound gel | Gello GmbH | 246000 |
参考文献
- Abramowicz, J. S., Kremkau, F. W., Merz, E. Ultraschall in der Geburtshilfe: Kann der Fötus die Ultraschallwelle hören und die Hitze spüren?. Ultraschall in der Medizin. 33 (3), 215-217 (1980).
- Jones, G. Echolocation. Current Biology. 15 (13), R484-R488 (2005).
- Simmons, J. A. The sonar receiver of the bat. Annals of the New York Academy of Sciences. 188, 161-174 (1971).
- Zala, S. M., Reitschmidt, D., Noll, A., Balazs, P., Penn, D. J. Sex-dependent modulation of ultrasonic vocalizations in house mice (Mus musculus musculus). Public Library of Science ONE. 12 (12), e0188647 (2017).
- Wöhr, M., Seffer, D., Schwarting, R. K. W. Studying Socio-Affective Communication in Rats through Playback of Ultrasonic Vocalizations. Current Protocols in Neuroscience. 75, 1-8 (2016).
- Hasiniaina, A. F., et al. High frequency/ultrasonic communication in a critically endangered nocturnal primate, Claire’s mouse lemur (Microcebus mamiratra). American Journal of Primatology. , e22866 (2018).
- Yeo, L., Romero, R. Color and power Doppler combined with Fetal Intelligent Navigation Echocardiography (FINE) to evaluate the fetal heart. Ultrasound in Obstetrics & Gynecology. 50 (4), 476-491 (2017).
- Teichholz, L. E. Echocardiography in valvular heart disease. Progress in Cardiovascular Diseases. 17 (4), 283-302 (1975).
- Zechner, P. M., et al. Lungensonographie in der Akut- und Intensivmedizin. Der Anaesthesist. 61 (7), 608-617 (2012).
- Blank, W., Schuler, A. Sonografie der Schilddrüse – Update 2017. Praxis. 106 (12), 631-640 (2017).
- Hansen, K. L., Nielsen, M. B., Ewertsen, C. Ultrasonography of the Kidney: A Pictorial Review. Diagnostics. 6 (1), (2015).
- Older, R. A., Watson, L. R. Ultrasound anatomy of the normal male reproductive tract. Journal of Clinical Ultrasound. 24 (8), 389-404 (1996).
- Reeves, J. J., Rantanen, N. W., Hauser, M. Transrectal real-time ultrasound scanning of the cow reproductive tract. Theriogenology. 21 (3), 485-494 (1984).
- Sharma, M., Somani, P., Sunkara, T. Imaging of gall bladder by endoscopic ultrasound. World Journal of Gastrointestinal Endoscopy. 10 (1), 10-15 (2018).
- Weskott, H. -. P. Ultraschall in der Diagnostik maligner Lymphome. Der Radiologe. 52 (4), 347-359 (2012).
- Shirinifard, A., Thiagarajan, S., Johnson, M. D., Calabrese, C., Sablauer, A. Measuring Absolute Blood Perfusion in Mice Using Dynamic Contrast-Enhanced Ultrasound. Ultrasound in Medicine & Biology. 43 (8), 1628-1638 (2017).
- Quaia, E. Assessment of tissue perfusion by contrast-enhanced ultrasound. European Radiology. 21 (3), 604-615 (2011).
- Saw, S. N., Poh, Y. W., Chia, D., Biswas, A., Zaini Mattar, C. N., Yap, C. H. Characterization of the hemodynamic wall shear stresses in human umbilical vessels from normal and intrauterine growth restricted pregnancies. Biomechanics and Modeling in Mechanobiology. , (2018).
- Kessler, J., Rasmussen, S., Godfrey, K., Hanson, M., Kiserud, T. Fetal growth restriction is associated with prioritization of umbilical blood flow to the left hepatic lobe at the expense of the right lobe. Pediatric Research. 66 (1), 113-117 (2009).
- Laurin, J., Lingman, G., Marsál, K., Persson, P. H. Fetal blood flow in pregnancies complicated by intrauterine growth retardation. Obstetrics and Gynecology. 69 (6), 895-902 (1987).
- Arduini, D., Rizzo, G., Romanini, C., Mancuso, S. Fetal blood flow velocity waveforms as predictors of growth retardation. Obstetrics and Gynecology. 70 (1), 7-10 (1987).
- Meyer, N., et al. Chymase-producing cells of the innate immune system are required for decidual vascular remodeling and fetal growth. Scientific Reports. 7, 45106 (2017).
- Meyer, N., Schüler, T., Zenclussen, A. C. Simultaneous Ablation of Uterine Natural Killer Cells and Uterine Mast Cells in Mice Leads to Poor Vascularization and Abnormal Doppler Measurements That Compromise Fetal Well-being. Frontiers in Immunology. 8, 1913 (2017).
- Evans, D. H., Jensen, J. A., Nielsen, M. B. Ultrasonic color Doppler imaging. Interface Focus. 1 (4), 490-502 (2011).

