Non-equilibrium Microwave Plasma for Efficient High Temperature Chemistry
概要
This article describes a flowing microwave reactor that is used to drive efficient non-equilibrium chemistry for the application of conversion/activation of stable molecules such as CO2, N2 and CH4. The goal of the procedure described here is to measure the in situ gas temperature and gas conversion.
Abstract
A flowing microwave plasma based methodology for converting electric energy into internal and/or translational modes of stable molecules with the purpose of efficiently driving non-equilibrium chemistry is discussed. The advantage of a flowing plasma reactor is that continuous chemical processes can be driven with the flexibility of startup times in the seconds timescale. The plasma approach is generically suitable for conversion/activation of stable molecules such as CO2, N2 and CH4. Here the reduction of CO2 to CO is used as a model system: the complementary diagnostics illustrate how a baseline thermodynamic equilibrium conversion can be exceeded by the intrinsic non-equilibrium from high vibrational excitation. Laser (Rayleigh) scattering is used to measure the reactor temperature and Fourier Transform Infrared Spectroscopy (FTIR) to characterize in situ internal (vibrational) excitation as well as the effluent composition to monitor conversion and selectivity.
Introduction
This paper describes a protocol for a flowing microwave plasma of up to 1 kW, while measuring the plasma gas temperature and CO2 conversion.
Concerns for climate change and the consequent awareness for sustainability have driven a steady growth of the global share of renewable energy. However, the intermittent nature of solar and wind energy places stress on the energy system and inhibits further increasing deployments. Storage (long and short term) and conversion (e.g., into chemical fuels) are required to mitigate intermittency and to make sustainable energy available to other sectors such as transportation. The CO that is produced in the reactor can be used as feedstock gas for the synthesis of e.g., methane or liquid fuels. By using these to fuel power plants, electricity can be generated even when the instantaneous production of renewable energy is low. The CO2 that is produced in these plants forms a closed loop so that no net CO2 is introduced in the atmosphere, making it a clean cycle.
The system can only mitigate the intermittency if the switching time is smaller than the fluctuations in the energy supply. In the present configuration, the startup time is determined by the need to start under ideal breakdown conditions and then tune to optimal conversion conditions. In principle, this can be overcome by ignition with other means like a focused laser or spark. Plasma physics limitations are on the order of 0.1 ms. This is much shorter than the timescale of typical atmospheric effects, like e.g., clouds moving over a solar panel array. Extrapolating from the current system to a real application in a sustainable fuel production setting is still a rather long shot. Ideally, there would be a series of microwave reactors of 100-500 kW, each connected to a solar panel field or wind turbine, with switching of the individual reactors according to the energy supply.
This paper discusses a plasma approach, generically suitable for the application of conversion/activation of stable molecules such as CO2, N2 and CH4. Here, it is introduced through the specific example of reduction of CO2 to CO as a first step in chemical fuel synthesis. The flowing microwave plasma reactor is suitable for solving intermittency problems as it has low startup times and can be built using inexpensive materials.
In microwave plasmas, the free plasma electrons move with the oscillating electric field of the microwaves. Energy is subsequently transferred to the heavy particles (neutral and ionized gas species) via collisions. Because of their large difference in mass, this reactor is mainly efficient in でelastic collisions. Firstly, there is ionization. In steady state, the ionization rate essentially equals losses due to recombination. However, as shown in Table 1, the ionization energies are in general significantly higher than the dissociation energies, which makes dissociation via ionization inherently inefficient. Likewise, the electron impact dissociation involves an energy threshold of more than 10 eV1and is also inherently inefficient. The reason that the plasma phase can still be an efficient mechanism to achieve molecular dissociation is the efficient excitation of vibrational modes2.
At the mean electron energies of a few eV that are common for the microwave plasma3, vibrational excitation is the dominant energy transfer pathway. The asymmetric stretch is particularly important because it can rapidly distribute energy among higher levels through intermolecular collisions. The energy exchange rate increases with temperature and decreases for largerΔE, and is large due to the anharmonicity in the vibrational ladder and the associated small energy difference in two adjacent vibrational modes4. The up-pumping of higher vibrational levels can go all the way up to dissociation, which results in an energy efficient dissociation reaction5.
The high vibrational pumping in CO2 leads to a situation where higher vibrational modes are much more populated than they would be in a thermal equilibrium, ultimately producing the so-called Treanor distribution6. The condition for achieving overpopulation of the higher vibrational levels is that the Vibration-Vibration (V-V) relaxation rates are much higher than Vibration-Translation (V-T) relaxation rates. This is the case for the asymmetric stretch mode of CO2. The V-V relaxation rates decrease with increasing gas temperature, while the V-T rates increase. Since the V-T relaxations increase the gas temperature, a positive feedback mechanism can produce a runaway V-T relaxation, leading to the destruction of the overpopulation of higher vibrational levels. In other words, low gas temperatures are favorable for a strongly non-thermal distribution.
In effect, the plasma will exhibit distinctly different temperatures for the different species and their degrees of freedom. At the typical electron temperatures of a few eV, vibrational temperatures will be several thousands of degrees Celsius whilst the translational (gas) temperatures may remain below one thousand degrees Celsius. Such a situation is denoted as strong non-equilibrium and has been recognized to be favorable for chemical reactions.
The translational gas temperature, since it is so important for the energy efficiency at which the plasma might drive chemical reactions, demands accurate and spatially resolved diagnostics. Emission spectroscopy is the baseline approach in plasma physics to deduce temperatures. For example, it is possible to evaluate rotational spectra using impurities for optimal diagnosis. However, this always involves line of sight integration and therefore averaging. As we will see in the present paper, temperature gradients must be steep given the high central temperatures of up to ~ 4,000 K and edge temperatures determined by the wall of ~ 500 K. Under such circumstances, localized measurements are invaluable.
In the present work, local density measurements from Rayleigh Scattering are combined with pressure measurements to infer the temperature via the ideal gas law. The Rayleigh scattering measurements involve focusing a high-power laser in a sample volume from which the elastic scattering of the photons on the bound electrons of the CO2 molecules is detected. The gas temperature is related to the intensity of the Rayleigh signal via:

Here T is the gas temperature, p is the pressure measured by a pressure gauge, I is the measured Rayleigh intensity, dσ/dΩ(T) is the Rayleigh cross section and C is a calibration constant. Since the cross section dσ/dΩ(T) is species dependent we see that for high temperatures, where dissociation is significant, the calibration constant is a function of temperature. It is assumed that in the hot center, only equilibrium conversion takes place, so that the species concentration for a given temperature can be calculated. In this way, one can numerically calculate the effective cross section for a given temperature, which is used to calculate the Rayleigh intensity that is expected to be measured for a range of temperatures7. This effective cross section as a function of temperature is shown in Figure 1.
The performance of the plasma conversion is quantified by the means of FTIR. It is assumed in the present case of CO2 reduction that the net reaction in the plasma is:

This allows the use of a single conversion factor α, which is related to the CO volume fraction by
 ,
,
which follows from the concentrations that are inferred from the spectral signatures of CO and CO2 in the FTIR-spectra. We note that the effective Rayleigh cross section cannot easily be deduced from the overall conversion factor as determined by FTIR. The overall conversion is not only set by the central reactor temperature but also by the subtleties in the actual radial profile of the gas temperature.
The present paper details our proposed diagnostic scheme for the characterization of microwave plasma chemical gas conversion and illustrates its faculty with selected examples. Full parameter scans in terms of gas flow, pressure and microwave power for the reactor under evaluation can be found in7,8,9.
Protocol
NOTE: For a schematic version of the setup, see Figure 2.
1. Microwave Plasma Experimental Layout
- Connect the 1 kW magnetron to the circulator with a water load attached.
- Connect the isolator to the three-stub tuner that is used for impedance matching of the waveguide to the plasma.
- Attach the applicator to the three-stub tuner and add a sliding short in the end of the waveguide.
- Place a 17 mm or 27 mm inner diameter quartz tube in the hole of the applicator.
NOTE: The microwaves are absorbed in a flowing CO2 gas that is contained in this tube. - Complete the vacuum setup by connecting the quartz tube to the KF-flanges and a gas inlet.
- Use KF-16 for the 17-mm quartz tube and KF-40 for the 27-mm quartz tube. Use a tangential gas inlet to induce a vortex flow, which prevents the hot plasma from touching the walls.
- Connect a throttle valve in series with the vacuum pump; this allows for variation of the pressure from 5 mbar to atmospheric pressure by effectively regulating the pumping speed.
- In parallel to the throttle valve, connect a shortcut valve to switch between low pressure (required to facilitate ignition of the plasma) and high pressure without losing the pressure setting of the throttle valve.
- Connect a mass flow controller to the gas inlet so that the gas flow can be regulated between 0.5 and 10.0 SLM.
- Turn on the water cooling of the magnetron before starting the plasma.
- Make sure to enable safety systems, such as a radiation meter for monitoring stray microwave radiation and a gas-detector for monitoring ambient CO, H2 or NOx concentrations. These safety systems are essential during experiments.
- Turn on the power by manually turning up the power level of the source and increase to maximal power.
- Adjust the plunger by moving it back and forth slightly, while constantly monitoring if the reflected power is decreased. Aim to minimize the reflected power. Adjust the three-stub tuners by turning them until the reflected power is minimized. If a network analyzer is available, follow the procedure reported by Leinz10.
NOTE: The vacuum and microwave system can be seen in Figure 3A.
2. Optical Layout of the Rayleigh Scattering Diagnostic
- Align the 532 nm Nd:YAG laser beam with the use of mirrors such that it enters the setup axially. The laser has a 10 Hz repetition rate and a max power of 600 mJ per pulse.
- Mount windows on opposite sides (entrance and exit) of the reactor. Use windows that have been anti-reflection (AR) coated for 532 nm to prevent excessive stray light. Alternatively, use Brewster windows in combination with an external beam dump.
- Start the laser by following the user manual (see Table of Materials).
- Align the laser by using a low output power program. Start with a Q-switch delay of 0 µs so that no light output is generated. Then increase the delay in steps of 5 µs until the light output is visible.
- If the beam is too bright go down in steps of 1 µs to achieve "adequate" brightness, i.e., the lowest power at which the beam spot is still visible.
- Mount a second AR-coated window at the laser beam exit side of the vacuum system, to dump the beam on an external beam-dump. Alternatively, instead of the window, mount a vacuum beam dump. A schematic version of the setup can be seen in Figure 2.
NOTE: The elimination of the window reduces the stray light in the plasma discharge regions, which is essential to achieve detectable Rayleigh scattering signal levels. - Place a lens with a focal distance of 2.4 m in the beam path, just before the entrance window, to focus the laser to the center of the waveguide. The long focal distance reduces stray light in the Rayleigh scattering collection region. Place the lens as close as possible to the window to reduce the incident power density so that it remains below the damage threshold of the windows.
NOTE: Prevent laser breakdown in the gas, especially in the laser focus. After focusing the laser, flow CO2 in the reactor at a pressure above the pressures to be measured. If no laser breakdown can be observed, then it will not occur at the lower pressures and higher temperatures where measurements take place, because the species density will be much lower. If a loud crackling noise is heard accompanied by visible blue flashes, lower the laser power. - Install regularly spaced baffles inside the vacuum tubes to further reduce the stray light levels in the plasma discharge region due to scattering at the entrance window11.
- Prepare a plunger with a 24-mm diameter aperture for optical access perpendicular to the laser beam. The limited aperture size prevents significant microwave radiation losses.
3. Optical Setup – Detection Branch
- Place a lens (f = 100 mm, 51 mm diameter) perpendicular to the reactor and collect the scattered light through the hole in the plunger as shown in Figure 3A. Focus the light onto a 400 µm diameter optical fiber and position it in the lens image.
NOTE: The fibers are positioned in a linear array of 59 fused silica fibers with an input height of 26.7 mm and a length of 40 m. - Use the fiber to guide the light to the spectrometer.
NOTE: Here the light is imaged onto the entrance slit with a width that is tunable down to 10 µm. The magnification of the collection optics results in an axial detection range of approximately 20 mm. A spectrometer is used to filter out the coinciding C2 swan emission. If the experimenter is only interested in Rayleigh scattering, a suitable bandpass filter can also be used for this purpose. In that case, steps 3.3 to 3.6 can be skipped. The spectral filter could be eliminated altogether by comparing the measured light intensity with and without laser pulse, greatly simplifying the optical setup. If the monochromator is eliminated, it is not possible to extend the measurements to Thomson or Raman scattering, for which spectral resolution is needed. - Use a spectrometer (in house constructed) to spectrally resolve the scattered light.
NOTE: As can be seen in Figure 2, the spectrometer consists of an entrance slit, steering mirror, Littrow lens, dispersive grating, image intensifier, focusing lenses, and CCD-camera. - Inside the spectrometer, place a mirror to reflect the incoming light to the Littrow lens with a focal distance of 0.3 m and a diameter of 80 mm.
NOTE: The spectrometer is in the 'Littrow' configuration, which means that incident and diffracted light have the same angle to the grating normal. Consequently, the same lens is used for collimating incoming light and imaging diffracted light onto the detector. - Rotate the diffraction grating on a rotation stage to tune to the appropriate wavelength range. For a Nd:YAG laser, this is typically between 524 and 540 nm. The grating is 11 x 11 cm2 and has a groove density of 1,200 mm-1 that is optimized for first order diffraction. This results in a resolution of 0.027 nm/px. Figure 3B shows a picture of the grating and Littrow lens.
NOTE: The grating will image multiple spots as a result of higher order; make sure that only the 1st order maximum ends up on the image intensifier. - Place two lenses to image the intensified light on a CCD-camera (Figure 3C).
- Quantify the stray light contributions. Pump down to a pressure of 60 mbar and measure the scattered intensity. Reduce the pressure and measure the intensity again. Repeat this until the pressure cannot be lowered any further.
- When plotting the intensity vs. pressure, ensure that there is a linear relationship. Extrapolate the linear function to zero pressure.
NOTE: Since no Rayleigh scattering can occur at zero pressure, the intensity at the intercept is the stray light level. The result of this procedure is shown in Figure 4. - Adjust the gating parameters of the image intensifier to optimize the intensity recorded by the CCD. Start with a gate pulse that starts well before and ends well after the laser pulse so that the entire laser pulse is captured.
- Take into account the time-of-flight delay of the light because the light has to travel through the entire optical setup. Reduce the delay while making sure that the intensity is not reduced.
NOTE: A time window of 30 ns was found to be adequate for a 9 ns pulse. To increase the gain, increase the multichannel-plate voltage to the maximum voltage (here, 850 V). If the CCD-camera is over-exposed a smaller multichannel-plate voltage can be chosen.
4. FTIR Spectrometer
- Place an FTIR spectrometer in the exhaust of the gas, downstream of the plasma, to measure the CO-production rate. Place the spectrometer far enough from the reactor to ensure the gas is in chemical equilibrium. In the setup described, the distance from the plasma was 2 m.
- Put a cell in the sample compartment of the FTIR spectrometer with in- and outlet bellows connected in series with the vacuum system. This is shown schematically in Figure 5.
- Mount a CaF2 window on each side of the cell to allow the IR-beam to probe the gas.
- Change the signal gain until the signal intensity is as close as possible to the maximum, but not exceeding it. The maximum allowable intensity may be different from device to device.
- Click on the 'interferogram' preview. An interferogram is now visible, with a high peak in the center and a low intensity at the shoulders.
- Before starting measurements, measure a background at vacuum (< 0.1 mbar). To do this make sure that the reactor is at vacuum and there is no gas flow; then record a background by clicking 'Background' in the 'Signal Level Monitor' window.
- Turn on the microwave by increasing the power to maximum, until the plasma ignites. The pressure used for plasma ignition is ~ 1 mbar.
- Record a spectrum in the range from 2,400 to 2,000 cm-1; this includes the CO and main CO2 band.
- Average the spectra to reduce noise; a value of 10 averages was used in this experiment. Fit the measured CO-lines using the HITRAN-database12.
NOTE: This results in a CO volume fraction. The pressure is measured and used as an input parameter to find the total number density. The temperature is assumed to be room temperature, which is justified by the distribution of rovibrational peaks in the spectrum. - For measuring in situ spectra, place the reactor inside the sample compartment as depicted in Figure 6 and 7.
- Switch to a sapphire instead of quartz tube to enable radial measurements. The sapphire transmits IR-light down to 1,800 cm-1.
- With in situ measurements, use a high number of averages of at least 100 to average out fluctuations in the plasma.
- Decorate the compartment walls with microwave absorbent material to reduce the stray microwave radiation (Eccosorb OCF was used here).
- Take care that the interferogram does not saturate as a result of the additional IR-emission by the plasma. If this is the case, change the DC-offset of the detector. Correct the resulting spectra for the temperature dependent absorption of sapphire13.
- If an IR-camera is used for measuring the temperature, use a camera that is sensitive in a range for which the sapphire is not transparent, i.e. higher than 6 µm, so that the tube temperature rather than the plasma is measured.
NOTE: Recommended values for the absorption of sapphire as a function of temperature can be found in14.
Representative Results
In this section, representative results for the flowing plasma reactor are presented. It is found that the CO-conversion is shown to increase linearly with specific energy, until about 2.2 eV/molecule. The energy efficiency η is calculated as:

Here α is the measured conversion, q the molecular gas flow rate, ΔE = 2.7 eV the net dissociation energy, and Pで the input power. By using the measured conversion (explained in next paragraph), we can find the energy efficiency of the plasma reactor, which is plotted for a variety of pressures and powers and a fixed flow rate of 13 SLM in Figure 8A and 8B. The plasma proved capable of converting CO2 to CO with an energy efficiency of up to 49%, which is comparable to the maximal thermodynamic efficiency5. Although the efficiency reported here is close to that of thermal dissociation, it proves that a non-equilibrium plasma can produce a higher CO volume fraction than in equilibrium at the measured translational temperature.A great advantage over thermal dissociation is that the reaction can be turned on or off in a few seconds, which is needed for mitigating fluctuating power production. In addition, there is the potential to increase the efficiency further by tailoring the Electron Energy Distribution Function (EEDF).
We now focus on results obtained for the exhaust. The CO-concentration is measured by IR absorption spectroscopy. In Figure 9A and 9B, a representative spectrum is shown. The fit results in a temperature of 299.36 K and a conversion of 14.7%. The measured data (blue) is in good comparison with the fit data (green). Since the temperature in the exhaust is close to room temperature, it is feasible to leave the temperature as a fixed parameter in the fitting procedure. Next, the in situ measurements are discussed. When interpreting the Rayleigh light intensity, it must be taken into account that the Rayleigh cross sections of the reaction products – CO, O and O2 – differ significantly from that of CO215,16. This issue can only be solved if information of the sample volume composition is available. If the Raman spectrum can be recorded, it is suggested to monitor the Raman spectrum of the CO-molecule to estimate the local number density of the products. A polarizer could be used in this case to eliminate stray light, Thomson, and Rayleigh scattering, while reducing the intensity of the rotational Raman scattered light by only a factor 3/717. If the Raman spectrum cannot be measured because the Rayleigh peak is not sufficiently reduced, the conversion can be estimated based on equilibrium conversion (see references7,20). Though this ignores the enhanced production due to non-equilibrium conditions, the gas temperatures are high enough to justify this simplification. In Figure 10, the temperature data are shown with the different Rayleigh cross sections included. It was found that without any optimization to the plasma, the gas in the plasma center can reach temperatures of up to 5,000 K. It has been shown in Ar plasmas that the Thomson scattering and scattering from excited species becomes significant if the temperature reaches the order of 10,000 K 18,19,20, making the temperature measurement unreliable. Given the values of the differential cross sections for Rayleigh and Thomson scattering of 0.148·10-30 m2 and 7.94·10-30 m2, respectively, an ionization degree of 1.9·10-4 would be necessary for a Thomson contribution of 1%. This is much higher than the ionization degree predicted to be present in the plasma (Fridman5, p294) of 1·10-6 to 8·10-5.
The in situ FTIR-measurements were at a flow of 2.0 slm and a significantly lower pressure of 5 mbar to make a homogeneous plasma, which ensures a reliable path-integrated measurement. This also means that the plasma itself touches and heats the wall. To prevent the wall from becoming too hot, the power is reduced to only 30 W. Although CO-production is negligible at this low power and pressure, the in situ FTIR still provides relevant insights into the dynamics of the CO2 plasma. Spectra were recorded with a resolution of 0.125 cm-1. The spectrum was fitted with a model based on HAPI, the application programming interface of HITRAN12. The code was modified to include separate temperatures for the different vibrational normal modes. A single temperature T12 was used for both the symmetric stretch and bending mode, because the Fermi-resonance guarantees a rapid relaxation between the two normal modes.
The result of the fit is T = 700 K, T12 = 1,250 K, and T3 = 1,500 K, as shown in Figure 11. The fitted pressure was 10 mbar. This overestimation is likely to compensate for an underestimated temperature coefficient for the pressure broadening constants. The gas temperature found with Rayleigh scattering can differ from the one found with FTIR, since Rayleigh scattering measures local temperatures while the FTIR spectra are line integrated.
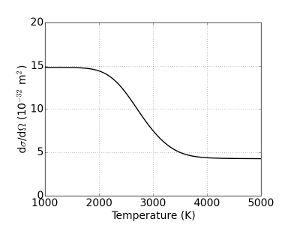
Figure 1: Temperature dependence of Rayleigh cross section
The Rayleigh cross section that results when from the different cross sections for reaction products. A conversion in the thermal equilibrium is assumed to calculate the relative species mole fractions. Please click here to view a larger version of this figure.
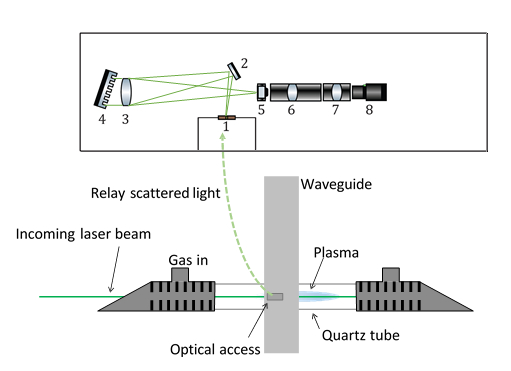
Figure 2: Optical setup for Rayleigh measurements
A lens focuses the laser light to the quartz tube center. The waveguide launches microwaves into the plasma, positioned in the focus of the laser. A hole in the plunger provides optical access for the laser chord. The spectrometer consists of (1) the entrance slit, (2) a steering mirror, (3) the Littrow lens, (4) dispersive grating, (5) image intensifier, (6) and (7) focusing lenses, and (8) CCD-camera. Please click here to view a larger version of this figure.

Figure 3: Pictures of setup
(A) Picture of the vacuum setup, including the microwave applicator and optical fibers. (B) Picture of the inside of the spectrometer, with the Littrow lens and diffraction grating visible. (C) Picture of the lens system used to image the intensified light to the CCD-camera. Please click here to view a larger version of this figure.
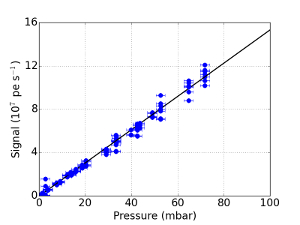
Figure 4: Measured intensity as function of pressure
The measured Rayleigh scattering as a function of pressure, for different points in time. The blue solid line represents a linear fit of the data. The error bars indicate the absolute error of the pressure gauge. Please click here to view a larger version of this figure.
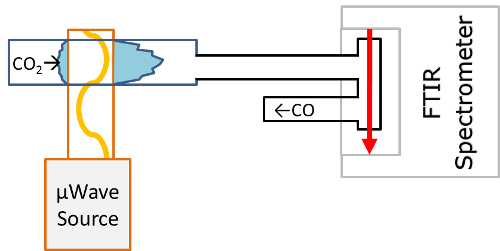
Figure 5: Schematic drawing of FTIR gas exhaust analysis setup
A gas cell is placed in the sample compartment of the FTIR spectrometer. The cell is connected in series with the exhaust so that gas is flowing through it. Please click here to view a larger version of this figure.
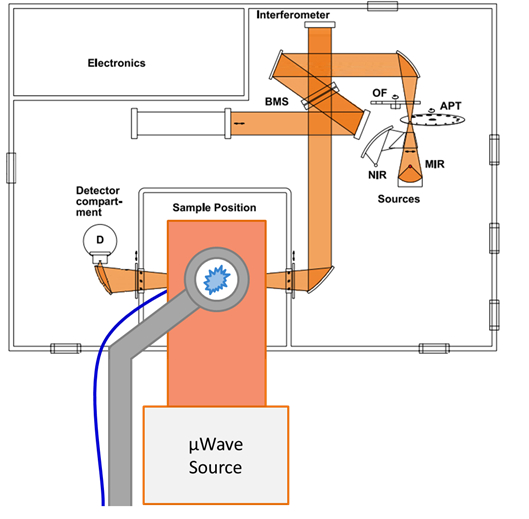
Figure 6: In situ FTIR setup
Schematic pictures of the in situ FTIR setup. The flow tube is upright and gas flows from the bottom to top. The tube is in the focus of the FTIR beam. Please click here to view a larger version of this figure.
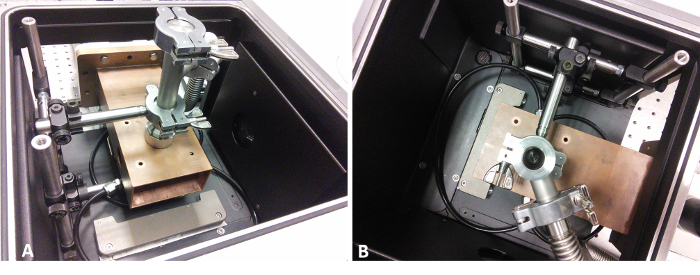
Figure 7: Pictures of the in situ FTIR setup
Side (A) and top (B) view of the waveguide in the sample compartment of the FTIR-spectrometer. The bellows on the top of the waveguide are connected to the vacuum pump and act as an exhaust for the reactor. Please click here to view a larger version of this figure.
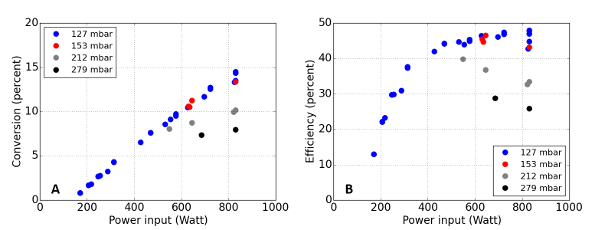
Figure 8: Representative energy efficiency and conversion efficiency
In graph (A), the energy efficiency for a typical plasma is depicted as a function of applied microwave power, at pressures ranging from 127 to 279 mbar. In graph (B), the conversion efficiency is depicted. Please click here to view a larger version of this figure.

Figure 9: Representative infrared (IR) absorption spectrum of CO
Graph (A) shows the measured IR absorption spectrum of the gas exhaust (blue dots). The green solid line shows the is least squares fit to the data. The fit results are T = 299.36 K and α = 14.7%. A zoomed-in picture is shown in (B). Please click here to view a larger version of this figure.
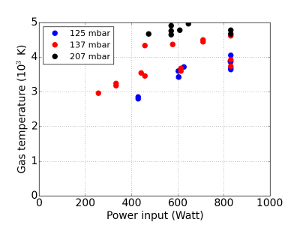
Figure 10: Measured gas temperature
In this graph, the gas temperature of the plasma center as measured by Rayleigh scattering is shown as a function of energy input for different pressures. Please click here to view a larger version of this figure.
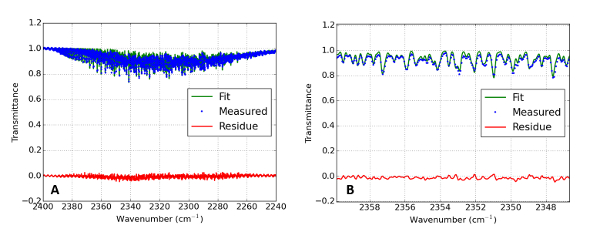
Figure 11: In situ IR absorption spectrum of the plasma discharge
Graph (A) shows the measured IR absorption spectrum of the CO2 discharge. The blue line gives the best fit to the data (green points) with T = 700 K, T12 = 1,250 K, and T3 = 1,500 K. The red line gives the residue of the fit. A zoomed in picture can be seen in (B). Please click here to view a larger version of this figure.
| Ionization | Dissociation | |
| eV | eV | |
| CO2 | 13.77 | 5.52 |
| CO | 14.01 | 11.16 |
| O2 | 12.07 | 5.17 |
| N2 | 15.58 | 9.8 |
| CH4 | 12.51 | 4.54 |
| CH3 | 9.84 | 4.82 |
| CH2 | 10.4 | 4.37 |
| CH | 10.64 | 3.51 |
| H2 | 15.43 | 4.52 |
Table 1: Ionization and dissociation energies of common species and products.
Discussion
Both for the electrification of the chemical industry and mitigating the intermittency in renewable energy, continuous flow reactors are needed for driving chemistry in a sustainable system. It has been recognized that continuous flow reactors will play an important role in revolutionizing the chemical industry21. More specifically, the plasma reactor has been identified as a commercially attractive alternative to chemical plants in the production of CO2 neutral fuels due to their simplicity, compactness and low price22. A wide range of plasma technologies have been proposed for the dissociation of CO223, including Corona discharges24,25,26, nanosecond pulsed discharges27, micro hollow cathode discharges28, microplasmas29, dielectric barrier discharges30,31,32,33, gliding arcs34,35, and microwave plasmas37,38. Out of these vastly varying technologies, the microwave plasma and gliding arc have been operated with the highest power, in the kW range, and have shown the best efficiencies, 40% for a gliding arc and 60-80% for a microwave discharge. Both the microwave plasma and the gliding arc reactor can be run at high power, a necessary condition for scaling up to ~ 100 kW, which is projected for a practical application. The operation of the microwave plasma is not limited to CO2 dissociation and might also be used for methane reforming and nitrogen fixation. The main drawback of the microwave reactor is the low pressure (100 mbar) in optimal conditions, which limits the maximal gas throughput.
The described procedure was demonstrated with CO2, but it can be used without alteration for activation of CH4, N2 or other stable molecules. In most of these cases, different IR-bands need to be measured that correspond to the expected products like NH3, NOx, C2H2, C2H4, etc. Running methane plasma can be cumbersome as the soot – one of the reaction products – is deposited to the walls and will absorb microwaves, effectively extinguishing the plasma. Although vibrational pumping is much less effective in methane than in CO2 because of the high VT-transfer rates, plasma-catalysis can nevertheless be advantageous for methane (Fridman5, p.688)
Accurate Rayleigh scattering measurements are difficult to achieve in a soot-forming plasma, because of the high stray light contribution as a result of Mie scattering on the soot particles. Although it complicates the Rayleigh measurements, it could be used to quantify the density of soot particles instead39. Raman scattering could provide an attractive alternative for measuring temperature in this environment, as it allows for spectrally distinguishing the stray light and (Raman) scattered light components. The integration time of the Raman scattering is in the order of ~ 20 minutes, so that the fluctuations in the plasma are averaged out. Only long term effects like heating of the system could affect the measurement, as it slightly increases the pressure in the reactor.
Precisely because of the large spectral overlap between stray light and Rayleigh scattered light, the importance of stray light suppression (even in the absence of soot) cannot be overstated. The stray light can be reduced by properly placing baffles, increasing the focal distance of the laser and setup length, and increasing the tube diameter. The use of a vacuum beam dump further reduces the stray light levels as it eliminates the exit window. Alternatively, Brewster windows can be used as well. As described before, some knowledge of the composition is required (either measured or simulated) to properly account for the different Rayleigh cross sections.
The flowing microwave plasma has proven itself to be a viable method of driving chemistry with an energy efficiency of up to 50%, the flexibility of fast switching, and using only inexpensive materials. The recorded temperatures in the center however, are much higher than what is favorable for high vibrational overpopulation. By reducing the temperature, even higher energy efficiencies can be reached. Although lowering the power (e.g., to 200 W) would lower the gas temperature, without additional optimization of the reactor, it also lowers the efficiency.
Two other ways of reducing the temperature are suggested here. The first way is to pulse the microwave power. By applying the power in pulses shorter rather than the typical VT-relaxation time, the gas can cool down in between the pulses and as a result, less power is lost in the VT-relaxation. This in turn means more power is invested in the vibrational pumping that promotes efficient dissociation. The VT-relaxation time is 70 µs at room temperature and 100 mbar40, which serves as an upper limit for the pulse ON-time. Pulsing can only increase efficiency in a plasma regime where the main conversion pathway is by non-equilibrium conversion. The second way to increase efficiency is to add alkali impurities to tailor the EEDF8. By controlling the EEDF, and in particular the electron temperature, the electrons can more efficiently transfer their energy to molecular vibrations, which again results in the promotion of higher vibrational levels that are essential to highly efficient reactions.
開示
The authors have nothing to disclose.
Acknowledgements
This work was funded by the call 'CO2-neutral fuels' supported by Shell, the Foundation for Fundamental Research on Matter (FOM), and the Netherlands Organization for Scientific Research (NWO). The authors would like to thank Eddie van Veldhuizen, Ana Sobota and Sander Nijdam for allowing us to use their lab space and their generous support in general.
Materials
| 1kW magnetron | Muegge | MW-GIRYJ1540-1K2-08 | |
| Circulator with water load | Philips | 2722 163 02101 | |
| 3-stub tuner | IBF-electronic | WR340PTUN3AC174A | |
| Applicator with sliding short | homemade | ||
| 17mm ID / 20 mm OD Quartz tube | Saillart | custom | |
| 27mm ID / 30 mm OD Quartz tube | Saillart | custom | |
| 18mm ID / 20 mm OD Sapphire tube | Precision Sapphire Technologies | custom | |
| KF-vacuum flanges | Hositrad | ||
| Mass flow controller | Tylan/Brooks | FC-2901V-4V | |
| MFC control unit | MKS | PR-3000 | |
| Pressure guage | Edwards | ASG-2000 | |
| Vacuum pump | Edwards | E2M18 | |
| Nd:YAG laser | Continuum | Powerlite DLS 8000 | |
| AR-coated window | Eksma Optics | 210-1202E + 3025-i0 (coating) | |
| Diffraction grating | Jobin Yvon | 520-25-120 | |
| Image Intensifier | Katod | EPM102G-04-22S | |
| Intensifier power source | homemade | ||
| Spectrometer lens 1 | Nikon | 135mm f/2 DC | |
| Spectrometer lens 2 | Nikon | AF-S 85 mm f/1.8g | |
| CCD-camera | Allied Optics | Manta G-145B | |
| FTIR-spectrometer (exhaust) | Varian/Agilent | Cary 670 | |
| FTIR-spectrometer (in-situ) | Bruker | Vertex 80v | |
| CaF2 windows | Crystran | CAFP25-2U |
参考文献
- Itikawa, Y. Nonresonant Vibrational Excitation of CO2 by Electron Collision. Phys Rev A. 3 (2), 831-832 (1971).
- Rusanov, V. D., Fridman, A. A., Sholin, G. V. The physics of a chemically active plasma with nonequilibrium vibrational excitation of molecules. Phys Usp. 24 (6), 447-474 (1981).
- Fridman, A. A., Kennedy, L. A. . Plasma Physics and Engineering. , (2004).
- Witteman, W. J. . The CO2-laser. , (1987).
- Fridman, A. A. . A Plasma Chemistry. , (2008).
- Treanor, C. E., Rich, J. W., Rehm, R. G. Vibrational Relaxation of Anharmonic Oscillators with Exchange-Dominated Collisions. J Chem Phys. 48 (4), 1798-1806 (1968).
- den Harder, N., et al. Homogeneous CO2 conversion by microwave plasma: Wave propagation and diagnostics. Plasma Process Polym. , (2016).
- van Rooij, G. J., et al. Taming microwave plasma to beat thermodynamics in CO2 dissociation. Farad Discuss. 183, 233-248 (2015).
- Bongers, W. A., et al. Plasma-driven dissociation of CO2 for fuel synthesis. Plasma Process. Polym. , (2016).
- Leins, M., Gaiser, S., Schulz, A., Walker, M., Schumacher, U., Hirth, T. How to Ignite an Atmospheric Pressure Microwave Plasma Torch without Any Additional Igniters. J Vis Exp. (98), e52816 (2015).
- van der Meiden, H. J., et al. High sensitivity imaging Thomson scattering for low temperature plasma. Rev Sc. Instrum. 79 (1), 13505-13700 (2008).
- Rothman, L. S., et al. The HITRAN 2012 Molecular Spectroscopic Database. J Quant Spectrosc. Radiat Transfer. 130, 4-50 (2013).
- Depraz, S., Perrin, M. Y., Soufiani, A. Infrared emission spectroscopy of CO2 at high temperature. Part I: Experimental setup and source characterization. J Quant Spectrosc Radiat Transfer. 113, 1-13 (2011).
- Dobrovinskaya, E. R., et al. . Sapphire: Material, Manufacturing, Applications. , 170 (2009).
- Sneep, M., Ubachs, W. Direct measurement of the Rayleigh scattering cross section in various gases. J Quant Spectrosc Radiat Transfer. 92 (3), 293-310 (2005).
- Sutton, J. A., Driscoll, J. F. Rayleigh scattering cross sections of combustion species at 266, 355, and 532 nm for thermometry applications. Optics Letters. 29 (22), 2620-2622 (2004).
- Penney, C. M., Peters, R. L., Lapp, M. Absolute raman cross sections for N2. J Opt Soc Am. 64 (5), 712-716 (1974).
- Murphy, A. B., Farmer, A. J. D. Temperature measurement in thermal plasmas by Rayleigh scattering. J Phys D: Appl Phys. 25 (4), 634 (1992).
- Snyder, S. C., et al. Determination of gas-temperature and velocity profiles in an argon thermal-plasma jet by laser-light scattering. Phys Rev E. 47 (3), 1998-2005 (1993).
- Limbach, C., Dumitrache, C., Yalin, A. P. Laser Light Scattering from Equilibrium, High Temperature Gases: Limitations on Rayleigh Scattering Thermometry. 47th AIAA Plasmadynamics and Lasers Conference. , (2016).
- Wiles, C., Watts, P. Continuous flow reactors: a perspective. Green Chem. 14, 38-54 (2012).
- Cormier, J. M., Rusu, I. Syngas production via methane steam reforming with oxygen: plasma reactors versus chemical reactors. J Phys D: Appl Phys. 34, 2798-2803 (2001).
- Liu, C. J., Xu, G. H., Wang, T. M. Non-thermal plasma approaches in CO2 utilization. Fuel Process Technol. 58 (2-3), 119-134 (1999).
- Wen, Y., Jiang, X. Decomposition of CO2 using pulsed corona discharges combined with catalyst. Plasma Chem Plasma Process. 21 (4), 665-678 (2001).
- Mikoviny, T., Kocan, M., Matejcik, S., Mason, N. J., Skalny, J. D. Experimental study of negative corona discharge in pure carbon dioxide and its mixtures with oxygen. J Phys D: Appl Phys. 37 (1), 64 (2004).
- Horvath, G., Skaln’y, J. D., Mason, N. J. FTIR study of decomposition of carbon dioxide in dc corona discharges. J Phys D: Appl Phys. 41 (22), 225207 (2008).
- Bak, M. S., Im, S. K., Cappelli, M. Nanosecond-pulsed discharge plasma splitting of carbon dioxide. IEEE Trans Plasma Sci. 43 (4), 1002-1007 (2015).
- Taylan, O., Berberoglu, H. Dissociation of carbon dioxide using a microhollow cathode discharge plasma reactor: effects of applied voltage, flow rate and concentration. Plasma Sources Sci Technol. 24 (1), 015006 (2015).
- Yamamoto, A., Mori, S., Suzuki, M. Scale-up or numbering-up of a micro plasma reactor for the carbon dioxide decomposition. Thin solid films. 515 (9), 4296-4300 (2007).
- Paulussen, S., Verheyde, B., Tu, X., De Bie, C., Martens, T., Petrovic, D., Bogaerts, A., Sels, B. Conversion of carbon dioxide to value-added chemicals in atmospheric pressure dielectric barrier discharges. Plasma Sources Sci Technol. 19 (3), 034015 (2010).
- Brehmer, F., Welzel, S., van de Sanden, M. C. M., Engeln, R. CO and byproduct formation during CO2 reduction in dielectric barrier discharges. J Appl Phys. 116 (12), 123303 (2014).
- Yu, Q., Kong, M., Liu, T., Fei, J., Zheng, X. Characteristics of the decomposition of CO2 in a dielectric packed-bed plasma reactor. Plasma Chem Plasma Process. 32 (1), 153-163 (2012).
- Aerts, R., Somers, W., Bogaerts, A. Carbon Dioxide splitting in a dielectric barrier discharge plasma: A combined experimental and computational study. Chem Sus Chem. 8 (4), 702-716 (2015).
- Indarto, A., Yang, D. R., Choi, J. -. W., Lee, H., Song, H. K. Gliding arc plasma processing of CO2 conversion. J Hazard Mater. 146 (1), 309-315 (2007).
- Nunnally, T., Gutsol, K., Rabinovich, A., Fridman, A., Gutsol, A., Kemoun, A. Dissociation of CO2 in a low current gliding arc plasmatron. J Phys D: Appl Phys. 44 (27), 274009 (2011).
- Indarto, A., Choi, J. -. W., Lee, H., Song, H. K. Conversion of CO2 by gliding arc plasma. Environ Eng Sci. 23 (6), 1033-1043 (2006).
- Rusanov, V. D., Fridman, A. A., Sholin, G. V. The physics of a chemically active plasma with non-equilibrium vibrational excitation of molecules. Sov Phys Usp. 24 (6), 447 (1981).
- Butylkin, I. u. P., Zhivotov, V. K., Krasheninnikov, E. G., Krotov, M. F., Rusanov, V. D., Tarasov, I. u. V., Fridman, A. A. Plasma-chemical process of CO2 dissociation in a nonequilibrium microwave discharge. Zh Tek Fiz. 51, 925-931 (1981).
- Will, S., Schraml, S., Leipertz, A. Two-dimensional soot-particle sizing by time-resolved laser-induced incandescence. Opt Lett. 20, 2342-2344 (1995).
- Lepoutre, F., Louis, G., Manceau, H. Collisional relaxation in CO2 between 180 K and 400 K measured by the spectrophone method. Chem Phys Lett. 48, 509-514 (1977).

