The Use of Pharmacological-challenge fMRI in Pre-clinical Research: Application to the 5-HT System
概要
The goal of this technique is to assess serotonin (5-HT) neurotransmitter function in the live and free-breathing animal with pharmacological magnetic resonance imaging (phMRI) and an intravenous challenge with a selective serotonin reuptake inhibitor (SSRI), fluoxetine.
Abstract
Pharmacological MRI (phMRI) is a new and promising method to study the effects of substances on brain function that can ultimately be used to unravel underlying neurobiological mechanisms behind drug action and neurotransmitter-related disorders, such as depression and ADHD. Like most of the imaging methods (PET, SPECT, CT) it represents a progress in the investigation of brain disorders and the related function of neurotransmitter pathways in a non-invasive way with respect of the overall neuronal connectivity. Moreover it also provides the ideal tool for translation to clinical investigations. MRI, while still behind in molecular imaging strategies compared to PET and SPECT, has the great advantage to have a high spatial resolution and no need for the injection of a contrast-agent or radio-labeled molecules, thereby avoiding the repetitive exposure to ionizing radiations. Functional MRI (fMRI) is extensively used in research and clinical setting, where it is generally combined with a psycho-motor task. phMRI is an adaptation of fMRI enabling the investigation of a specific neurotransmitter system, such as serotonin (5-HT), under physiological or pathological conditions following activation via administration of a specific challenging drug.
The aim of the method described here is to assess brain 5-HT function in free-breathing animals. By challenging the 5-HT system while simultaneously acquiring functional MR images over time, the response of the brain to this challenge can be visualized. Several studies in animals have already demonstrated that drug-induced increases in extracellular levels of e.g. 5-HT (releasing agents, selective re-uptake blockers, etc) evoke region-specific changes in blood oxygenation level dependent (BOLD) MRI signals (signal due to a change of the oxygenated/deoxygenated hemoglobin levels occurring during brain activation through an increase of the blood supply to supply the oxygen and glucose to the demanding neurons) providing an index of neurotransmitter function. It has also been shown that these effects can be reversed by treatments that decrease 5-HT availability16,13,18,7. In adult rats, BOLD signal changes following acute SSRI administration have been described in several 5-HT related brain regions, i.e. cortical areas, hippocampus, hypothalamus and thalamus9,16,15. Stimulation of the 5-HT system and its response to this challenge can be thus used as a measure of its function in both animals and humans2,11.
Protocol
Preparing animal for in vivo MRI imaging
1. Surgical Cannulation
- Anesthetize the rat (male Wistar rat, 200-300 g) with isoflurane (5% induction and then reduced to 1.5-2% for maintenance of anesthesia during animal preparation and scanning) given in medical air (21% O2, BOC UK). Ensure that the animal is well anesthetized and exhibits no response to a toe pinch. The femoral artery and vein are cannulated for blood gas and blood pressure measurements and administration of the drug challenge respectively. During the surgical procedure, the animal’s body temperature is monitored and maintained through a rectal probe and a thermal blanket (Harvard apparatus).
- The anesthetized animal is positioned on a warming pad under a dissecting microscope in dorsal recumbency. Shave the mid-thigh area and swab the skin with alcohol. Make a 2 cm skin incision along the crease formed by the abdomen and right thigh. Blunt dissection of the adductor muscles is used to visualize the femoral artery, vein and the femoral nerve. Separate carefully the vessels.
- Gently tie a silk ligature completely around the distal end of the vessel and place another tie with half of a surgical knot loosely in the proximal site. Apply traction to both ligatures, to occlude blood flow in the remaining middle portion of the vessel exposed between the ligatures. Make a small incision of about a third of the vessel circumference in this part of the vessel to allow insertion of a PE-50 cannula (0.54 mm internal diameter and 0.96mm for external diameter in case of adult male rats, otherwise 0.40 mm ID and 0.80 mm ED) into the vessel.
- The cannula should be inserted several mm (at least 5) into the vessel. Once into the lumen, flush a small amount of heparinized saline (15 UI/ml) through the vessel to avoid any formation of blood clot. The proximal silk loop is also ligated completely to fix the cannula. Repeat this procedure for the second vessel. Glue the skin using a Vetbond Tissue Adhesive (3M UK plc, Bracknell, UK) when both cannulas are in place. See Figure 1 for exact placement of the cannulas.
- Place the animal in a MR compatible stereotactic bed (m2m Imaging Corp., USA) in a prone position. Maintain the head of the animal through the insertion of ear bars and a tooth bar. At this point, the animal can be placed in the MRI scanner for imaging. The animal remains anesthetized and is free-breathing throughout the entire imaging procedure.
2. Monitoring
During the entire imaging procedure, several physiological responses should be constantly monitored and be kept as constant as possible. This is essential, since these responses can vary greatly over the same time window as the phMRI signal and also affect the signal of interest. It is also important, given that the animal will be placed in the magnet and is therefore out of sight and not amenable to standard checks of anesthetic depth (e.g. toe pinch), for ensuring adequate anesthetic depth. Additionally, given that many drugs alter cardiovascular parameters such as blood pressure, measurement of these is critical to ensure account can be taken of global physiological effects of the drug’s action in the phMRI data. See also section 4 for the baseline values and the expected responses to the infusion of 5 mg/kg fluoxetine.
- Body temperature is maintained at 37 ± 1.5 °C by a warm air heating system (SA Instruments, New York, USA). Be aware that MR imaging can affect temperature measurement, check this with your own system.
- Monitor and record the animal’s respiration rate using a respiratory cuff coupled to pressure sensor (SA Instruments, New York, USA).
- Record invasive arterial blood pressure using a pressure transducer (TSD104A, Biopac Systems Corp., USA) and periodically withdraw and analyze arterial blood gas samples (RapidLab, Siemens diagnostic) via the cannulated femoral artery during imaging to monitor arterial pCO2 and partial pressure of oxygen (pO2).
- Use the cannulated femoral vein as the main infusion line for the pharmacological challenge (fluoxetine (fluoxetine hydrochloride from Sigma-Aldrich, UK) solution, 5 mg/kg, dissolved in saline).
In vivo imaging
A schematic representation of the fMRI experimental setup is given in Figure 2.
3. Imaging Parameters
- Once the animal is placed inside the scanner and continues to show stable physiological responses, imaging can start. In our studies, we used a 4.7 T small animal MRI system (Agilent technologies) with a cylindrical quadrature transmit/receive RF coil with 72 mm inner diameter (m2m Imaging Corp., USA). Make a three plane scout image to correctly position the brain in the middle of the MRI field of view and use localized shim correction (fastmap sequence) to improve the magnetic field homogeneity in the brain.
- For each animal, first acquire a T2-weighted anatomical image volume for registration and segmentation purposes. We used a turbo spin echo sequence with echo train length = 8; matrix size = 256 x 256; FOV = 50 x 50 mm2; with interleaved acquisition of 30 contiguous coronal slices with 1 mm thickness, centered 8 mm caudal to the posterior edge of the olfactory bulb; averages = 4; TR/TE = 5112/60 ms.
- Make sure the animal its physiological responses are constant before starting the phMRI scan. For the time series acquisition, we used the same T2-weighted turbo spin echo sequence with echo train length = 16; matrix size = 128 x 128; with interleaved acquisition of 20 contiguous slices with 1 mm thickness centered at same position; TR/TE = 4915/60 ms. In total, we acquired 32 time points with an acquisition time of 158 sec per time series volume and a total scan time of 84 min. The first volume is used as a ‘dummy scan’ to address T1 saturation effects and not used in the data analysis. Other fMRI sequences such as gradient echo or echo planar imaging (EPI) sequences can also be used. Make sure to assess the signal stability of your sequence of choice before start of your experiment.
- Acquire a number of baseline volumes, before administering the challenge medication. We suggest at least 10 minutes of baseline acquisition under stable conditions. Start the infusion at exactly the same time for all animals. In our protocol, we started administration at the start of the 9th volume (after approximately 21 min baseline scanning). After infusion, image acquisition continued for another 60 minutes (32 volumes in total). Make sure the post-infusion period is long enough to visualize changes and to reach steady state or recovery of the signal, depending on your research question and your choice of drug challenge.
- When image acquisition is finished, remove the animal from the scanner. Perform a final blood gas measurement to ensure stability of the blood gas parameters and to enable evaluation of the drug effects on basic physiology.
Data processing
4. Physiological Responses
Expected physiological responses to the challenge are dependent on the chosen drug. Below, generally accepted baseline values (of adult male rats) and the expected responses to the i.v. infusion of 5 mg/kg fluoxetine are given.
- Respiration rate should be stable at 45-75 breaths/minute. The pharmacological challenge of fluoxetine induces a short rise (15-20%) in respiration rate.
- Blood pressure should be constant and between 100-150 mmHg (Biopac Systems Corp., Goweta, USA). The fluoxetine challenge induces a short but steep drop of about 20% in arterial blood pressure. This should recover within 5-10 minutes. This is shown in Figure 3.
- Blood gas values should be stable (measure at least twice) and within the following ranges before starting the phMRI scan: pCO2, 35-45 mmHg; pO2, 80-130 mmHg; pH, 7.35-7.45. Always check these values again after scanning to see if the animal remained stable and to enable evaluation of the drug effects on basic physiology. High pCO2 values will induce vasodilatation and will thus avoid seeing BOLD signal changes.
- Make sure that the animal is under a continuous and constant level of anesthesia (2±0.25%; higher levels can cause depression of cerebrovascular reactivity and lower insufficient anesthesia and thus movement), before starting the phMRI scan and importantly, avoid any adjustments in the anesthesia regime (e.g. % isoflurane and/or gas flow) during the functional image acquisition as this could also affect the BOLD signal.
5. Preprocessing MRI Data
Here we describe several steps in the preprocessing of the MR data in order to optimalize the data for statistical analysis. We mention the tools that are used in our lab, however many different tools are available.
5.1 Data preparation
- Put the raw images in the correct file format for the MRI analysis software that you prefer to use (NIfTI1.1 or Analyze7.5 format for FSL programs). Several free file converter programs are available online. Depending on the used scanner, it might be necessary to first construct a 3D (anatomical scan) or 4D (phMRI scan) image of all separate 2D slices. This can be done using an image processing program, such as ImageJ1.
- In order to ensure compatibility with analysis algorithms designed for use with human data (e.g. FSL programs), voxel size has to be multiplied by a factor 10 (this can also be done using for example ImageJ). In our study, this resulted in a voxel size of 3.91 x 3.91 x 10 mm3.
- Visually check your images for irregularities in orientation, artefacts, and motion. Be careful not to use scans with clear artefacts or excessive motion in your analyses as they will distort you results.
- Orientation of all scans should be similar between the anatomical and functional images and in concordance with the used reference brain. In our study, we used the stereotactic rat brain template described by Schwarz14. The FSL command fslswapdim can be used for reorienting.
5.2 Motion correction
- To correct for any motion artefacts in the 4D time series, we used the motion correction tool McFlirt (Motion Correction using FMRIB’s Linear Image Registration Tool, part of FMRIB’s Software Library, www.fmrib.ox.ac.uk/fsl). MCFLIRT is an intra-modal motion correction tool designed for use on fMRI time series and based on optimization and registration techniques used in FLIRT, a fully automated tool for linear (affine) inter-modal brain image registration. Always check afterwards if the result is satisfactory.
5.3 Brain segmentation
- Delete all non-brain tissue from an image of the whole head for both the 4D time series as the 3D anatomical image. For this we used the FSL tool BET (Brain Extraction Tool v. 2.1, part of FMRIB’s Software Library, www.fmrib.ox.ac.uk/fsl). The default settings are developed for use with human brains and are thus not ideal for rat brain. We used the following parameters: fractional intensity threshold, f = 1.0; vertical gradient in fractional intensity threshold, g = 0.1; and head radius (in mm), r = 175 for most animals. If necessary, you can optimize these values per subject.
6. Data Analysis
Goal of the statistical analysis of the MR data is to determine the voxels which exhibit additional variance attributable to the drug challenge in a statistically robust manner. Various methodological approaches are available for this, even as numerable software packages. The choice you make is dependent on the availability of software and knowledge/experience at your lab and your specific research question. Here we give a suggested method as is used in our lab.
6.1
- Before analyzing the MRI data, determine a general linear model (GLM) to which the data will be fitted. This can be a simple square on-off model (off for pre-drug and on for post-drug infusion) or a specific model based upon the data. We have used the program Stimulate21 to determine a data-based GLM model.
- Perform a two-sample T-test (for example in Stimulate) on all baseline volumes vs. all post-challenge volumes. Optionally, leave out the first volume(s) and the volume during which the challenge is given, since those may not represent steady-state imaging. Subsequently, discriminate all voxels with more than a certain % change from baseline. We used all voxels with more than 1% change.
- Next, average the time course in all these voxels, which already gives you an impression of the shape of the model. In this way it can be determined if the challenge 1) has an immediate or delayed effect, 2) if and when the effect reaches a plateau and/or peak and, 3) if or when the effect declines again during the time course of the scan. Examples are shown in Figure 4A and 4B.
6.2
The next step is then to statistically test the raw 4D time series image of each animal against the previous established GLM model. For this, we used the FSL program FEAT (FMRI Expert Analysis Tool, v5.98)17,24. However, other fMRI analysis tools are available as well. Within the analysis tool, a first level analysis has to be set up. This requires the following steps:
- Make sure to use the same settings for each animal. You may chose to delete the first (two) volumes before analysis, since steady-state imaging may not be reached yet at that point. Set the TR; this is the time (in seconds) between the start of each successive volume. Since you are looking at effects which could last the entire scan time, there is no need to set a high or low pass filter.
- Spatially smooth the data in order to reduce noise and improve the signal to noise (SNR) ratio. We chose a FWHM kernel of 8 mm.
- Now run the desired GLM model on your data. This is your main explanatory variable (EV), i.e. the waveform you are testing your data against. The GLM that was determined based upon our own data can be seen in Figure 4C. There is also the possibility of adding additional confound EV’s such as movement parameters, low frequency noise (scanner drift) or even physiological parameters such as blood pressure to remove general physiological drug-effects.
Within FEAT: Use FILM prewhitening. Add temporal derivative. In the Contrasts & F-tests tab, set up a contrast. To convert a single EV into a Z statistic image, set its contrast value to 1. This gives you all voxels in which its time course can be significantly explained by the GLM. Setting the value to -1 will give the negative activation. - After carrying out the initial statistical test, the resulting statistic image needs to be thresholded to show which voxels or clusters of voxels are activated at a particular significance level. Multiple comparisons correction is needed due to the large number of brain voxels tested. The FSL program FEAT uses an automated cluster-based multiple comparisons correction based upon the GRF (Gaussian Random Field) theory25.
- Finally, the data should be spatially normalized to a reference image, in order to perform group statistics. First register the functional data to the animals brain-extracted anatomical image and then to the reference image. We used the stereotactic rat brain template described by Schwarz14 as a reference brain.
- After this, the first-level analyses of all animals can be combined in higher level (group) statistical analyses. This is highly dependent on your own study design and research questions.
6.3
After this, the first-level analyses of all animals can be combined in higher level (group) statistical analyses. This is highly dependent on your own study design and research questions.
6.4
Physiological drug responses can be coupled or correlated to the MR signal, if desired. See also section 6.2.3 about adding confound EV’s.
7. Representative Results
When the challenging drug (5 mg/kg i.v. fluoxetine) enters the vascular system, a clear physiological response should be visible in respiration rate (up) and blood pressure (down). These responses normalize on average within 5-10 min. In Figure 3 this drop in blood pressure is clearly visible.
The average signal time course should show a relatively stable baseline and a clear effect of the challenge. Preferably, there should be no challenge-independent drift in the signal. A representative example of an average signal time course can be seen in Figure 5A. Artifacts, such as respiration depression/failure or changes in anesthesia are often clearly visible in the signal. Respiratory depression will negatively affect the signal in the entire brain. This can be seen in Figure 5B.
After first level analysis, the activation pattern is expected to be mainly positive and located in specific regions only (i.e. cortical areas, hippocampus, hypothalamus and thalamus; see Figure 6A). If the whole brain is deactivated, this is often an indication of too deep anesthesia and/or oxygen shortage during scanning. An example of this can be seen in Figure 6B.
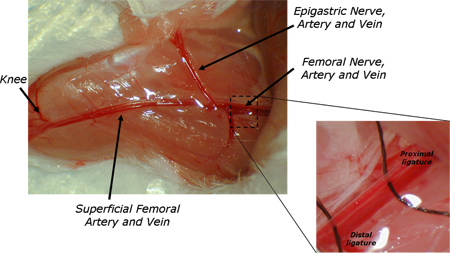
Figure 1. Location of placement of the cannulas in the femoral artery and vein.
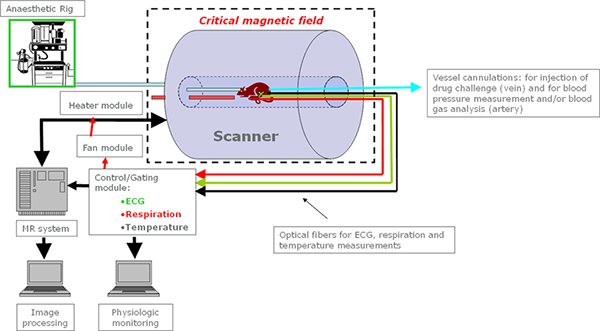
Figure 2. Schematic representation of the MRI setup; all the equipment needs to be non-ferromagnetic and is connected to a module system which allows gated acquisition of images avoiding interferences from motion due to breathing and /or heart beating. Body temperature is also regulated through a heating module to monitor and control the animal temperature during imaging. Click here to view larger image.
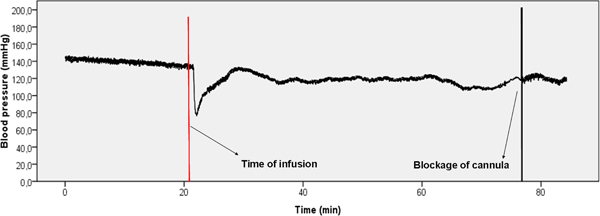
Figure 3. Representative example of blood pressure data. There is a clear drop in blood pressure visible directly after the start of the infusion (red bar). Normal values are reached again within 10 min. after the challenge administration.
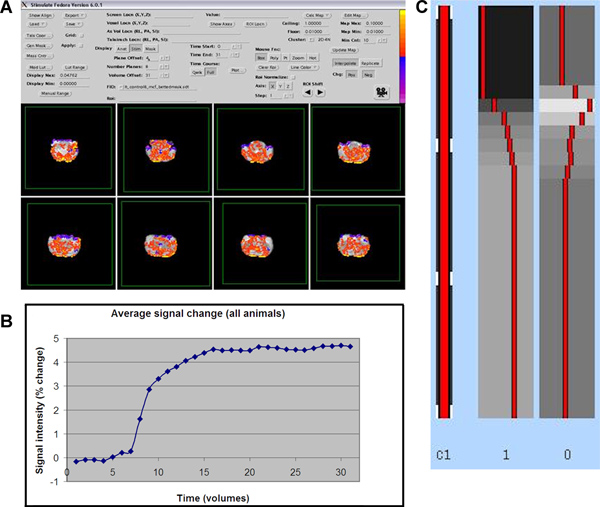
Figure 4. A) Expected activation pattern using the MRI analysis program Stimulate (red is positive activation, blue is negative activation). B) Average time course of all activated voxels (≥1% change from baseline) in all animals. C) Example of the resulting GLM model in FSL/FEAT. Click here to view larger figure.
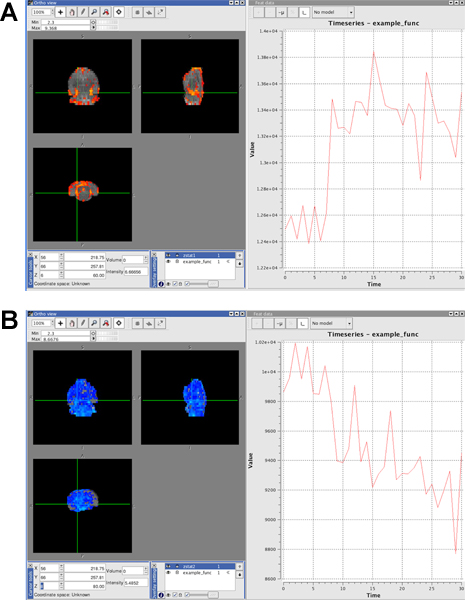
Figure 5.
- Example of positive activation. The time course in the activated voxels (red) is following roughly the shape of the GLM model. Infusion of the drug started around time point 8.
- Example of negative activation in entire brain after too deep anesthesia. The time course in the negatively activated voxels (blue) show a general decline in signal and no effect of the challenge is visible.
Click here to view larger figure.
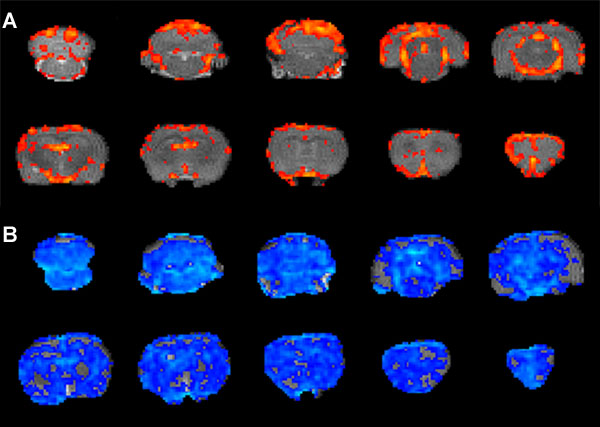
Figure 6.
- Expected activation pattern after first level analysis. Activation of clusters of voxels (red to yellow), only in specific brain areas.
- Example of ‘bad’ activation pattern. Whole brain negative activation (blue) in the same animal as in Figure 5B.
Discussion
5-HT phMRI is a promising tool to assess neurotransmitter function in animals in vivo. It visualizes the brain response to a 5-HT challenge with functional MR imaging. MRI has the great advantage to have a high spatial resolution and to not need the injection of contrast-agent or radio-labeled molecules thus avoiding the repetitive exposure to ionizing radiations. This technique is applicable in both human and animal subjects and therefore very suitable for translational research of neurotransmitter systems and psychiatric disorders. Its application is of course not limited to the 5-HT pathway and has already been used extensively to assess effects of dopaminergic drugs in both animals5,15 and humans22.
Nevertheless, phMRI in small animals remains challenging, as already pointed out in review articles by Martin and Sibson11 and Steward20. One of these challenges is the maintenance of stable physiological parameters during image acquisition. Most anesthetics can alter cardiovascular function and given that phMRI is critically dependent on cardiovascular/hemodynamic parameters it is essential to ensure that any hemodynamic changes are solely attributable to the given drug challenge. It is therefore vitally important that pCO2 levels remain constant during baseline acquisition. Mechanical ventilation can to help ensure physiological stability, and is often used in this type of experiments. We however chose to use free-breathing animals to leave open the possibility to perform longitudinal studies in the future. Instead, we extensively monitored (and altered) respiration rate and blood gas values to ensure physiological stability within the normal ranges before start of the functional scan and in this way to preserve stable vascular reactivity and thus T2*/T2 signal. Literature about the effects of general anesthetics on cerebral hemodynamics and metabolism is abundant20 and beyond the scope of this manuscript. We chose to use gas anesthesia with ±2% isoflurane in this specific protocol, because with inhalation anesthetics, the depth of anesthesia can be rapidly and easily controlled. This is important in our setup to ensure normal range stable pCO2 levels before start of the image acquisition. Isoflurane is the most commonly used inhalant anesthetic today and allows for rapid induction and recovery, which is important for longitudinal studies. It also produces minimal cardiovascular and respiratory depression and induces good relaxation of skeletal muscles.
Secondly, the intravenous administration of the challenging drug is more complicated in small animals than in humans. The surgery that is needed for the cannulation of the femoral artery and vein requires well-trained and experienced staff. Due to these invasive procedures it is at the moment mainly used in terminal procedures. However, non-invasive monitoring of blood homeostasis and tail vein injection could be used for longitudinal studies23.
In addition, there are some more general limitations to the technique, which are not specific for animal phMRI. Additionally, as pointed out by Martin and Sibson11, a potential confound of all fMRI studies is that it is assumed that the changes in brain activity evoked by the challenge reflect changes in neuronal activity rather than peripheral systemic effects. Especially in deeper brain structures, a relatively poor understanding of neurovascular coupling (relationship between neuronal activity changes and hemodynamic changes) remains. Studies of the kind performed by Logothetis 10 to determine neurovascular coupling in the cortex have not yet been performed in other parts of the brain. It is therefore unknown what an increase in BOLD signal in important structures such the striatum or amygdala is telling us about neuronal activity. The best we could say at this moment is that the brain region reacts to the given challenge and that depending on the treatment and/or conditions, we can monitor the significant changes of the brain reactivity. This can largely be verified by looking at both the MRI data and physiological responses. The general pattern of brain activation should be region specific and restricted to areas with, in this case, a high 5-HT innervation, and not as much a general vascular response. Also, a different temporal profile between vascular and hemodynamic changes is expected. Whereas the blood pressure changes return to their baseline values within several minutes, the effect of the drug on BOLD activation is in the case of fluoxetine visible until the end of the image acquisition and correspond to the know pharmacokinetic properties of this drug. Finally, the physiological responses of all animals should be similar in order to make inter-subject comparisons. Nonetheless, it is known that a neurogenic regulation of the local blood flow by 5-HT exist4. Therefore it can not be excluded that local changes of BOLD signal may attribute to vascular changes due to release of 5-HT at the proximity of vessels. Although these effects are not associated to local neuronal activation and can thus be considered as false positive results, it is also an index of the overall specific function of the 5-HT system (see also3).
Critical steps of this technique are therefore to monitor physiological responses extensively and to make sure that the physiological conditions of the animal are stable before and during the image acquisition. Also scanner conditions should be as stable as possible and exactly the same for each animal. Signal stability of your sequence should be checked and confirmed before start of your experiment. Furthermore, make sure to always have large enough statistical power, even with small subject groups. For a nice review on the experimental considerations of animal phMRI in general, see Steward 20 and for an additional example of an experimental protocol for pharmacological fMRI in rats and mice, see Ferrari5.
Possible modifications of technique described here are numerous. One could:
- using a different drug for 5-HT challenge, such as another SSRIs or 5-HT receptor (ant)agonists16,13,18,7 or even a double challenge in order to reveal underlying mechanisms of drug action6,19;
- use a different experimental setup, such as a different anesthesia regime, mechanical ventilation, blood-pool contrast agents instead of BOLD15, longitudinal studies (animal needs to be kept alive, so no invasive blood pressure/blood gas measurement and/or mechanical ventilation are possible), or even combinations with other (invasive) methods such as recording of neuronal activity using MR-compatible electrodes10 or PET/SPECT studies4;
- use different MRI data analysis methods such as the ‘p-block’ method of McKie12 or functional connectivity analysis15.
Which choices you make in the experimental setup is highly dependent on the possibilities of and/or the experience within your lab and the type of research question you would like to answer.
開示
The authors have nothing to disclose.
Acknowledgements
This work is funded by the Netherlands Organization for Scientific Research (NWO) (Veni no. 916.86.125), awarded to L. Reneman. The funder had no role in study design, data collection and analysis, decision to publish, or preparation of the manuscript. There are no conflicts of interest.
Materials
| Name of the reagent/equipment | Company | Catalogue number | コメント |
| Isoflurane | ABBOTT Abbott Laboratories Ltd.,Maidenhead, UK |
No B506 | Mix with medical air |
| Medical air | BOC Healthcare | ||
| Heating pad | Harvard apparatus | 507223F Complete Homeothermic Blanket System with Flexible Probe, Medium, 230 VAC, 50 Hz |
|
| Silk ligature | http://www.harvardapparatus.com/ | 2-0 black braided silk non-absorbable Cat Num 51-7631 |
|
| PE-50 Cannula | http://www.scientificlabs.co.uk/ | Portex Tubing PE 0.58×0.96mm | 0.58 ID 0.96 OD mm |
| Heparin sodium | Leo laboratories Ltd, Bucks., UK | Heparin sodium 1000IU/ml | 15 U/ml |
| Vetbond Tissue Adhesive | 3M | M Vetbond Tissue Adhesive | |
| Monitoring system | SA Instruments | http://www.i4sa.com Model 1025L monitoring system |
Monitors respiration and temperature |
| Pressure transducer | Biopac Systems Corp | BLOOD PRESSURE TRANSDUCER – TSD104A MP150 DATA ACQUISITION SYSTEM – WIN – MP150WSW |
Monitors blood pressure |
| RapidLab blood gas analyzer | Siemens Diagnostics | RAPIDLab 248/348 Systems | |
| 4.7T animal scanner | Agilent Technologies (previously Magnex) 4.7T frequency 199.845 MHz |
||
| MR compatible stereotactic bed | m2m Imaging Corp | Rat bed: PA Multi element AHS 50-72-1003/100 | |
| Coil | m2m Imaging Corp | Volume TH/Rx RQD1 72/112 200 |
|
| Fluoxetine Hydrochloride | Sigma-Aldrich | F-132 | 5mg/kg in saline |
参考文献
- Abramoff, M. D., Magelhaes, P. J., Ram, S. J. Image Processing with ImageJ. Biophotonics International. 11, 36-42 (2004).
- Anderson, I. M., McKie, S., Elliott, R., Williams, S. R., Deakin, J. F. Assessing human 5-HT function in vivo with pharmacoMRI. Neuropharmacology. 55, 1029-1037 (2008).
- Choi, J. K., Chen, Y. I., Hamel, E., Jenkins, B. G. Brain hemodynamic changes mediated by dopamine receptors: Role of the cerebral microvasculature in dopamine-mediated neurovascular coupling. Neuroimage. 30, 700-712 (2006).
- Cohen, Z., Bonvento, G., Lacombe, P., Hamel, E. Serotonin in the regulation of brain microcirculation. Prog. Neurobiol. 50, 335-362 (1996).
- Ferrari, L. A robust experimental protocol for pharmacological fMRI in rats and mice. J. Neurosci. Methods. 204, 9-18 (2011).
- Gozzi, A. Differential effects of antipsychotic and glutamatergic agents on the phMRI response to phencyclidine. Neuropsychopharmacology. 33, 1690-1703 (2008).
- Houston, G. C. Mapping of brain activation in response to pharmacological agents using fMRI in the rat. Magn Reson. Imaging. 19, 905-919 (2001).
- Jenkins, B. G., Sanchez-Pernaute, R., Brownell, A. L., Chen, Y. C., Isacson, O. Mapping dopamine function in primates using pharmacologic magnetic resonance imaging. J. Neurosci. 24, 9553-9560 (2004).
- Klomp, A. Lasting effects of chronic fluoxetine treatment on the late developing rat brain: age-dependent changes in the serotonergic neurotransmitter system assessed by pharmacological MRI. Neuroimage. 59, 218-226 (2012).
- Logothetis, N. K., Pauls, J., Augath, M., Trinath, T., Oeltermann, A. Neurophysiological investigation of the basis of the fMRI signal. Nature. 412, 150-157 (2001).
- Martin, C., Sibson, N. R. Pharmacological MRI in animal models: A useful tool for 5-HT research. Neuropharmacology. 55, 1038-1047 (2008).
- McKie, S. Neuronal effects of acute citalopram detected by pharmacoMRI. Psychopharmacology (Berl. 180, 680-686 (2005).
- Preece, M. A. Evidence that increased 5-HT release evokes region-specific effects on blood-oxygenation level-dependent functional magnetic resonance imaging responses in the rat brain. 神経科学. 159, 751-759 (2009).
- Schwarz, A. J. A stereotaxic MRI template set for the rat brain with tissue class distribution maps and co-registered anatomical atlas: application to pharmacological MRI. Neuroimage. 32, 538-550 (2006).
- Schwarz, A. J., Gozzi, A., Reese, T., Bifone, A. In vivo mapping of functional connectivity in neurotransmitter systems using pharmacological MRI. NeuroImage. 34, 1627-1636 (2007).
- Sekar, S. Neuroadaptive responses to citalopram in rats using pharmacological magnetic resonance imaging. Psychopharmacology (Berl). 213, 521-531 (2011).
- Smith, S. M. Advances in functional and structural MR image analysis and implementation as FSL. NeuroImage. 23, S208-S219 (2004).
- Stark, J. A., McKie, S., Davies, K. E., Williams, S. R., Luckman, S. M. 5-HT(2C) antagonism blocks blood oxygen level-dependent pharmacological-challenge magnetic resonance imaging signal in rat brain areas related to feeding. Eur. J. Neurosci. 27, 457-465 (2008).
- Stark, J. A., Davies, K. E., Williams, S. R., Luckman, S. M. Functional magnetic resonance imaging and c-Fos mapping in rats following an anorectic dose of m-chlorophenylpiperazine. NeuroImage. 31, 1228-1237 (2006).
- Steward, C. A., Marsden, C. A., Prior, M. J., Morris, P. G., Shah, Y. B. Methodological considerations in rat brain BOLD contrast pharmacological MRI. Psychopharmacology (Berl). 180, 687-704 (2005).
- Strupp, J. P. Stimulate: A GUI based fMRI Analysis Software Package. NeuroImage. 3, S607 (1996).
- Tomasi, D. Methylphenidate enhances brain activation and deactivation responses to visual attention and working memory tasks in healthy controls. Neuroimage. 54, 3101-3110 (2011).
- Woolrich, M. W. Bayesian analysis of neuroimaging data in FSL. NeuroImage. 45, S173-S186 (2009).
- Worsley, K. J., Jezzard, P., Matthews, P. M., Smith, S. M. Statistical analysis of activation images. Functional MRI: An Introduction to Methods. , (2001).

