Traction Cytometry Assay: A Method to Quantify Traction Force Exerted by Cancer Cells on ECM
Abstract
Source: Ali, M. Y., et al. Isolation of Primary Human Colon Tumor Cells from Surgical Tissues and Culturing Them Directly on Soft Elastic Substrates for Traction Cytometry. J. Vis. Exp. (2015).
This video describes the traction force microscopy assay. The assay determines the cellular traction of human colon cancer cells on the extracellular matrix present on soft elastic hydrogel having embedded fluorescent beads. The resultant displacement of fluorescent beads is measured using an appropriate software.
Protocol
1. Traction Force Microscopy Assay
- Warm 0.25% trypsin-EDTA/10% SDS solution at 37 °C in a water bath for 10 minutes before traction experiments start.
- Remove one gel (Functionalize PA gels and glass with ECM molecules, human fibronectin at a concentration of 50 µg/ml) from the cell culture incubator at a time and place on the fluorescent inverted microscope stage (32X magnification).
- Find a single cell in the field of view. Remove the Petri dish lid.
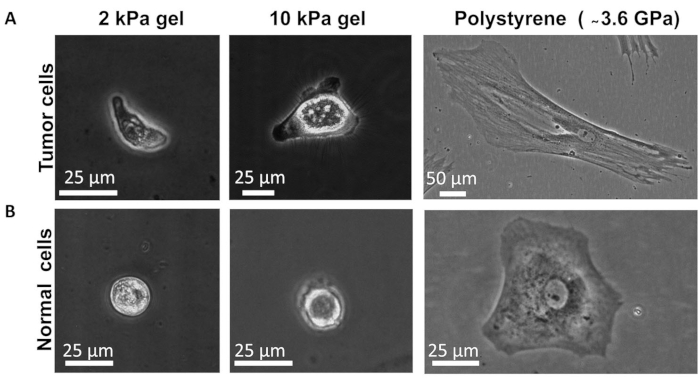
- Take a phase-contrast image of the cell (e.g., Figure 1).
- Switch the imaging mode to fluorescence and select the appropriate filter. Don't move the microscope stage or sample during this time.
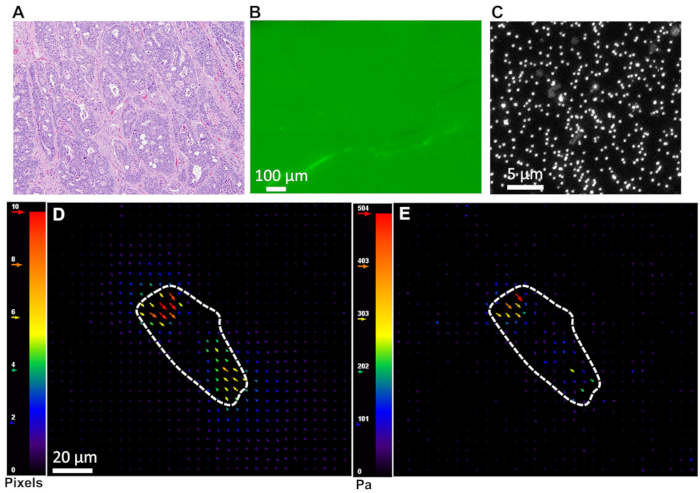
- Take an image of the fluorescent beads displaced by cellular traction (Figure 2C).
- Add 1 ml trypsin/SDS solution to the Petri dish to detach the cell from gel. Don't move the microscope stage or sample during this time. Also, take a control image of the cell to ensure complete removal from the gel.
- Take a reference (null force) image of the beads after the cell is removed.
- Repeat steps 1.2-1.8 for all other gels.
- Make an image stack using ImageJ from the two images acquired in steps 1.6 and 1.8 for each case. To generate the image stack, use the following sequence of commands in ImageJ after opening the images: Image → Stacks → Images to stack.
- To obtain the displacement field and traction, use ImageJ plugins following published methods. Obtain codes and detailed tutorials for these plugins using the following link: https://sites.google.com/site/qingzongtseng/imagejplugins.
- Align the images in the stack using the ‘Template Matching’ plugin. Use the following sequence of commands in ImageJ after opening the image stack generated in step 1.10: Plugins → Template Matching → Align Slices in Stack → OK. Save the image stack consequently. Use this new image stack in the following steps.
- Obtain the displacement field using the PIV (particle image velocimetry) plugin (Figure 2D). Use the following sequence of commands after opening the image stack saved in step 1.11.1: Plugins → PIV → Iterative PIV (Basic) → OK → Accept this PIV and output → Ok. Save the PIV output in the same directory as in the original image stack. Use this as input in the next step.
- Finally, use the FTTC (Fourier transform traction cytometry) plugin to obtain the traction map (Figure 2E). Use the following sequence of commands: Plugins → FTTC → Insert material properties, i.e., Young’s modulus and Poisson’s ratio of PA gel → OK → Select the PIV output file saved in step 1.11.2 → OK. Save FTTC results in the same directory as in the image stack and PIV output.
Representative Results

Figure 1. Successful primary human colon cell culture (both cancer and normal) on different stiffness gels and on polystyrene dish. Phase-contrast images show typical morphology of (A) Tumor cells and (B) Normal cells on different stiffness substrates.

Figure 2. (A) H & E staining confirming invasive adenocarcinoma. (B) Fibronectin staining reveals that gels are uniformly coated with ECM molecules. (C) Nanoscale beads embedded inside gel as fiduciary markers. (D) Representative displacement field generated by tumor cell on soft PA gel using PIV plugin in ImageJ as described in 1.11.2. (E) Traction stress exerted by tumor cells on soft gel corresponding to displacement field in (D) obtained via FTTC plugin in ImageJ as described in 1.11.3.
開示
The authors have nothing to disclose.
Materials
| PBS | Lonza | 17-516F | |
| Trypsin | Worthington | LS003736 | |
| Acrylamide | Sigma-Aldrich | A4058 | |
| N-methylenebisacrylamide (bis) | Sigma-Aldrich | M1533 | |
| Human fibronectin | BD biosciences | 354008 | |
| 0.1 µm fluroscent beads | Life technologies | F8801 | |
| 0.25% Trypsin-EDTA | Life technologies | 25200-056 | |
| 12 mm2 glass cover slips | Corning | 2865-12 |

