A Computer Vision System for the Assessment of Ice Cream Melting Behavior
Summary
Here, we present a protocol based on a computer vision system (CVS) to determine the melting behavior of multi-phase food systems.
Abstract
Melting behavior is one of the most important quality indices of ice cream. It is usually evaluated by gravimetric methods and expressed in terms of starting time and rate of melting. However, the aspect of ice cream during melting is also important because shape retention is linked to a good structure of the product. The protocol proposed here illustrates a computer vision system (CVS) that can be used to support the already existing gravitational methodology to calculate two new melting indices related to shape retention and melting rate. Pictures of ice cream during melting are taken every 15 min for a total of 90 min. Afterward, digital images are elaborated using a purposely developed image processing method to calculate ice cream area, height, and width. The ratio between height and width at each melting time, referred to the ratio at time 0 (Rt/R0), is an index of the shape retention of ice cream, while the area at the different melting times referred to the area at time 0 (At/A0) is related to the melting rate. This computer vision system allows the obtaining of highly sensitive and reliable results, and it can be applied not only to ice cream but also to different food matrices, such as whipped milk cream or egg albumen.
Introduction
Ice cream is a multi-phase system in which liquid, solid, and gas phases are strictly connected. The continuous liquid phase envelops air bubbles and ice crystals, and it contains partially crystallized fats, colloidal proteins, salts, sugars (eventually crystallized), and stabilizers. The ice cream composition varies depending on the local market requests and possible regulations. Although the processing technology affects the characteristics of the final ice cream, each constituent plays an important role in defining the product quality1. Melting behavior is one of the most important quality indices of ice cream, considering phenomena occurring both during consumption and in the mouth. With heat penetration into the ice cream, ice crystals melt, and water diffuses and mixes with the serum phase, which can drain through the remaining structure2. A fast-melting product is undesirable for comfortable eating but also for guaranteeing a higher heat-shock resistance. However, slow-melting products also indicate some defects in the formulation1. It is known that ice cream microstructure is responsible for melting properties3, but contrasting results have been published so far, showing that knowledge about the influence of microstructural factors on melting is still limited4. Thus, more studies are necessary to elucidate the meltdown mechanism, which is crucial also in the design of new formulations3.
Melting behavior is usually evaluated by gravimetric methods and expressed in terms of starting time and rate of melting5. A given portion of ice cream is placed on a wire mesh in a controlled temperature cabinet, and the weight of the melted product is registered. From the weight-time curve, three phases can be highlighted: the lag phase during which heat penetration occurs, the fast-melting phase with the dilute serum phase flowing through the ice cream structure at the maximum rate, and the stationary phase, where most of the product has dripped out2.
With the gravimetric method, slow- and fast-melting products can be recognized; however, the aspect of ice cream during meltdown is important too, because shape retention is linked to a good composition and structure of the product6. Thus, a procedure based on a computer vision system (CVS) can support the already existing gravitational methodology by allowing the study of the product's appearance during melting. CVSs can acquire numerous food attributes3 (e.g., size, weight, shape, texture, and color) with accurate details that cannot be observed by the human eye. Such systems are usually made of digital cameras and image processing software7. Indeed, a protocol based on CVSs includes two main steps: 1) image acquisition and 2) image processing. Various levels of image processing can be applied7, from the simplest to the more complex, such as deep-learning methods for Artificial Intelligence development8,9. Great attention has been recently paid to CVSs in the food sector, and a high number of applications have been developed for food safety inspection, food processing monitoring, foreign object detection, and other fields. They are fast, efficient, and non-destructive, thus representing valid tools to provide consumers with safe foods of high quality10.
In the field of ice cream, an image analysis method was suggested to study ice recrystallization by optical microscopy11. More recently, X-ray computed tomography images were processed to analyze the 3D microstructure of soft-porous matters, including ice cream3. However, the elaboration of simple digital Charge Coupled Device (CCD) images can present several advantages in terms of easiness of acquisition and rendering of the ice cream aspect as perceived by consumers. Some Authors show images of ice cream during melting12, but, to the best of our knowledge, the extraction of numerical indices from the images was reported for the first time by Moriano and Alamprese13.
Therefore, the protocol here proposed, based on the work by Moriano and Alamprese13, illustrates a simple CVS that can be applied to support the already existing gravitational methodology for the study of ice cream melting behavior. A block diagram of the proposed method is illustrated in Figure 1. The use of such a system allows the calculation of two melting indices related to shape retention and the melting rate. In particular, the paper describes for the first time the detailed experimental setup and procedure for digital image acquisition during ice cream meltdown and the image processing steps. Besides, the results obtained from ice creams produced with different sweeteners (i.e., sucrose, sucromalt, and erythritol) are reported to show the potential of the method.
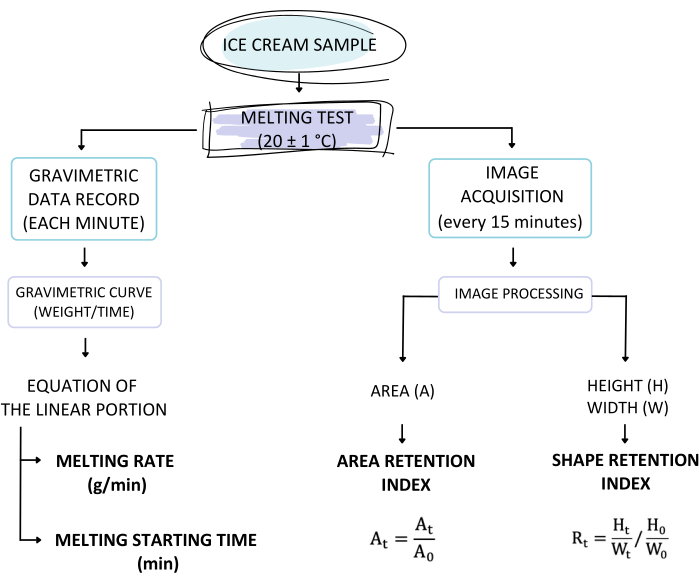
Figure 1: Block diagram of the proposed methodologies. Summary of the general steps for the proposed Computer Vision System and the gravimetric method for studying ice cream melting behavior. Please click here to view a larger version of this figure.
Protocol
1. Experimental setup and procedures for melting trials
- Ice cream sample preparation
- Choose transparent cups of fixed volume and shape, with lids. Cut two long stripes of baking paper about 2 cm in width, and, with the help of paper tape, fix them to the inside walls of the cup to form a cross at the bottom. Start to fill the cup with the ice cream sample by using a spatula.
NOTE: Before starting, be sure that the ice cream has a temperature in the range of -7 °C to -12 °C so that it can be spread inside the cup. Pay attention not to create empty spaces during the cup filling by regularly checking through the cup transparency. - When the cup is full, gently pull away the excess of ice cream with the spatula, creating a smooth and flat surface. Close the cup with its lid and store the sample at -30 °C for at least 24 h.
- Before the analysis, condition the sample at -16 °C for 24 h.
- Choose transparent cups of fixed volume and shape, with lids. Cut two long stripes of baking paper about 2 cm in width, and, with the help of paper tape, fix them to the inside walls of the cup to form a cross at the bottom. Start to fill the cup with the ice cream sample by using a spatula.
- Setup of the melting trial and image acquisition
- Set a thermostatic cabinet at 20 ± 1 °C. Insert a digital scale in the cabinet and connect it to a computer with software for the registration of weight as a function of time.
- Place a graduated cylinder on the digital scale and reset the weight. Over the cylinder, place a hanging funnel to help collect the melted ice cream. The setup of the melting trial is shown in Figure 2.
NOTE: The funnel should be suspended over the cylinder to avoid exceeding the full scale of the digital scale. To avoid instability of the funnel during the sample positioning at the beginning of the analysis, it should be fixed to the cabinet shelf over the cylinder. - Set a camera with a tripod in front of the cabinet door at a defined height and distance to have the best reliable framing of the sample.
NOTE: Be sure that the camera is well aligned with the ice cream sample to avoid parallax errors when processing the image.
- Melting trial
- Prepare a metal wire-mesh screen equipped with a size reference. Take the ice cream cup from the freezer, remove the lid, and start gently to put a spatula between the ice cream and the cup walls to detach the sample from the container.
NOTE: The ice cream cup must be removed from the freezer only when the previous steps (until step 1.2.3) are completed to avoid meltdown before data registration. - While detaching the ice cream sample from the cup walls, keep the baking paper stuck on the surface of the ice cream.
- When the whole ice cream sample has been detached from the cup walls, gently pull the baking paper ends to extract the ice cream and lay it down on the metal wire-mesh screen along with the baking paper stripes. Then, carefully remove the baking paper stripes from the ice cream surface.
NOTE: Pay attention not to alter the ice cream shape when performing steps 1.3.1-1.3.3. - Place the metal wire mesh screen with the ice cream sample on the funnel in the cabinet. Using the digital camera on the tripod, take the first picture (t0) of the ice cream sample with the cabinet door open, paying attention to also shoot the size reference. Close the cabinet door and start recording the gravimetric data every minute with the software connected to the scale.
NOTE: Do not use flash to avoid shadows in the image, and use a very contrasting background to improve ice cream segmentation. Check the focus of the acquired picture; if the image is out of focus, take immediately a new one. - Record the gravimetric data for 90 min (one registration per minute) and take a picture of the ice cream sample (see step 1.3.4) every 15 min (for a total of 7 pictures).
- Prepare a metal wire-mesh screen equipped with a size reference. Take the ice cream cup from the freezer, remove the lid, and start gently to put a spatula between the ice cream and the cup walls to detach the sample from the container.
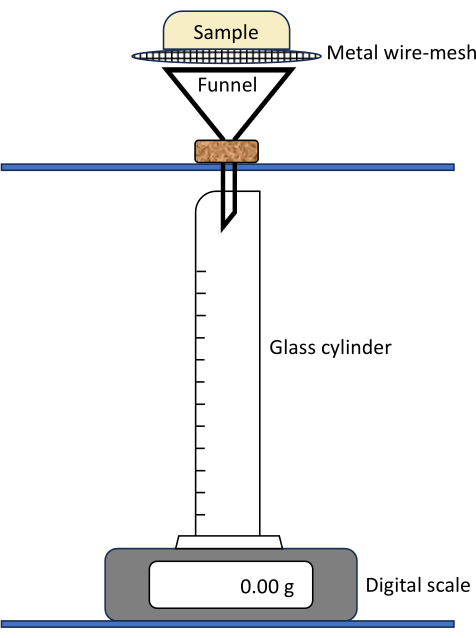
Figure 2: Melting test setup. The figure shows how to set up the melting trial in the thermostatic cabinet: Put a graduated glass cylinder on a digital scale to collect and weigh the melted ice cream. The ice cream sample is laid on a metal wire mesh screen on a funnel suspended over the cylinder. Please click here to view a larger version of this figure.
2. Image processing for melting indexes' calculation
- Image processing
- Download the digital images from the camera memory card and save them as .tiff or .jpg files without compression.
- Use the File > Open commands of the image analysis software to open the ice cream images. Start processing the first image (t0), correcting the rotation if needed (commands: Edit > Rotate).
- Use the size reference acquired in each picture (see steps 1.3.1. and 1.3.4.) to spatially calibrate the image (commands: Measure > Calibration > Spatial > Image), converting pixels in millimeters (Supplementary Figure 1).
- Select the rectangular area of interest (AOI), including the ice cream sample and avoiding the edge of the metal wire mesh screen (commands: Edit > New AOI > Rectangular). Crop the AOI and convert it into a grey scale (color depth, 8) using the commands Edit > Covert to > Grey Scale 8 (Supplementary Figure 2).
- Apply the Best Fit filter that automatically adjusts brightness and contrast (commands: Enhance > Equalize > Best Fit).
- Go to the Measure > Count/Size window of the software and open the Measure window to select the following parameters: Area, Box Height, and Box Width. Then click OK to close this window (Supplementary Figure 3).
- Select the manual measurement (flag Manual in the Count/Size window) and click on Select Ranges to set the histogram values to segment the bright shape of the ice cream exactly. Close the Segmentation window (Supplementary Figure 4).
- Click on Count in the Count/Size window of the software to measure the three parameters selected in step 2.1.6. If bright objects other than the ice cream sample are counted, use an area threshold to filter the objects (commands: Measure > Select measurements > Area; adjust start and end ranges). View the results of measurement by clicking View > Measurement Data (Supplementary Figure 5). Use File > Data to Clipboard to copy the measurement results and paste them into a spreadsheet of data management software.
- Repeat steps from 2.1.2 to 2.1.8 for each image collected during the ice cream meltdown.
- Melting indexes evaluation
NOTE: From now on, the size parameters measured from the ice cream images will be indicated as follows: A, area; H, box height; W, box width (Supplementary Figure 6).- By using the H and W data calculated in the previous step 2.1 at the different times t during melting (0 min, 15 min, 30 min, 45 min, 75 min, and 90 min), calculate the shape retention index (Rt) according to equation 1:
 (1)
(1) - According to equation 2 and equation 3, refer R and A data calculated at each time to the corresponding index at time 0 (R0 and A0) and plot the obtained results as a function of time as shown in Figure 3A, B. Trend of At as a function of time is related to the melting rate of ice cream.
 (2)
(2)
 (3)
(3)
- By using the H and W data calculated in the previous step 2.1 at the different times t during melting (0 min, 15 min, 30 min, 45 min, 75 min, and 90 min), calculate the shape retention index (Rt) according to equation 1:
Supplementary Figure 1: Image spatial calibration. (A) Go to the window Measure > Calibration > Spatial of the image analysis software. Select New, then flag Image to open the Scaling window. The reference length in the unit to convert pixels (e.g., millimeters) is indicated. (B) Carefully overlap the green bar with the reference portion corresponding to the indicated length and click OK. Please click here to download this File.
Supplementary Figure 2: Cropping AOI and converting it into a grayscale. (A) Conversion of the Area of Interest (AOI) into the grayscale and (B) the resulting image. Please click here to download this File.
Supplementary Figure 3: Selection of the parameters to be measured. In the Select Measurement window, the parameters to be measured can be selected; for the ice cream meltdown evaluation, area, box width, and box height must be selected. Please click here to download this File.
Supplementary Figure 4: Segmentation of the ice cream sample. In the “Segmentation” window it is possible to select the histogram ranges to be considered to cover exactly the area of the ice cream shape. Please click here to download this File.
Supplementary Figure 5: Filtering objects and the Count function. The red lines highlight the recognized bright objects. By applying the count function and opening the “View, Measurement data” window, the results of the selected parameters will be shown (A). To filter only the ice cream shape, it is possible to select a minimum and a maximum area range in the “Select Measurement” window, thus counting only the parameters of one object (B). Please click here to download this File.
Supplementary Figure 6: Shape retentionindex (R). Box height (Ht, red dotted line) and box width (Wt, black solid line) used for the shape retention index (R) calculation are shown. Please click here to download this File.
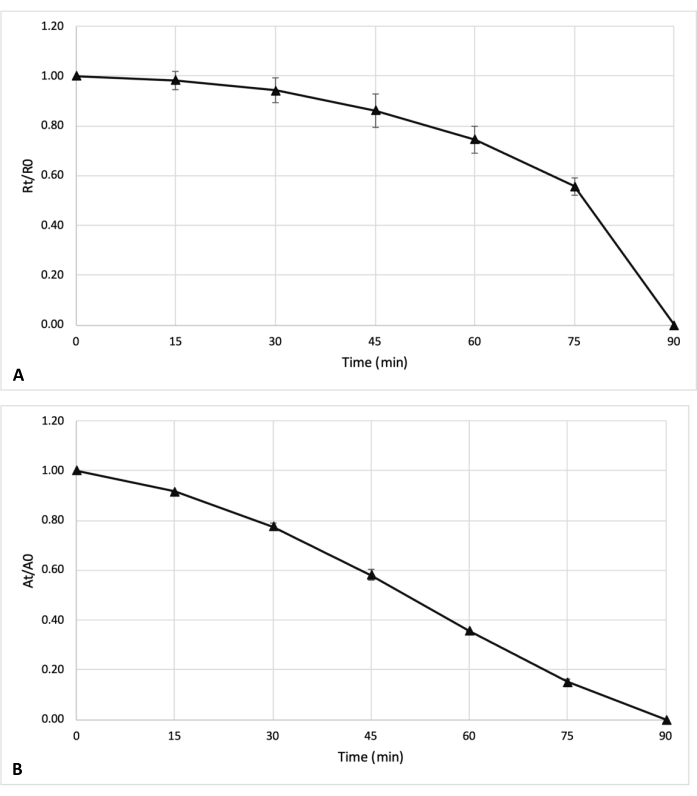
Figure 3: Shape and area retention curves. Example of an ice cream (A) shape and (B) area retention curves, in which Rt/R0 and At/A0 average values are plotted over time; error bars correspond to the standard deviation values obtained by the analysis replicates. Please click here to view a larger version of this figure.
3. Elaboration of gravimetric data
- At the end of the melting trial (90 min), save the spreadsheet with the weight of the melted sample (grams) per each minute of the analysis obtained by the software connected to the digital scale.
- Open the weight spreadsheet in a data management software to create a plot of the melted weight (grams) as a function of time (minutes), thus obtaining the melting curve of the ice cream sample.
- Select data in the linear portion of the melting curve and calculate the least squares regression line, registering equation 4 and the regression coefficient (R2).
 (4)
(4) - The slope value of the regression line (m) is the ice cream melting rate (grams/minute). Calculate the starting time of melting (ts; minute) as the x-intercept (when y = 0) as follows:
 (5)
(5)
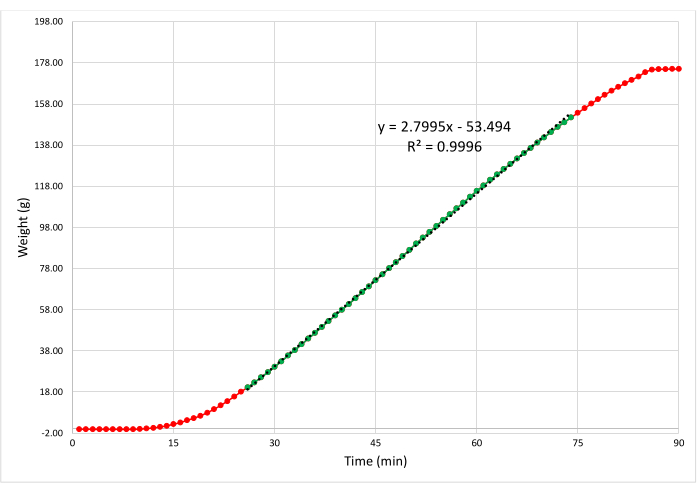
Figure 4: Gravimetric curve. Example of an ice cream melting curve obtained by the gravimetric method. The original curve is shown in red; the selected series of data in the linear portion are shown in green; the calculated regression line is shown in black dots. The equation and the coefficient of determination (R2) of the regression line are also shown. Please click here to view a larger version of this figure.
NOTE: To have reliable results to be statistically analyzed, replicate the whole procedure of melting trial and image processing at least three times for each sample.
Representative Results
As an example of the proposed CVS outputs, results of meltdown analyses for three different ice cream formulations are shown, compared with data obtained from the gravimetric method. In particular, the melting behavior of ice creams made with different sweeteners (i.e., sucrose, sucromalt, and erythritol) was studied.
Table 1 and Figure 5A show the results of the shape retention index (Rt/R0) for the three ice cream samples during melting. Similar shape retention was observed for all samples until 45 min; then, the sample made with sucrose lost its shape faster than the other products, resulting in a significantly lower Rt/R0 according to the one-way analysis of variance (ANOVA), followed by the Least Significant Difference (LSD) test (p < 0.05). Only the sample containing erythritol kept its shape until the end of the trial, giving measurable Rt/R0 values.
| SUCROSE | SUCROMALT | ERYTHRITOL | ||||
| Time (min) | At/A0 | s.d. | At/A0 | s.d. | At/A0 | s.d. |
| 0 | 1.00 | – | 1.00 | – | 1.00 | – |
| 15 | 0.91a | 0.01 | 0.93a | 0.02 | 0.92a | 0.04 |
| 30 | 0.76a | 0.04 | 0.82a | 0.02 | 0.84a | 0.04 |
| 45 | 0.56a | 0.04 | 0.66ab | 0.02 | 0.74b | 0.03 |
| 60 | 0.32a | 0.01 | 0.46b | 0.02 | 0.62c | 0.01 |
| 75 | 0.13a | 0.01 | 0.24b | 0.02 | 0.52c | 0.02 |
| 90 | n.d. | – | n.d. | – | 0.40 | 0.01 |
| n.d., not detectable | ||||||
Table 1: Mean and standard deviation values of shape retention indices for the three ice cream samples produced with different sweeteners. Different lowercase letters in the same row indicate mean values significantly different (p < 0.05).
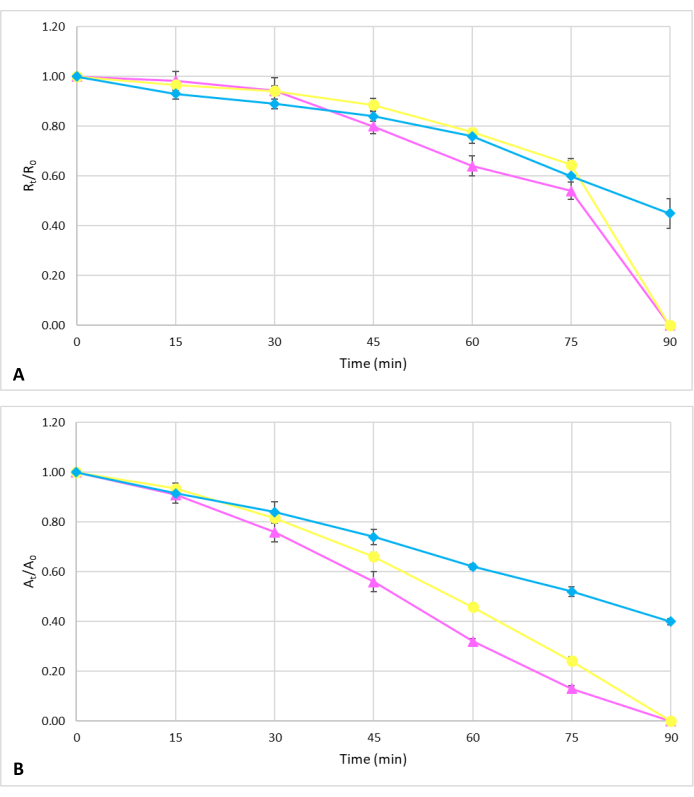
Figure 5: Shape and area retention curves for the three ice cream samples produced with different sweeteners. (A) Shape and (B) area retention curves. The pink line represents the sucrose sample, considered as a reference; the yellow line represents the sucromalt sample, and the blue line represents the erythritol sample. Please click here to view a larger version of this figure.
The sample with erythritol also showed a lower meltdown rate, as evidenced by the At/A0 melting indices (Table 2 and Figure 5B). From 45 min on, the erythritol sample showed the significantly (p < 0.05) highest area retention, followed by the ice creams containing sucromalt and sucrose, respectively.
| SUCROSE | SUCROMALT | ERYTHRITOL | ||||
| Time (min) | Rt/R0 | s.d. | Rt/R0 | s.d. | Rt/R0 | s.d. |
| 0 | 1.00 | – | 1.00 | – | 1.00 | – |
| 15 | 0.98a | 0.04 | 0.97a | 0.01 | 0.93a | 0.02 |
| 30 | 0.94a | 0.05 | 0.94a | 0.02 | 0.89a | 0.02 |
| 45 | 0.80a | 0.03 | 0.89a | 0.02 | 0.84a | 0.02 |
| 60 | 0.64a | 0.04 | 0.78b | 0.01 | 0.76b | 0.03 |
| 75 | 0.54a | 0.03 | 0.65a | 0.01 | 0.60a | 0.07 |
| 90 | n.d. | – | n.d. | – | 0.45 | 0.06 |
| n.d., not detectable | ||||||
Table 2: Mean and standard deviation values of area retention indices for the three ice cream samples produced with different sweeteners. Different lowercase letters in the same row indicate mean values significantly different (p < 0.05).
The results were also confirmed by the gravimetric analysis, whose data are reported in Table 3 in terms of melting starting time (tS) and melting rate (grams/minute). However, in this case, no significant differences were found applying the ANOVA (p > 0.05).
| SUCROSE | SUCROMALT | ERYTHRITOL | ||||
| mean | s.d. | mean | s.d. | mean | s.d. | |
| ts (min) | 15.3a | 1.4 | 16.4a | 1.4 | 17.2a | 2.6 |
| melting rate (g/min) | 2.67a | 0.26 | 2.29a | 0.09 | 1.96a | 0.41 |
Table 3: Mean and standard deviation values of melting indices calculated by the gravimetric methods for the three ice cream samples produced with different sweeteners. ts, melting starting time. Different lowercase letters in the same row indicate mean values significantly different (p < 0.05).
Figure 6 shows some processed (step 2.1) pictures acquired during melting trials (step 1.3) of the three ice cream samples; it is possible to notice the good shape retention of all samples and the lowest melting rate of ice cream made with erythritol, which was not completely melted after 90 min.
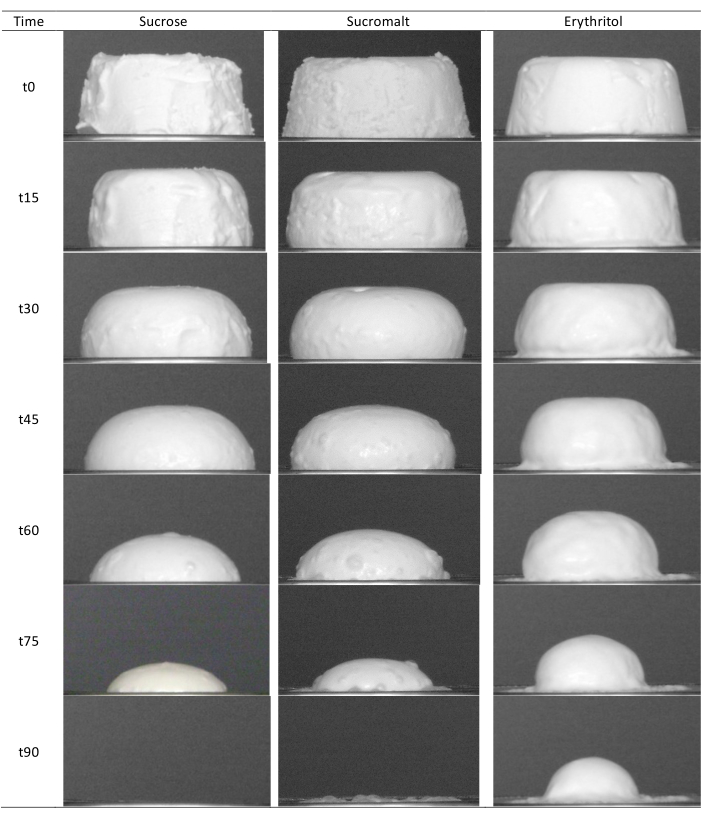
Figure 6: Meltdown of the three ice cream samples. Pictures acquired every 15 min during the meltdown of the three ice cream samples produced with different sweeteners. Processed images of the three ice cream samples during melting. Please click here to view a larger version of this figure.
Discussion
The proposed CVS allows the calculation of the shape and area retention indexes of ice cream samples during melting, besides visualizing the melting process. It can be coupled with the traditional gravimetric method applied to assess the melting behavior of ice cream5, to obtain results related to the aspect of the ice cream. This is very important because consumers evaluate its quality also based on the visual appearance of the product, and the ability to keep the shape during melting is linked to the composition and structure of ice cream1,3. The application of this system in food industries can improve quality control as well as research and development of new formulations.
The example of results obtained for the meltdown of three ice cream samples different for the sweeteners used demonstrated that the proposed CVS is sensitive to the different compositions (Table 1 and Table 2), even more than the gravimetric method, which was not able to highlight significant differences among samples (Table 3). The sensitivity of the shape retention index to ice cream formulation was also demonstrated in our previous works13,14,15,16. Due to the high sensitivity of the proposed method, it can even substitute the gravimetric procedure.
Apart from the ice cream sample preparation, the most critical steps in the developed CVS are related to good image capture and segmentation7. Referring Rt and At data to the initial values calculated at time 0 prevents possible misleading results due to different experiments set up among replicates. However, parallax errors during image acquisition could result in an overestimation of the sample area during melting, especially if the images collected in a single trial are not consistent due to a position change of the camera from one acquisition to the other. Thus, great attention should be paid to setting the image acquisition procedure, being sure that the metal wire-mesh screen with the sample on top is perfectly aligned with the camera objective, and carefully defining and securing the camera position in front of the thermostatic cabinet. Similarly, bad image segmentation can lead to over- or under-estimation of the ice cream area, but also of H and W, resulting in meaningless shape retention indices. In this case, the higher source of error is represented by possible spikes at the edge of the ice cream portion placed on the wire-mesh, or bubbles appearing on the surface of the ice cream during melting (Figure 7), which must be removed from the bright shape before measuring box area and box W and H. This can be troubleshot by using the Split Object function of the image analysis software. A high-contrasting background is also useful for better image segmentation7. The background color should be chosen based on the color of the ice cream sample, and high color saturation is desirable for better contrast.
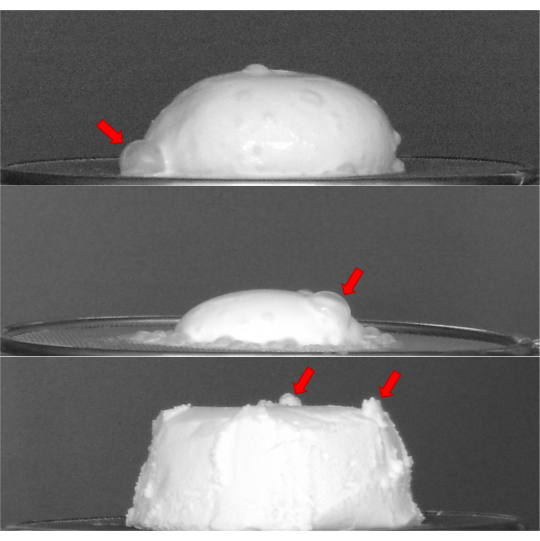
Figure 7: Possible sources of error in ice cream shape segmentation. The red arrows indicate possible spikes and bubbles on the ice cream shape that can lead to a wrong calculation of area, height, and width. Please click here to view a larger version of this figure.
If the images are well collected and processed, the CVS is even more sensitive and precise than the gravimetric methodology. Indeed, in the shown examples, the coefficients of variation for the gravimetric analyses ranged between 4% and 20%, making all the average data not significantly different (ANOVA, p > 0.05). On the contrary, for the CVS indices, the coefficient of variation values ranged from 0.1% to 13%, revealing significant differences among the three ice cream samples during melting (Table 1 and Table 2). The reduction in melting rate caused by erythritol is probably related to the formation of amorphous sugar crystals during ice cream freezing and the lower solubility of this sweetener compared to sucrose and sucromalt, which accounts for a higher amount of frozen water in the final product13. Other successful applications of the CVS proposed here can be found in our previous studies13,14,15,16.
When a good standardization of the image processing procedure is achieved, automatic image processing can be set using the Macro-Recording function of the image analysis software, thus making the elaboration process much faster. Of course, an accurate data revision by the operator is always needed to avoid artifacts and wrong data. Moreover, elaboration of the shape and area retention curves can be performed to calculate kinetics parameters and substitute the gravimetric method.
The protocol can also be applied to other food products for which the melting rate and shape retention index are important, such as mousses and foams (e.g., whipped milk cream and egg albumen). The most important point is the self-standing of the products, whereas temperature during melting trials can be adapted to the specific product.
Disclosures
The authors have nothing to disclose.
Materials
| Cabinet | Cavallo s.r.l. | FTX700 | Location for the melting test |
| Digital camera | Sony Group Corp | DSC-S650 | |
| Digital scale | Gibertini Elettronica | EU-C 4002 LCD | |
| ImagePro Plus 7.0 | Media Cybernetics, Inc | N/A | Image analysis elaboration software |
| Microsoft Excel | Microsoft | N/A | Data and graphical elaboration |
| Scalecom | Gibertini Elettronica | N/A | Digital scale software acquisition |
| Tripod | Manfratto | #055 |
References
- Marshall, R. T., Arbuckle, W. S. . Ice Cream. , (1996).
- Goff, H. D., Hartel, R. W. . Ice Cream. , (2013).
- Metilli, L., et al. Investigating the microstructure of soft, microporous matter with synchrotron X-ray tomography. Materials Characterization. 180, 111408 (2021).
- Liu, X., Sala, G., Scholten, E. Structural and functional differences between ice crystal-dominated and fat network-dominated ice cream. Food Hydrocolloids. 138, 108466 (2023).
- Alamprese, C., Foschino, R., Rossi, M., Pompei, C., Savani, L. Survival of Lactobacillus johnsonii La1 and influence of its addition in retail-manufactured ice cream produced with different sugar and fat concentrations. International Dairy Journal. 12 (2-3), 201-208 (2002).
- Alamprese, C., Foschino, R. Technology and Stability of Probiotic and Prebiotic Ice Cream. Probiotic and Prebiotic Foods: Technology, Stability and Benefits to Human Health. , (2011).
- Golnabi, H., Asadpour, A. Design and application of industrial machine vision systems. Robotics and Computer-Integrated Manufacturing. 23 (6), 630-637 (2007).
- Patel, C., et al. DBGC: Dimension-based generic convolution block for object recognition. Sensors. 22 (5), 1780 (2022).
- Bhatt, D., et al. CNN variants for computer vision: History, architecture, application, challenges and future scope. Electronics. 10 (20), 2470 (2021).
- Zhu, L., Spachos, P., Pensini, E., Plataniotis, K. N. Deep learning and machine vision for food processing: A survey. Current Research in Food Science. 4, 233-249 (2021).
- Donhowe, D. P., Hartel, R. W. Recrystallization of ice in ice cream during controlled accelerated storage. International Dairy Journal. 6 (11-12), 1191-1208 (1996).
- Velásquez-Cock, J., et al. Influence of cellulose nanofibrils on the structural elements of ice cream. Food Hydrocolloids. 87, 204-213 (2019).
- Moriano, M. E., Alamprese, C. Honey, trehalose and erythritol as sucrose-alternative sweeteners for artisanal ice cream. A pilot study. LWT-Food Science & Technology. 75, 329-334 (2017).
- Loffredi, E., Moriano, M. E., Masseroni, L., Alamprese, C. Effects of different emulsifier substitutes on artisanal ice cream quality. LWT-Food Science & Technology. 137, 110499 (2021).
- Loffredi, E., Alamprese, C. Optimisation of a blend of emulsifier substitutes for clean-label artisanal ice cream. LWT-Food Science & Technology. 173, 114338 (2023).
- Moriano, M. E., Alamprese, C. Organogels as novel ingredients for low saturated fat ice creams. LWT-Food Science & Technology. 86, 371-376 (2017).

