Mitochondrial Ca2+ Retention Capacity Assay and Ca2+-triggered Mitochondrial Swelling Assay
Summary
This protocol aims to describe a method to examine the Ca2+ retention capacity and Ca2+– triggered mitochondrial swelling of isolated mitochondria of SH-SY5Y cells step-by-step.
Abstract
The production of ATP by oxidative phosphorylation is the primary function of mitochondria. Mitochondria in higher eukaryotes also participate in cytosolic Ca2+ buffering, and the ATP production in mitochondrial can be mediated by intramitochondrial free Ca2+ concentration. Ca2+ retention capacity can be regarded as the capability of mitochondria to retain calcium in the mitochondrial matrix. Accumulated intracellular Ca2+ leads to the permeability of the inner mitochondrial membrane, termed the opening of mitochondrial permeability transition pore (mPTP), which leads to the leakage of molecules with a molecular weight less than 1.5 kDa. Ca2+-triggered mitochondria swelling is used to indicate the mPTP opening. Here, we describe two assays to examine the Ca2+ retention capacity and Ca2+-triggered mitochondrial swelling in isolated mitochondria. After certain amounts of Ca2+ are added, all steps can be completed in one day and recorded by a microplate reader. Thus, these two simple and effective assays can be adopted to assess the Ca2+-related mitochondrial functions.
Introduction
Mitochondria are the main cellular organs to produce nearly 95% of the ATP used in the mammalian cells by oxidative phosphorylation. It is reported that the sequestered micromolar concentration of Ca2+ by mitochondria, the presence of ADP, and inorganic phosphate can be used to phosphorylate ADP to synthesis ATP1. When the concentration of cytosolic Ca2+ goes above a threshold, mitochondria can uptake Ca2+ rapidly and efflux it slowly. Thus, the functioning mitochondria can influx the increased cytosolic Ca2+. Irrelevant to the participation in the oxidative phosphorylation, the mitochondrial Ca2+ also take part in the cytosolic calcium signals and activate the mitochondrial apoptotic mechanism by inducing the opening of the mPTP in the inner mitochondrial membrane2. It has been widely recognized that abnormal elevation of intracellular Ca2+ can induce mitochondrial massive swelling by opening the mPTP3. Thus, this protocol aims to assess the mitochondrial function by quantifying the mitochondrial Ca2+ retention capacity and Ca2+-trigged mitochondrial swelling.
Ca2+ retention capacity is the measurement of the ability of mitochondria to uptake cytosolic calcium. Mitochondria can buffer the cytosolic free calcium and regulate calcium-dependent cellular processes by calcium uptake in the form of inactive precipitates. Impaired Ca2+ retention capacity occurs in stress phenomena associated with energy limitation and even neurodegenerative diseases4,5. Isolated mitochondria or digitonin-permeabilized cells can be used to identify the Ca2+ retention capacity, and the elevated ability to accumulate Ca2+ by isolated mitochondria with the additonal glutamate and malate is not effected by the mitochondrial isolation procedure6. A titrated amount of digitonin should be used to permeabilize the plasma membranes of different cell types. The hexapotassium salt of Ca2+-binding green fluorescent dye, a Ca2+-sensitive cell-impermeant visible light-excitable indicator, has been widely used7. Ca2+-binding green fluorescent dye is a low-affinity indicator and used to show that intracellular free Ca2+ concentrations continue to rise during prolonged (5 min) stimulations8. This method was less sensitive than the radioactive filter technique but was greatly simplified. The additional Ca2+ elevates calcium green fluorescence and the Ca2+ uptake by mitochondria returns the fluorescence to baseline. Sequential additions of Ca2+ were made until the mitochondria failed to uptake extramitochondrial Ca2+ 9. A fluorescence microplate reader can be used to continuously report the calcium green fluorescence.
After Ca2+ accumulation, mitochondria depolarized, released Ca2+ into the medium, and began to swell. Ca2+-triggered mitochondria swelling is used to indicate the mPTP opening. Electron microscopy and the decrease in light absorbance at 540 nm can be used to measure the Ca2+-triggered mitochondrial swelling10,11. Mitochondria volume can be directly determined by forward angle light scattering12, where decreases in the absorbance reflect passive swelling of the mitochondrial matrix.
Here, we illustrate the methodology to examine the mitochondrial Ca2+ retention capacity and Ca2+-triggered mitochondrial swelling in isolated mitochondria from SH-SY5Y cells.
Protocol
1. Isolation of Mitochondria
NOTE: All solutions and equipment should be precooled to 0 – 4 °C and kept on ice.
- Seed about 3 x 10⁶ SH-SY5Y cells per 10 cm cell culture dish. Culture cells in high-glucose Dulbecco's modified Eagle medium with 10% fetal bovine serum, penicillin (100 U/mL)-streptomycin (100 µg/mL). Maintain at 37 °C in an incubator containing 5% CO2 overnight.
NOTE: At least 1 – 2 x 10⁷ SH-SY5Y cells are needed for each isolation assay. - Remove the medium and wash the cells with about 1 mL of ice cold PBS in a 10 cm cell culture dish 3 times.
- Add new 1 mL of ice cold PBS into 10 cm cell culture dish and scrape the adherent cells into a new 1.5 mL tube. Centrifuge at 800 x g for 10 min at 4 °C.
- During the centrifugation, prepare 5 mL mitochondrial isolation buffer (250 mM sucrose, 10 mM HEPES(4-(2-hydroxyethyl)-1-piperazine ethanesulfonic acid), 10 mM KCl, 1.5 mM MgCl2, 1 mM EDTA) supplemented with 50 μL of protease inhibitors stock solution (100x concentration; 1 EDTA-free tablet dissolved in 500 µL of ddH2O).
- Remove the supernatant and resuspend the pellet with 1 mL of mitochondrial isolation buffer. Incubate the 1.5 mL tube on ice for 30 min.
- Lyse the suspended cells with a glass homogenizer (15 – 25 strokes) up and down manually on ice.
NOTE: Make sure there are no bubbles when cells are homogenized. Count the intact cells and bared nuclei by microscope visually and confirm that >90% cell breakage has occurred. - Transfer the homogenate into a 1.5 mL tube and centrifuge at 1,000 x g for 5 min at 4 °C to remove the debris (nuclei and remaining intact cells).
- Transfer the supernatant into a new 1.5 mL tube and centrifuge at 1,000 x g for 5 min 4 °C.
- Transfer the supernatant to a new tube and centrifuge at 14,000 x g for 15 min 4 °C.
- Remove the supernatant and resuspend the pellet containing mitochondria with 1 mL of mitochondrial isolation buffer.
- Centrifuge the solution for 15 min at 14,000 x g 4 °C to precipitate the mitochondria.
- The resulting mitochondria pellet must be kept on ice and resuspended in 50 – 100 μL KCl media (125 mM KCl, 2 mM K2HPO4, 1 mM MgCl2, 20 mM HEPES, 5 mM glutamate, 5 mM malate, and 2 μM rotenone, pH 7.4) according to the pellet volume before any assay.
- Use 5 μL of mitochondrial solution to measure the mitochondrial protein concentration by standard BCA assay, measuring OD562 using a plate reader13.
2. Determination of Mitochondrial Ca2+ Retention Capacity
- Prepare the KCl media and add the Ca2+-binding green fluorescent dye to a final concentration of 0.5 μM before the experiment.
- Transfer 1 mL of isolated mitochondria (0.4 mg/mL) in KCl media containing 0.5 μM Ca2+-binding green fluorescent dye into each 6-well plate well.
- Incubate the mitochondria and the Ca2+-binding green fluorescent dye in the 6-well plate at room temperature protected from ambient light for 1 min. Add 4 μL aliquots of a 20 mM CaCl2 solution (20 mM CaCl2, 127 mM KCl, 1 mM MgCl2, 20 mM HEPES, 5 mM glutamate, 5 mM malate, pH 7.4) to each 6-well plate well using the automatic dispense setting to introduce 200 nmol Ca2+/mg mitochondrial protein.
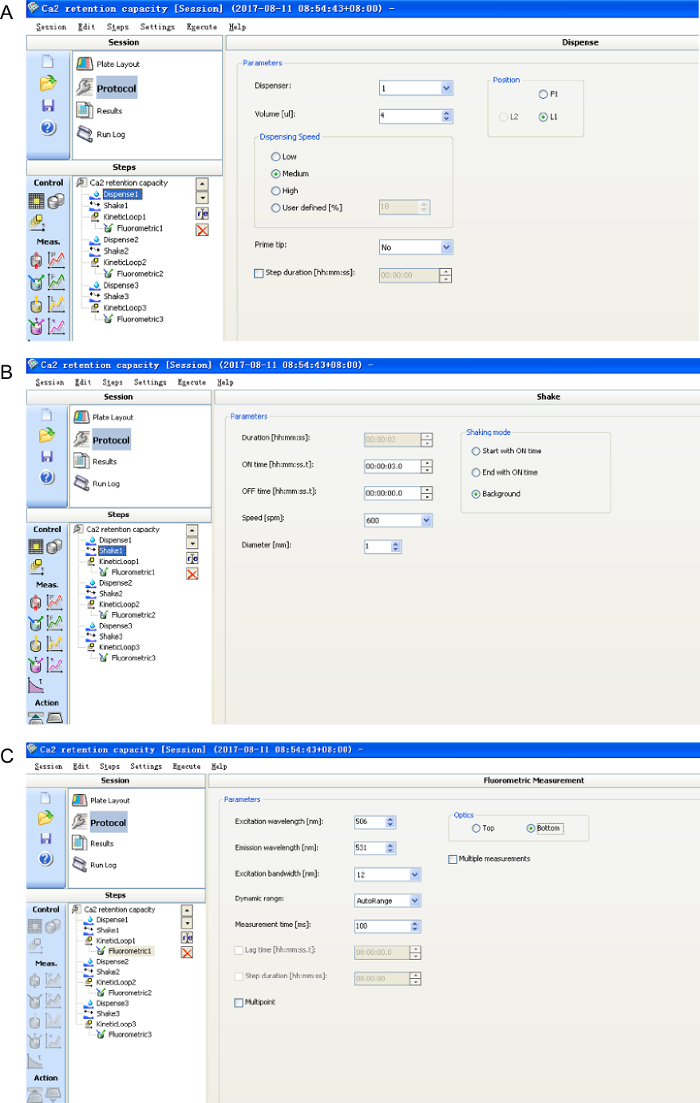
- Use a fluorescence spectrometer to monitor the fluorescence changes every 3 s for 2 min with an excitation wavelength of 506 nm and an emission wavelength of 531 nm. The plate is equipped with shaking at 600 rpm for 3 s between readings controlled by software (Figure 1).
- Add an additional 4 μL aliquot of 20 mM CaCl2 solution to each well and monitor the fluorescence changes every 3 s for 2 min. Repeat this step until the fluorescence increases with time.
NOTE: Mitochondria are challenged with the added Ca2+ indicated by the increased recording fluorescence. When the mPTP opens, the fluorescence increases with time. - Interpret the total amount of Ca2+ added until the mPTP opens as the Ca2+ retention capacity.
3. Determination of Ca 2+-induced Mitochondrial Swelling
- Prepare the KCl media before the experiment.
- Transfer 1 mL of isolated mitochondria (0.4 mg/mL) in KCl media into each 6-well plate well.
- Add 10 μL of 20 mM CaCl2 aqueous solution (500 nmol/mg mitochondrial protein) into mitochondrial protein to trigger mitochondrial swelling.
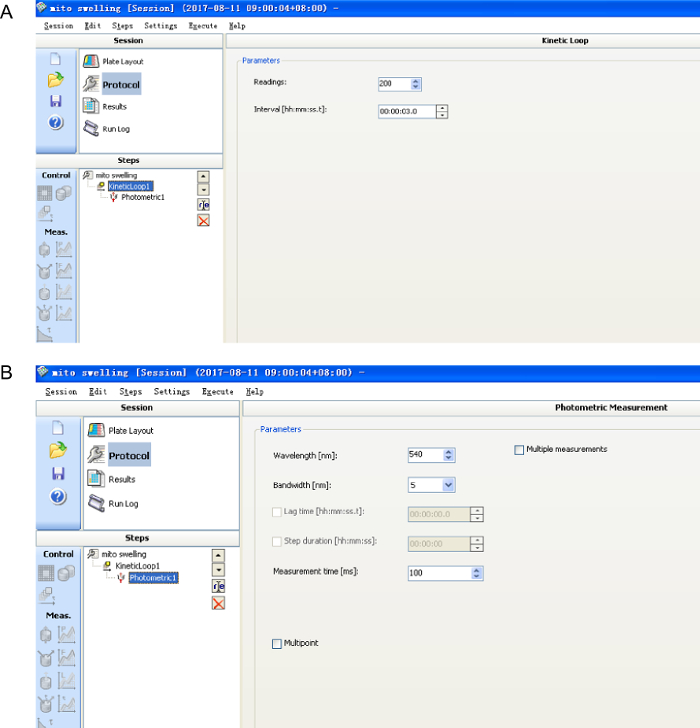
- Record the decrease in absorbance at 540 nm every 3 s on a microplate reader controlled by software for 10 min (Figure 2). The fluorescence changes are caused by an influx of solutes across the mitochondrial inner membrane.
NOTE: The decreased absorbance at 540 nm corresponds to the swollen mitochondria. If the reader does not observe a decrease in absorbance, a longer reading interval or reading time can be adopted.
Representative Results
Representative Results of Ca2+ Retention Capacity:
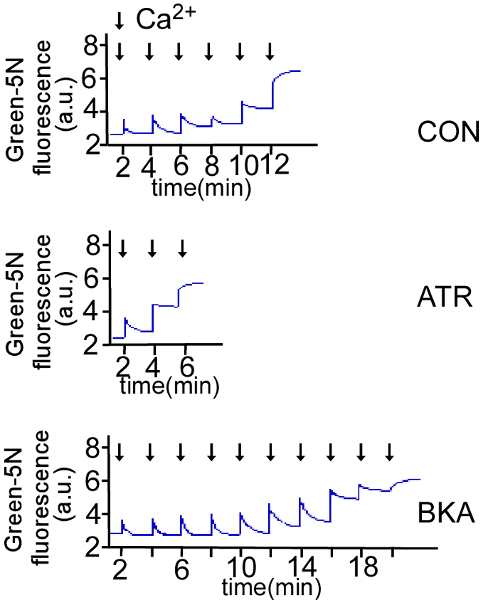
Results were expressed as fluorescence values. With the additional pulses of Ca2+ (200 nmols/mg mitochondrial protein), the fluorescence increased by double above baseline with the mPTP opening. 5 μM Bongkrekate (BKA), an inhibitor of Ca2+-induced mPTP opening, or 1 μM atractyloside (ATR), an activator of Ca2+-induced mPTP opening, were added in isolated mitochondria. The amount of total added Ca2+ until mPTP opening indicated by a double increase above the baseline fluorescence was interpreted as Ca2+ retention capacity. Our data showed that the mitochondrial Ca2+ retention capacity in BKA treatment was much higher than that in ATR group. These data confirmed the suitable measurement of mitochondrial Ca2+ retention capacity (Figure 3).
Representative Results of Ca2+-induced Mitochondrial Swelling:
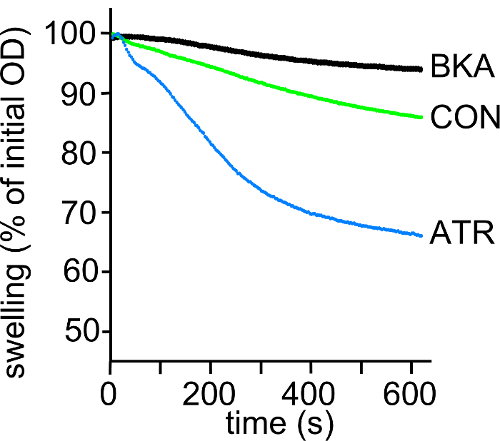
Results were expressed as percentage changes in absorbance at 540 nm versus initial absorbance during a period of 10 min after the addition of CaCl2. Triggered by the addition of Ca2+ (500 nmol/mg mitochondrial protein), the decreased absorbance monitored at 540 nm indicated the mitochondrial swellings. With the treatment of BKA or ATR, the calibration curve showed a slight or sharp decrease compared to initial absorbance, indicating that BKA can inhibit mPTP opening while ATR can facilitate the mPTP opening (Figure 4).

Figure 1: The software settings for mitochondrial Ca2+ retention capacity assay. Please click here to view a larger version of this figure.

Figure 2: The software settings for mitochondrial Ca2+-triggered mitochondrial swelling assay. Please click here to view a larger version of this figure.

Figure 3: The measurement of Ca2+ retention capacity. Extra-mitochondrial Ca2+ in isolated mitochondria was measured fluorometrically with the Ca2+-binding green fluorescent dye in the presence of 5 μM bongkrekate (BKA), 1 μM atractyloside (ATR), or blank control (CON). Traces of Ca2+ retention by isolated mitochondria with BKA, ATR, and CON were measured at 506 nm (Ex) and 531 nm (Em) on a microplate reader. Please click here to view a larger version of this figure.

Figure 4: The measurement of Ca2+-induced mitochondrial swelling. Ca2+-induced mitochondrial swelling of SH-SY5Y in the presence of 5 μM bongkrekate (BKA), 1 μM atractyloside (ATR), or blank control (CON) was expressed as a percentage decreased calibration curve of the initial absorbance at 540 nm. Please click here to view a larger version of this figure.
Discussion
Here, we described a simple and effective protocol for the mitochondrial Ca2+ retention capacity assay and Ca2+-triggered mitochondrial swelling assay.
For the mitochondrial isolation, make sure that all the materials and tubes are on ice, especially when homogenizing the cells. 0.25% trypsin-EDTA can also be used to detach cells from the dish for 5 min at 37 °C. After 15 – 25 strokes, it is necessary to observe the intact cell membrane under the microscope and avoid the breakage of the mitochondria membrane. However, the isolated mitochondria that we obtained are crude mitochondria and purified mitochondria can be obtained through 1.0 M/1.5M discontinuous sucrose gradient. The biological characteristics of mitochondria in living cells are more like those in vivo than in isolated mitochondria because of the concentrations of the medium components that surround the mitochondria. The mitochondrial Ca2+ retention capacity or Ca2+-triggered mitochondrial swelling assay was determined under energized conditions. For determination of functioning mitochondria, 5 mM succinate can be added as respiratory substrates instead of glutamate and malate6.
Ca2+-binding green fluorescent dye (binds Ca2+ with an affinity of 4.29 ± 0.67 mM), is more suitable to measure micromolar concentrations of Ca2+ than higher affinity dyes such as fura-2 7. After the addition of the Ca2+-binding green fluorescent dye, the incubation must be less than 240 s. Successive additions of Ca2+ (varying from 25 – 200 nmol) were injected at 1 – 3 min intervals. The calibration curves show the concentrations of Ca2+ that the mitochondria are unable to sequester, indicating the mitochondrial uptake of pulses of Ca2+. Otherwise, the Ca2+-binding green fluorescent dye was also used in calcium signaling investigations, such as intracellular free Ca2+ concentration measurement, following Ca2+ influx and release, and multiphoton excitation imaging of Ca2+ in living tissues.
For determination of Ca2+ -induced mitochondrial swelling, swelling can also be induced with the addition of 200 mM ATR and CaCl2. As a control, mitochondria could be incubated with 1 mM CsA for 5 min before the measurement, which inhibited the mPTP opening. Previous research showed calibration curves of absorbance as a function of the percentage of swollen mitochondria14. It was reported that 1 mM CsA, 0.1 mM ruthenium red, and an equal volume of fresh mitochondria (0.5 mg/mL) can be added in the reaction when swelling was complete. Because CsA and ruthenium red can inhibit the mPTP opening in the freshly added mitochondria, the calibration curves indicate both the swollen mitochondria and non-swollen mitochondria15. The protocol of mitochondrial swelling upon Ca2+ overload is also an effective and direct measurement of Ca2+-induced mPTP opening.
Since the discovery of transport of Ca2+ by mitochondria from mammals and other higher vertebrates more than 50 years ago, there has been much research on the mechanisms and functions of mitochondrial calcium efflux and influx. The mitochondrial Ca2+ uptake mechanisms contain the mitochondrial Ca2+ uniporter, the rapid mode or RaM, and the ryanodine receptor (mRyR)16. The assays we described above can evaluate Ca2+-related mitochondrial function simply and effectively.
Divulgazioni
The authors have nothing to disclose.
Acknowledgements
This study was supported by grants from grant of the Outstanding Scientist of Shandong (JQ201421) and grant from NSFC (81371226).
Materials
| SH-SY5Y cell line | ATCC (The Global Bioresource Center) | ATCC Number: CRL-2266 | |
| Calcium green-5N | Life Technologies | c-3737 | Ca2+-binding green fluorescent dye |
| complete protease inhibitors | Roche Molecular Biochemicals | 4693116001 | |
| glass homogenizer | Kimble Chase | 9885303002 | |
| glutamate | Sigma-Aldrich | RES5063G-A7 | |
| malate | Sigma-Aldrich | 46940-U | |
| rotenone | Sigma-Aldrich | R8875 | |
| HEPES | Sigma-Aldrich | H3375 | |
| MgCl2 | Sigma-Aldrich | 00457 | |
| K2HPO4 | Sigma-Aldrich | V900050 | |
| KCl | Sigma-Aldrich | P9541 | |
| CaCl2 | Sigma-Aldrich | V900266 | |
| Varioskan flash instruments | Thermo Scientific | IC100E | |
| Bongkrekate | Biovision | 1820-100 | |
| atractyloside | Sigma-Aldrich | C4992 | |
| high-glucose Dulbecco’s modified Eagle medium | Hyclone | SH30022 | 4.5 g/L glucose, L-glutamine, without sodium pyruvate |
| fetal bovine serum | Hyclone | SV30087 | |
| penicillin | Sigma-Aldrich | P3032 | |
| streptomycin | Invitrogen | 11860-038 | |
| BCA assay kit | Thermo Scientific | NCI3225CH | |
| PBS | Hyclone | SH30256.01 | |
| 10 cm cell culture dish | NEST | 704001 |
Riferimenti
- Rossi, C. S., Lehninger, A. L. Stoichiometry of respiratory stimulation, accumulation of Ca++ and phosphate, and oxidative phosphorylation in rat liver mitochondria. J Biol Chem. 239 (11), 3971-3980 (1964).
- Gunter, T. E., Buntinas, L., Sparagna, G., Eliseev, R., Gunter, K. Mitochondrial calcium transport: mechanisms and functions. Cell Calcium. 28 (5-6), 285-296 (2000).
- Crofts, A. R., Chappell, J. B. Calcium Ion Accumulation and Volume Changes of Isolated Liver Mitochondria. Reversal of Calcium Ion-Induced Swelling. Biochem J. 95, 387-392 (1965).
- Wojda, U., Salinska, E., Kuznicki, J. Calcium ions in neuronal degeneration. IUBMB Life. 60 (9), 575-590 (2008).
- Celsi, F., et al. Mitochondria, calcium and cell death: a deadly triad in neurodegeneration. Biochim Biophys Acta. 1787 (5), 335-344 (2009).
- Murphy, A. N., Bredesen, D. E., Cortopassi, G., Wang, E., Fiskum, G. Bcl-2 potentiates the maximal calcium uptake capacity of neural cell mitochondria. Proc Natl Acad Sci U S A. 93 (18), 9893-9898 (1996).
- Rajdev, S., Reynolds, I. J. Calcium green-5N, a novel fluorescent probe for monitoring high intracellular free Ca2+ concentrations associated with glutamate excitotoxicity in cultured rat brain neurons. Neurosci Lett. 162 (1-2), 149-152 (1993).
- Stout, A. K., Reynolds, I. J. High-affinity calcium indicators underestimate increases in intracellular calcium concentrations associated with excitotoxic glutamate stimulations. Neuroscienze. 89 (1), 91-100 (1999).
- Bambrick, L. L., et al. Cyclosporin A increases mitochondrial calcium uptake capacity in cortical astrocytes but not cerebellar granule neurons. J Bioenerg Biomembr. 38 (1), 43-47 (2006).
- Zhao, K., et al. Cell-permeable peptide antioxidants targeted to inner mitochondrial membrane inhibit mitochondrial swelling, oxidative cell death, and reperfusion injury. J Biol Chem. 279 (33), 34682-34690 (2004).
- Muriel, M. P., et al. Mitochondrial free calcium levels (Rhod-2 fluorescence) and ultrastructural alterations in neuronally differentiated PC12 cells during ceramide-dependent cell death. J Comp Neurol. 426 (2), 297-315 (2000).
- Allman, R., Hann, A. C., Phillips, A. P., Martin, K. L., Lloyd, D. Growth of Azotobacter vinelandii with correlation of Coulter cell size, flow cytometric parameters, and ultrastructure. Cytometry. 11 (7), 822-831 (1990).
- Wiechelman, K. J., Braun, R. D., Fitzpatrick, J. D. Investigation of the bicinchoninic acid protein assay: identification of the groups responsible for color formation. Anal Biochem. 175 (1), 231-237 (1988).
- Petronilli, V., Nicolli, A., Costantini, P., Colonna, R., Bernardi, P. Regulation of the permeability transition pore, a voltage-dependent mitochondrial channel inhibited by cyclosporin A. Biochim Biophys Acta. 1187 (2), 255-259 (1994).
- Pastorino, J. G., et al. Functional consequences of the sustained or transient activation by Bax of the mitochondrial permeability transition pore. J Biol Chem. 274 (44), 31734-31739 (1999).
- Gunter, T. E., Sheu, S. S. Characteristics and possible functions of mitochondrial Ca(2+) transport mechanisms. Biochim Biophys Acta. 1787 (11), 1291-1308 (2009).

