Dorsal Column Steerability with Dual Parallel Leads using Dedicated Power Sources: A Computational Model
Summary
Using a mathematical model of spinal cord stimulation, we found that a multi-source system with independent power sources for each contact can target more central points of stimulation on the dorsal column (100 vs 3) and has 50-fold more field steering resolution (0.02mm vs 1mm) than a single-source system.
Abstract
In spinal cord stimulation (SCS), concordance of stimulation-induced paresthesia over painful body regions is a necessary condition for therapeutic efficacy. Since patient pain patterns can be unique, a common stimulation configuration is the placement of two leads in parallel in the dorsal epidural space. This construct provides flexibility in steering stimulation current mediolaterally over the dorsal column to achieve better pain-paresthesia overlap. Using a mathematical model with an accurate fiber diameter distribution, we studied the ability of dual parallel leads to steer stimulation between adjacent contacts on dual parallel leads using (1) a single source system, and (2) a multi-source system, with a dedicated current source for each contact. The volume conductor model of a low-thoracic spinal cord with epidurally-positioned dual parallel (2 mm separation) percutaneous leads was first created, and the electric field was calculated using ANSYS, a finite element modeling tool. The activating function for 10 um fibers was computed as the second difference of the extracellular potential along the nodes of Ranvier on the nerve fibers in the dorsal column. The volume of activation (VOA) and the central point of the VOA were computed using a predetermined threshold of the activating function. The model compared the field steering results with single source versus dedicated power source systems on dual 8-contact stimulation leads. The model predicted that the multi-source system can target more central points of stimulation on the dorsal column than a single source system (100 vs. 3) and the mean steering step for mediolateral steering is 0.02 mm for multi-source systems vs 1 mm for single source systems, a 50-fold improvement. The ability to center stimulation regions in the dorsal column with high resolution may allow for better optimization of paresthesia-pain overlap in patients.
Protocol
1. Introduction:
Spinal cord stimulation, or SCS, has been clinically applied since 1967, when Dr Norman Shealy first implanted stimulation electrodes over the dorsal columns in an attempt to provide relief for patients with chronic, intractable pain (Shealy et al., 1967). SCS is the clinical implementation of the Gate Theory, which posits that activation of large myelinated afferent nerves which mediate touch and pressure sensations, can inhibit, or “close the gate” on transmission of pain signals to higher centers in the brain (Melzack & Wall, 1965). Technology for SCS has improved over the decades, with more reliable stimulation equipment better designed to stimulate the dorsal columns has evolved.
Key to these improvements has been an increased understanding of the neuroanatomy and neurophysiology of the spinal cord relevant to clinical electrical stimulation. This understanding has been advanced by computational modeling of SCS. Computational modeling of neurons has been used to understand basic mechanisms for neural stimulation since Hodgkin and Huxley’s mathematical model was first described (Hodgkin and Huxley, 1952). Neural activity is modulated by electric fields applied as intracellular current injection and extracellular potential fields. Ranck qualitatively discussed how changes in the extracellular voltage in the vicinity of an axon cause some regions of the axon membrane to depolarize and others to hyperpolarize (Ranck, 1975).
A computational model for SCS was initially developed by Coburn and Sin (Coburn, 1980) and was significantly furthered by Holsheimer and colleagues, beginning with Struijk and Holsheimer’s development of a three dimensional field model of SCS (Holsheimer and Struijk, 1988). Their computational model estimated the effect of anatomic parameters on the thresholds of dorsal column fibers (Struijk et al., 1992), predicted the potential location of excitation in dorsal root fibers (Struijk et al., 1993b), and analyzed the effect of CSF thickness (Struijk et al., 1993a) with clinical validations (He et al., 1994; Holsheimer et al., 1995a; Holsheimer et al., 1994). The model contributed significantly to design of stimulation lead design, suggesting optimal parameters for contact size and spacing (Holsheimer and Struijk, 1992; Holsheimer and Wesselink, 1997), to favor preferential stimulation of dorsal column fibers over root fibers (Holsheimer et al., 1995b).
2. Methods:
Mathematical Model Definition
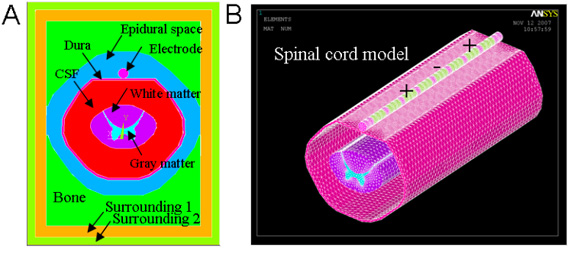
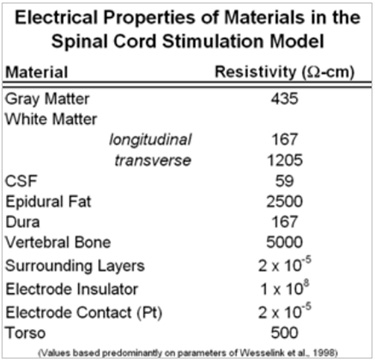
A finite element mathematical (FEM) model was created of the low-thoracic spinal cord and its surrounding environment. The FEM model consisted of spinal cord white and gray matter, cerebrospinal fluid, dura, epidural space tissue, vertebral bone, and two cylindrical multicontact leads. Each lead consisted of eight cylindrical platinum-iridium contacts (conducting domains, 3mm length and 1.25 mm diameter), separated by 1mm lengths of insulating polymer (non-conducting domains, 1mm length). The leads were positioned dorsally, atop the dura, and symmetric, 1mm to each side of the midline of the spinal cord. In the model, the “thickness” of the cerebrospinal fluid layer between the contacts and the dorsal surface of the spinal cord (dCSF) was specified to be 3.2mm. The geometry of the model is illustrated in Figure 1A and electrical resistivities are given in Table I, values coming predominantly from the literature (Holsheimer, 2002; Wesselink et al., 1999). The volume was meshed with over 1 million nodes, with a high-density mesh in the region close to where electrodes are located as illustrated in Figure 1B.

Figure 1. Depiction of the mesh of the FEM for the spinal cord and multicontact lead. (A) Components and structure of model. (B) Model mesh – only the high density part is shown. The mesh was segmented into sections of variable node density: near the contacts (≤ 300 μm); insulator, dura and spinal cord (≤ 750 μm); epidural space (≤ 3000 μm); and vertebral bone (≤ 5000 μm).

Table 1. Resistivity values of the FEM domains (Holsheimer, 2002; Wesselink et al., 1999) and modification (epidural space) to match clinical data.
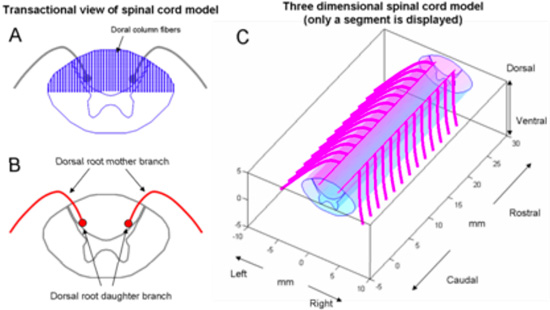
The spinal cord geometry (Figure 2) was created using a combination of features from relevant literature sources. The cross-section of the cord was derived from Kameyama et al., and the dorsal root (DR) trajectory of Struijk et al. was adopted (Kameyama et al., 1996; Struijk et al., 1993b). Dorsal column (DC) fibers were placed on regular grid of (200um for mediolateral direction and 100um dorsoventral direction; see Figure 2A) and projected in the rostrocaudal direction. Each DR was modeled as a larger diameter ‘mother’ fiber connected to bifurcated ‘daughter’ fibers of smaller diameter (Fig 2B).

Figure 2. Structure of spinal cord model. (A) Transactional view of spinal cord and location of dorsal column fibers. (B) Dorsal roots are composed of a mother fiber and bifurcated daughter fibers. The trajectory of the mother fiber was digitized from Struijk 1993. (C) Three dimensional view of spinal cord and DR fibers.
Model Investigation
Once the leads were positioned within the model, the two types of stimulators were implemented by defining the currents for two parallel contacts. For a single source system, there were three possible methods to deliver current: a. the leftmost contact has all the current; b. the two contacts each deliver 50% of the current; c. the rightmost contact delivers all the current. We note here that the impedance of the two contacts is assumed equal, though this is unlikely to be true in clinical application.
For the multisource system, each contact was defined to have its own current source controllable in 1% incremental current changes between the contacts. In other words, if the total current delivered to the two contacts is 10mA, in the multisource system the current to each contact was specified to any fraction of the total, so long as the sum of the currents through each contact equal 10mA. For example, the leftmost contact might deliver 6.8 mA where the rightmost contact would then deliver 3.2 mA. For the multisource system, 100 fractional splits of current were programmed in this manner.
To calculate the region of activation within the dorsal columns by each system, an activating function analysis was performed. The activating function is an approximation of the change in the transmembrane potential when extracellular stimulating current is applied to neural tissue for a given electrode and fiber geometry. The region of activation was defined as the locus of fibers in the model where the activating function (or simply second difference of voltages along axon) exceeded a predetermined threshold (ex. 0.1mV/mm2). The central point of stimulation was defined and calculated as the geometric centroid of the 3-dimensional region of activation.
To determine stimulation amplitude, the two contacts were specified to be cathodes (50% and 50% negative potential on two contacts) in a monopolar configuration (sourced current delivered with equivalent current density from model borders). The stimulation amplitude was then iteratively increased until the first fiber activated was observed (this was always a dorsal column fiber). This first activation was assumed to correlate to first perception of paresthesia by a patient in the clinical setting. In the model, the current was then increased to 1.4*(mA to activate first fiber) and the centroid of the resulting region of activation was calculated. Centroids of all steering steps (100:0 to 0:100) were computed with amplitude determined in the previous step. Average resolution of centroid change was centroid location range divided by current steps.
3. Outcome:
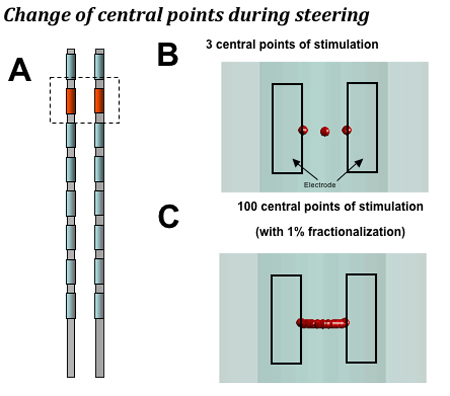
When steering stimulation mediolaterally between dual leads, the computational model predicts that a device with independent current sources for each contact can target more central points of stimulation on the dorsal column than a single source system (100 vs 3). As a result of this, the resolution of adjustment of the central point of stimulation is 30 um with a multisource system, an approximate 50-fold increase compared to single-source systems (see Figure 3).

Figure 3. The computational model makes the following predictions. A. Dual lead configuration: 2.0 mm separation between leads with monopole stimulation. B. Single source devices that provide a single, shared power source for all contacts can target three central points of stimulation when shifting stimulation mediolaterally (a step size of 1 mm on average with 2 mm lead separation). C: A device with a dedicated power source for each contact can target 100 central points laterally in the dorsal column when fractionalizing current in 1% increments, or 10 central points when fractionalizing in 10% increments (a step size of 0.02 mm for 1% steps and 0.2 mm for 10% steps on average).
Discussion
The ability to center stimulation regions in the dorsal column with high resolution may allow for better optimization of paresthesia-pain overlap in patients. That is, in a given patient, the region of activation in the dorsal columns may be focused to maximize coverage of painful areas while minimizing side-effects (due to stimulation of undesired fibers, which may generate paresthesia in undesireable locations or create motor or autonomic effects).
Divulgazioni
The authors have nothing to disclose.
Acknowledgements
This study was funded by Boston Scientific Neuromodulation.
Materials
- NEURON (http://www.neuron.yale.edu)
- ANSYS (Canonsburg, PA, http://www.ansys.com)
- Matlab (Natick, MA, http://www.mathworks.com)
Riferimenti
- Barolat, G. Current Status of Epidural Spinal Cord Stimulation. Neurosurgery Quarterly. 5, 98-124 (1995).
- Coburn, B. Electrical stimulation of the spinal cord: two-dimensional finite element analysis with particular reference to epidural electrodes. Med Biol Eng Comput. 18, 573-584 (1980).
- Feirabend, H. K., Choufoer, H., Ploeger, S., Holsheimer, J., van Gool, J. D. Morphometry of human superficial dorsal and dorsolateral column fibres: significance to spinal cord stimulation. Brain. 25, 1137-1149 (2002).
- He, J., Barolat, G., Holsheimer, J., Struijk, J. J. Perception threshold and electrode position for spinal cord stimulation. Pain. 59, 55-63 (1994).
- Hodgkin, A. L., Huxley, A. F. A quantitative description of membrane current and its application to conduction and excitation in nerve. J Physiol. 117, 500-544 (1952).
- Holsheimer, J. Which Neuronal Elements are Activated Directly by Spinal Cord Stimulation. Neuromodulation. 5, 25-31 (2002).
- Holsheimer, J., Barolat, G., Struijk, J. J., He, J. Significance of the spinal cord position in spinal cord stimulation. Acta Neurochir Suppl. 64, 119-1124 (1995).
- Holsheimer, J., den Boer, J. A., Struijk, J. J., Rozeboom, A. R. MR assessment of the normal position of the spinal cord in the spinal canal. AJNR Am J Neuroradiol. 15, 951-959 (1994).
- Holsheimer, J., Struijk, J. J., Wallinga, W., Boom, W., De Vries, J. Analysis of spinal cord stimulation. Electrophysiological Kinesiology. , 95-98 (1988).
- Holsheimer, J., Struijk, J. J. Electrode Geometry and Preferential Stimulation of Spinal Nerve Figers Having Different Orientations. , 256 (1992).
- Holsheimer, J., Struijk, J. J., Tas, N. R. Effects of electrode geometry and combination on nerve fibre selectivity in spinal cord stimulation. Med Biol Eng Comput. 33, 676-682 (1995).
- Holsheimer, J., Wesselink, W. A. Optimum electrode geometry for spinal cord stimulation: the narrow bipole and tripole. Med Biol Eng Comput. 35, 493-497 (1997).
- Kameyama, T., Hashizume, Y., Sobue, G. Morphologic features of the normal human cadaveric spinal cord. Spine. 21, 1285-1290 (1996).
- McIntyre, C. C., Grill, W. M. Extracellular stimulation of central neurons: influence of stimulus waveform and frequency on neuronal output. J Neurophysiol. 88, 1592-1604 (2002).
- McIntyre, C. C., Miocinovic, S., Butson, C. R. Computational analysis of deep brain stimulation. Expert Rev Med Devices. 4, 615-622 (2007).
- Melzack, R., Wall, P. D. Pain mechanisms: a new theory. Science. 150, 971-979 (1965).
- Ranck, J. B. Which elements are excited in electrical stimulation of mammalian central nervous system: a review. Brain Res. 98, 417-440 (1975).
- Shealy, C. N., Mortimer, J. T., Reswick, J. B. Electrical inhibition of pain by stimulation of the dorsal columns: preliminary clinical report. Anesth Analg. 46, 489-491 (1967).
- Smith, M. C., Deacon, P. Topographical anatomy of the posterior columns of the spinal cord in man. The long ascending fibres. Brain. 107, 671-698 (1984).
- Struijk, J. J., Holsheimer, J., Barolat, G., He, J., Boom, H. B. Paresthesia Thresholds in Spinal Cord Stimulation: A Comparison of Theoretical Results with Clinical Data. IEEE Trans Rehab Eng. 1, 101-107 (1993).
- Struijk, J. J., Holsheimer, J., Boom, H. B. Excitation of dorsal root fibers in spinal cord stimulation: a theoretical study. IEEE Trans Biomed Eng. 40, 632-639 (1993).
- Struijk, J. J., Holsheimer, J., van der Heide, G. G., Boom, H. B. Recruitment of dorsal column fibers in spinal cord stimulation: influence of collateral branching. IEEE Trans Biomed Eng. 39, 903-912 (1992).
- Struijk, J. J., Holsheimer, J., van Veen, B. K., Boom, H. B. Epidural spinal cord stimulation: calculation of field potentials with special reference to dorsal column nerve fibers. IEEE Trans Biomed Eng. 38, 104-110 (1991).
- Wesselink, W. A., Holsheimer, J., King, G. W., Torgerson, N. A., Boom, H. B. K. Quantitative Aspects of the Clinical Performance of Transverse Tripolar Spinal Cord Stimulation. Neuromodulation. 2, 5-14 (1999).

