Three-Dimensional Shape Modeling and Analysis of Brain Structures
Summary
We introduce a semi-automatic protocol for shape analysis on brain structures, including image segmentation using open software, and further group-wise shape analysis using an automated modeling package. Here, we demonstrate each step of the 3D shape analysis protocol with hippocampal segmentation from brain MR images.
Abstract
Statistical shape analysis of brain structures has been used to investigate the association between their structural changes and pathological processes. We have developed a software package for accurate and robust shape modeling and group-wise analysis. Here, we introduce an pipeline for the shape analysis, from individual 3D shape modeling to quantitative group shape analysis. We also describe the pre-processing and segmentation steps using open software packages. This practical guide would help researchers save time and effort in 3D shape analysis on brain structures.
Introduction
Shape analysis of brain structures has emerged as the preferred tool to investigate their morphological changes under pathological processes, such as neurodegenerative diseases and aging1. Various computational methods are required to 1) accurately delineate the boundaries of target structures from medical images, 2) reconstruct the target shape in the form of 3D surface mesh, 3) build inter-subjects correspondence across the individual shape models via shape parameterization or surface registration, and 4) quantitatively assess the regional shape differences between individuals or groups. Over the past several years, many methods have been introduced in neuroimaging studies for each of these steps. However, despite the remarkable developments in the field, there are not many frameworks immediately applicable to research. In this article, we describe each step of the shape analysis of brain structures using our custom shape modeling tools and publicly available image segmentation tools.
Here, we demonstrate the shape analysis framework for brain structures through the shape analysis of the left and right hippocampi using a dataset of adult controls and Alzheimer's disease patients. Atrophy of the hippocampi is recognized as a critical imaging biomarker in neurodegenerative diseases2,3,4. In our shape analysis framework, we employ the template model of the target structure and the template-to-image deformable registration in the shape modeling process. The template model encodes general shape characteristics of the target structure in a population, and it also provides a baseline for quantifying the shape differences among the individual models via their transitive relation with the template model. In the template-to-image registration, we have developed a Laplacian surface deformation method to fit the template model to the target structure in individual images while minimizing the distortion of the point distribution in the template model5,6,7. The feasibility and robustness of the proposed framework have been validated in recent neuroimaging studies of cognitive aging8, early detection of mild cognitive impairment9, and to explore associations between brain structural changes and cortisol levels10. This approach would make it easier to use the shape modeling and analysis methods in further neuroimaging studies.
Protocol
Brain MR images were acquired as per the protocol approved by the local institutional review board and ethics committee.
NOTE: The tools for shape modeling and analysis can be downloaded from the NITRC repository: https://www.nitrc.org/projects/dtmframework/. The GUI software (DTMModeling.exe) can be executed after extraction.<!–The publication list on the shape modeling tools can be found in the project webpage: http://cgv.kaist.ac.kr/brain.–> See Figure 1.
1. Brain MR Image Segmentation
- Acquire brain MR images of individual subjects and brain segmentation masks.
NOTE: Usually, we acquire T1-weighted MR images for analyses of brain structures. We assume that the MR images are pre-processed for gradient non-linearity correction and intensity inhomogeneity correction using N311, improved N3 methods12, or FSL-FAST13. Some freely available tools for automatic segmentation of human brain structures are listed in Table 1. - Correct the segmentation results manually.
NOTE: Open GUI software supporting manual segmentation are listed in Table 2. Manual segmentation protocols for the brain structures can be found here14,15,16. A video guide on manual segmentation for hippocampus is here17. We describe the protocol for hippocampal segmentation in the next section.- Open the T1-weighted MRI and the automatic segmentation results using the Open File menu.
- Load the Segmentation plugin by clicking Window Menu | Show | Segmentation.
- Correct the segmentation mask using the Add, Subtract, and Correction tools in the Segmentation plugin.
- Save the corrected segmentation mask in Nifti format using the Save menu.
2. Manual Editing of Hippocampal Segmentation
NOTE: We introduce a protocol for manually editing of brain segmentation using the GUI modeling software based on the MITK workbench (http://www.mitk.org/). The MITK workbench provides various functions for the manual and automatic segmentation and medical image visualization. We demonstrate the manual editing process for the left and right hippocampi. Steps for manually editing18 the result of the automatic hippocampal segmentation are as follows.
- Open the T1-weighted MR image and the results of the automatic hippocampal segmentation using the MITK workbench software.
- Load the Segmentation plugin in the MITK workbench by clicking on the menu Window | Show View | Segmentation.
- Select the coronal view by clicking the right-hand side icon that appears in the top right-hand side corner of the Display window.
- Edit the binary mask of each hippocampus (i.e., left and right) in the coronal view, starting from the hippocampal head to the body as follows.
- Scroll throughout the volume until the uncus is found. Include the uncus in the hippocampal mask where it is present.
- Edit the mask of the hippocampal body after the uncus has receded using the Add and Subtract function in the Segmentation plugin.
- Continue editing the hippocampal mask until the hippocampal tail is found. As the pulvinar nucleus of the thalamus recedes superior to the hippocampus, the fornix emerges.
- Finish editing the last coronal slice of the hippocampus in which the entire length of the fornix is visible but not yet continuous with the splenium of the corpus callosum.
NOTE: Cerebrospinal fluid (CSF) spaces can be contained within the hippocampal regions. The CSF spaces can be removed from the hippocampal masks using the Subtract tool in the segmentation plugin of the MITK workbench. it may be easier to define the hippocampal regions entirely and then go through all coronal slices from the hippocampal head to tail for the removal of CSF spaces. - Follow the same process for editing the binary masks of both hippocampi.
NOTE: The Add, Subtract, and Correction tools of the Segmentation plugin in the MITK workbench can be used for the manual editing. The Correction tool is easy to handle small errors in the segmentation mask by performing addition and subtraction according to user input and the segmentation mask without additional tool selection.
- Save the binary masks for left and right hippocampi in Nifti format (nii or nii.gz) using the Save menu in the MITK workbench software.
NOTE: The binary masks of left and right hippocampi should be saved separately for the subsequent hippocampal shape model steps.
3. Group Template Construction
NOTE: After the segmentation and manual editing for all subjects, the individual shape modeling requires the template model of the target structure. We construct the template model from the average binary mask for a population, acquired using "ShapeModeling" plugin in the MITK Workbench. Steps of the template model construction using GUI software are as follows.
- Load the ShapeModeling plugin using the menu function: Window | Show View | Shape Modeling.
- Open a directory containing the binary masks of a study population by clicking the Open Directory button in the ShapeModeling plugin.
- Click the Template Construction button in the ShapeModeling plugin.
- Check the mean shape mesh and save it in stereolithography (STL) format using the Save menu.
4. Individual Shape Reconstruction
NOTE: At this step, we perform the shape modeling for individual subjects using Start Shape Modeling button in the "ShapeModeling" plugin. We list the software parameters of this plugin in Table 3. Detailed explanation on each parameter can be found here5. Steps of the individual shape reconstruction using GUI software are as follows.
- Load T1-weighted MR image and its segmentation mask using the Open File menu.
NOTE: We use the T1-weighted MR image for visual validation. - Check the modeling parameters in ShapeModeling plugin and modify if necessary.
NOTE: If the template model is not deformed or the distance between the template model and the image boundary is large, it is recommended to increase the boundary search range. If some geometric distortions are found, increasing maxAlpha and minAlpha with step 0.5 would help to resolve the issue. It is important to check the voxel intensity for the target object in the segmentation mask. If the value is not 1, intensity parameter should be changed accordingly. - Click the Shape Modeling button to run the shape modeling process and check the result in the 3D view of MITK workbench.
- Repeat steps 4.2 and 4.3, when the template model is not fitted to the image boundary closely.
NOTE: The template model is visualized with the segmentation mask in the sagittal, coronal, axial, and 3D view of the MITK workbench. The template surface is not deformed when the distance between the template model and the image boundary is less than a threshold which is one tenth of the smallest voxel size. - Save the modeling result in a stereolithography (STL) format using the Save menu in MITK framework.
5. Group-wise Shape Normalization and Shape Difference Measurement
NOTE: At this step, we align the individual shape models to the template model and compute the point-wise shape deformity between the corresponding vertices between the template model and the individual shape model. Steps for the shape deformity measurement are as follows.
- Select the shape model of a subject in the Data Manager of the MITK workbench.
NOTE: Users can select multiple models for the deformity measurement. - Perform the deformity measurement by clicking the Measurement button in the ShapeModeling plugin.
Representative Results
The shape modeling process described here has been employed for various neuroimaging studies on aging6,8,10 and Alzheimer's disease5,9. Especially, this shape modeling method showed its accuracy and sensitivity in the shape analysis on the hippocampus for an aging population of 654 subjects8. A quantitative analysis of the software and the publicly-available software, ShapeWork, LDDMM-TI, and SPHARM-PDM, can be found here5. We describe many open tools from MR image preprocessing to brain segmentation in Table 1,Table 2, and Table 4.
Figure 2 is a diagram of the shape modeling framework using the template models of target structures. The template models represent general shape characteristics of the brain structures in a population. Figure 3 presents the deformation of the hippocampal template model for individual shape reconstruction. The method induces a large-to-small scale deformation of the template model to minimize the distortion of its point distribution while restoring individual shape characteristics. Figure 4 shows the reconstructed shape models of two subjects with their segmentation masks. Figure 5 shows the aligned individual shape models, their average model, and the shape difference vectors with an individual shape model. Figure 6 presents the average shape deformity maps, projected onto the average model, for two groups with small and large brain tissue volume (BTV). We selected subjects whose BTV is greater or less than a standard deviation from the mean of a healthy aging population of 51 subjects5. The shape deformity maps of two groups present opposite patterns of hippocampal shape difference at corresponding regions.
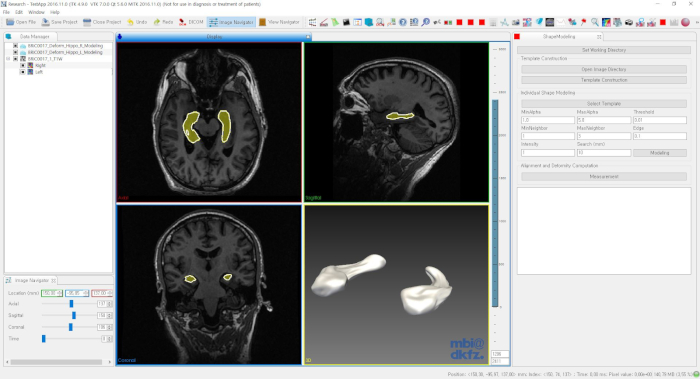
Figure 1: GUI software for the shape modeling and analysis. Please click here to view a larger version of this figure.
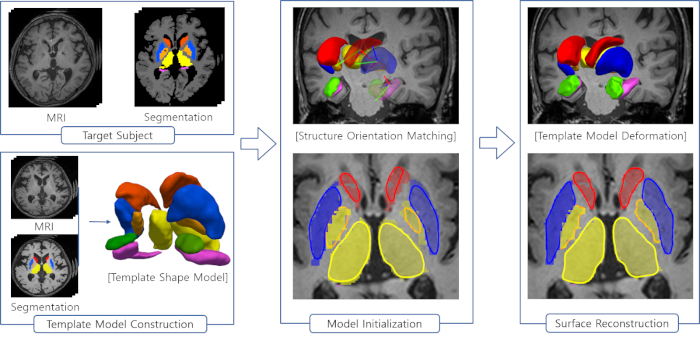
Figure 2: Steps of the shape modeling using the template models for brain structures. Please click here to view a larger version of this figure.
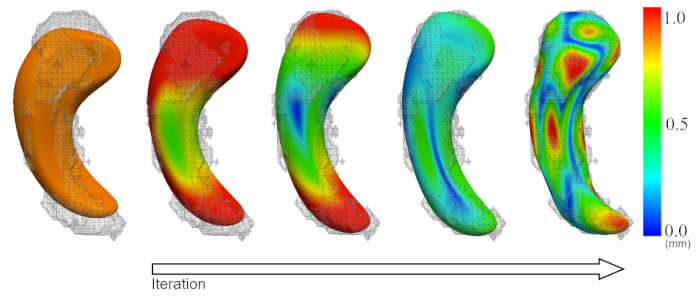
Figure 3: Deformation of the template model (orange) for individual shape reconstruction. Color map = vertex-wise deformation magnitude (mm). Please click here to view a larger version of this figure.
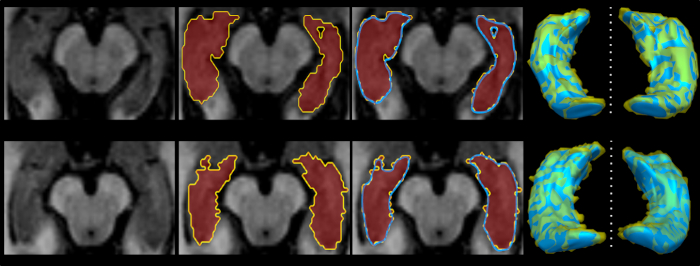
Figure 4: Examples of individual shape modeling of the hippocampus. Please click here to view a larger version of this figure.
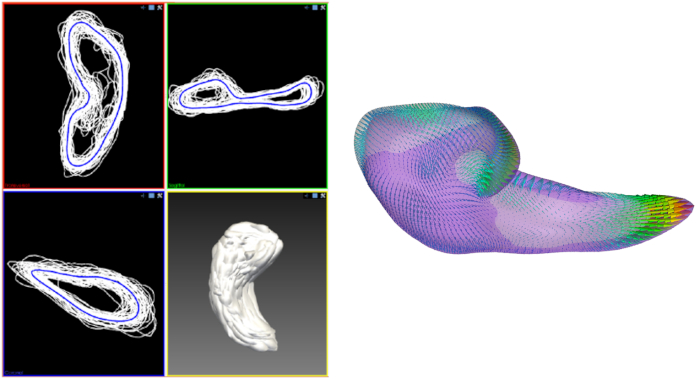
Figure 5: Aligned individual shape models, their average model, and the shape difference vectors with an individual shape model. Left = Aligned individual shape models (white) and their average model (blue). Right = Point-wise shape difference vectors between the average model and an individual model. Please click here to view a larger version of this figure.
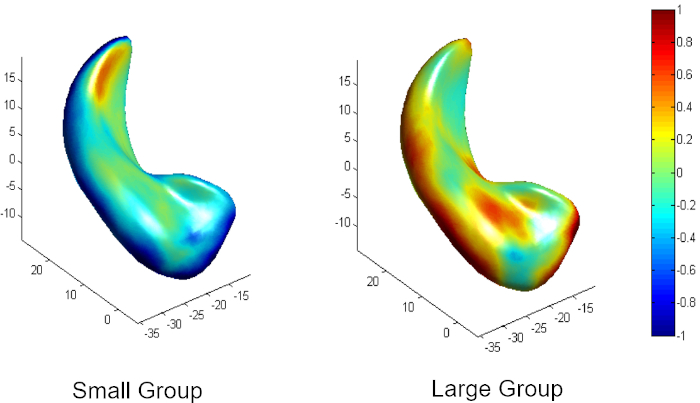
Figure 6: Average shape deformity of two groups with small and large brain tissue volume (less or greater than one standard deviation from the population mean) in a healthy aging population. Please click here to view a larger version of this figure.
| Name | Description | System | Organization | Link |
| ALVIN | Lateral ventricle segmentation | Linux | King's College London | https://www.nitrc.org/projects/alvin_lv/ |
| FIRST | Subcortical structure segmentation in FSL | Linux, Mac | University of Oxford | https://fsl.fmrib.ox.ac.uk/fsl/fslwiki/FIRST |
| FAST | Tissue classification tool with the correction for spatial intensity variations | Linux, Mac | University of Oxford | https://fsl.fmrib.ox.ac.uk/fsl/fslwiki/FAST |
| FreeSurfer | Voxel-wise full brain segmentation | Linux, Mac | Athinoula A. Martinos Center for Biomedical Imaging, MGH | https://surfer.nmr.mgh.harvard.edu/ |
| TOADS-CRUISE | Automatic brain segmentation tool | Linux, Mac | Johns Hopkins University | https://www.nitrc.org/projects/toads-cruise |
| NiftySeg | Automatic brain tissue classification tool | Linux, Mac | King's College London | https://github.com/KCL-BMEIS/NiftySeg |
| BrainSuite PVC tool | Brain tissue classification tool in BrainSuite package | Windows, Linux, Mac | University of Southern California | http://brainsuite.org/ |
Table 1: List of open software widely used for automatic segmentation of brain structures.
| Name | Description | System | Organization | Link |
| MITK | GUI software providing plugins for semi-automatic (e.g. region growing and watershed thresholding) and manual image segmentation | Windows, Linux, Mac | German Cancer Research Center | http://mitk.org/wiki/MITK |
| 3D Slicer | GUI software for medical image processing and 3D visualization. Segment Editor in 3D Slicer is a module for manual segmentation | Windows, Linux, Mac | Brigham and Women's Hospital, Inc. |
https://www.slicer.org/ |
| ITK-Snap | GUI software for semi-automatic (active contour method) and manual segmentation | Windows, Linux, Mac | University of Pennsylvania and University of Utah | http://www.itksnap.org/pmwiki/pmwiki.php |
| GIMIAS | GUI software for biomedical image computing. Manual segmentation plugin is supported. | Windows, Linux | University of Sheffield | http://www.gimias.org/ |
| MRICron | GUI software for NIFIT format image viewer. It also supports volume rendering, ROI region drawing, and statistical tools | Windows, Linux, Mac | University of South Carolina | http://people.cas.sc.edu/rorden/mricron/index.html |
| Mango | Multi-platform image viewer supporting surface visualization, ROI editing, and image analysis | Windows, Linux, Mac | University of Texas Health | http://ric.uthscsa.edu/mango/index.html |
Table 2: List of open software for manual segmentation and visualization.
| Parameter | Description |
| –minAlpha | Minimum weight for internal force preserving Laplacian coordinates of template model (default: 1.0) |
| –maxAlpha | Maximum weight for internal force preserving Laplacian coordinates of template model (default: 5.0) |
| –thresholdAlpha | Threshold parameter to reduce the alpha weight gradually during the template deformation (default: 0.01) |
| –minRing | Minimum level of neighborhood (default: 1) |
| –maxRing | Maximum level of neighborhood (default: 3) |
| –edge | Weight parameter for external force (default: 0.1) |
| –intensity | Voxel value for target structure in segmentation mask |
| –range | Boundary search range (default: 5.0) |
| –init | Template model initialization using iterative closest algorithm (default: 1 (true)) |
Table 3: Parameters for the individual shape reconstruction.
| Name | Description | System | Organization | Link |
| MINC N3 | Non-parametric non-uniformity normalization (N3) method | Linux, Mac | McGill University | https://www.nitrc.org/projects/nu_correct |
| ANTs N4BiasCorrection | N4ITK: Improved N3 method in Advanced Normalization Tools (ANTs) software package | Windows, Linux, Mac | University of Pennsylvania | https://sourceforge.net/projects/advants/ |
| SkullStrippingToolkit | Skull stripping tool using a level-set based fusion method | Matlab | University of North Carolina | https://www.nitrc.org/projects/skulltoolkit |
| ROBEX | Skull stripping tool using a brain surface fitting method | Linux, Mac | University of California, Los Angeles | https://www.nitrc.org/projects/robex/ |
| FSL BET | Skull stripping tool in FSL pacakge | Linux, Mac, Windows | University of Oxford | https://fsl.fmrib.ox.ac.uk/fsl/fslwiki/BET |
| BrainSuite bse tool | Skull stripping tool in BrainSuite pacakge | Windows, Linux, Mac | University of Southern California | http://brainsuite.org/processing/surfaceextraction/bse/ |
Table 4: List of open software widely used for brain MR preprocessing and skull stripping.
Discussion
In summary, we have described the software pipeline for the shape analysis on brain structures including (1) MR image segmentation using open tools (2) individual shape reconstruction using a deformable template model, and (3) quantitative shape difference measurement via transitive shape correspondence with the template model. Statistical analysis under the false discovery rate (FDR) correction is performed with the shape deformity to investigate the significance of morphological changes of brain structures, associated with neuropathological processes.
Our modeling pipeline internally use in-house tools to construct a template model from subject images. The steps for the template construction are as follows: (i) Compute the group average mask via iterative alignment of subject images to an average image which evolves at each iteration. (ii) Generate a 3D surface mesh from the average mask using marching cubes method20. (iii) Resample the surface mesh using a mesh resampling using the ACVD tool (https://www.creatis.insa-lyon.fr/site/en/acvd.html). The number of the template model can be set in the ShapeModeling plugin.
The individual shape reconstruction is based on a progressive template deformation method. This method allows a large-to-small scale deformation to minimize the geometric distortions of the template model while restoring the individual shape details by propagating the template model to image boundaries. The deformation method is limited to the structures with spherical topology. Against this limitation, we have introduced structure-specific constraints in the shape modeling of brain third ventricle, which has a hole by interthalamic adhesion6. However, the structure-specific constraints are not supported by the current version of our software.
The individualized shape models are aligned in common space using the generalized Procrustes algorithm19. Here, we use the similarity transformation (isotropic scale, translation, and rotation) for the shape model normalization. The local shape differences are determined by the displacement vector between the corresponding vertices of the individual surface models and their mean shape model. The shape deformity at each vertex is computed as the signed Euclidean norm of the displacement vectors which are projected onto the vertex normal of the mean model. The detailed steps of the statistical shape analysis can be found here5.
For the accuracy evaluation of the shape modeling, we use 3 metrics: Dice coefficient, mean distance, and Hausdorff distance. The Dice coefficient represents volume overlap between the reconstructed model and the target segmentation mask. The mean distance is the average distance between them, and the Hausdorff distance is the maximal distance between them. Lower distances and higher Dice coefficient indicate better accuracy. For the hippocampus study5, the Dice coefficient was 0.85-0.9, the mean distance was around 0.3 mm, and the Hausdorff distance was 2 mm. However, these results depend on the volumes and shape details of target structure. Volume difference and surface roughness can be used as indicators for the accuracy and shape quality5.
For ease of use, we also distribute a Matlab script together for generating the list files and running the command line tools for each step. Currently, we have tested the tools in Linux, MacOS, and Windows. The significance of the in-house software is that it is fully automated for template-based shape modeling and measurement. We have validated its robustness and accuracy with various data sets of aging and Alzheimer's disease populations5. Furthermore, there are many approaches using the shape modeling method on different human organs.
Divulgations
The authors have nothing to disclose.
Acknowledgements
The work was funded by the National Research Foundation of Korea (JP as the PI). JK is funded by Kyungpook National University Research Fund; and MCVH is funded by the Row Fogo Charitable Trust and the Royal Society of Edinburgh. The hippocampal segmentation was adapted from in-house guidelines written by Dr. Karen Ferguson, at the Centre for Clinical Brain Sciences, Edinburgh, UK.
References
- Costafreda, S. G., et al. Automated hippocampal shape analysis predicts the onset of dementia in mild cognitive impairment. NeuroImage. 56 (1), 212-219 (2011).
- Platero, C., Lin, L., Tobar, M. C. Longitudinal Neuroimaging Hippocampal Markers for Diagnosing Alzheimer’s Disease. Neuroinformatics. , 1-19 (2018).
- Valdés Hernández, M. D. C., et al. Rationale, design, and methodology of the image analysis protocol for studies of patients with cerebral small vessel disease and mild stroke. Brain and behavior. 5 (12), e00415 (2015).
- Kalmady, S. V., et al. Clinical correlates of hippocampus volume and shape in antipsychotic-naïve schizophrenia. Psychiatry Research: Neuroimaging. 263, 93-102 (2017).
- Kim, J., Valdés Hernández, M. D. C., Royle, N. A., Park, J. Hippocampal Shape Modeling Based on a Progressive Template Surface Deformation and its Verification. IEEE Transactions on Medical Imaging. 34 (6), 1242-1261 (2015).
- Kim, J., et al. 3D shape analysis of the brain’s third ventricle using a midplane encoded symmetric template model. Computer Methods and Programs in Biomedicine. 129, 51-62 (2016).
- Kim, J., Ryoo, H., Valdés Hernández, M. D. C., Royle, N. A., Park, J. Brain Ventricular Morphology Analysis Using a Set of Ventricular-Specific Feature Descriptors. International Symposium on Biomedical Simulation. , 141-149 (2014).
- Valdés Hernández, M. D. C., et al. Hippocampal morphology and cognitive functions in community-dwelling older people: the Lothian Birth Cohort 1936. Neurobiology of Aging. 52, 1-11 (2017).
- Lee, P., Ryoo, H., Park, J., Jeong, Y. Morphological and Microstructural Changes of the Hippocampus in Early MCI: A Study Utilizing the Alzheimer’s Disease Neuroimaging Initiative Database. Journal of Clinical Neurology. 13 (2), 144-154 (2017).
- Cox, S. R., et al. Associations between hippocampal morphology, diffusion characteristics, and salivary cortisol in older men. Psychoneuroendocrinology. 78, 151-158 (2017).
- Sled, J. G., Zijdenbos, A. P., Evans, A. C. A nonparametric method for automatic correction of intensity nonuniformity in MRI data. IEEE Transactions on Medical Imaging. 17 (1), 87-97 (1998).
- Tustison, N. J., et al. N4ITK: improved N3 bias correction. IEEE Transactions on Medical Imaging. 29 (6), 1310-1320 (2010).
- Zhang, Y., Brady, M., Smith, S. Segmentation of brain MR images through a hidden Markov random field model and the expectation-maximization algorithm. IEEE Transactions on Medical Imaging. 20 (1), 45-57 (2001).
- Wardlaw, J. M., et al. Brain aging, cognition in youth and old age and vascular disease in the Lothian Birth Cohort 1936: rationale, design and methodology of the imaging protocol. International Journal of Stroke. 6 (6), 547-559 (2011).
- Morey, R. A., et al. A comparison of automated segmentation and manual tracing for quantifying hippocampal and amygdala volumes. NeuroImage. 45 (3), 855-866 (2009).
- Boccardi, M., et al. Survey of protocols for the manual segmentation of the hippocampus: preparatory steps towards a joint EADC-ADNI harmonized protocol. Journal of Alzheimer’s Disease. 26 (s3), 61-75 (2011).
- Winterburn, J., et al. High-resolution In Vivo Manual Segmentation Protocol for Human Hippocampal Subfields Using 3T Magnetic Resonance Imaging. Journal of Visualized Experiments. (105), e51861 (2015).
- MacLullich, A., et al. Intracranial capacity and brain volumes are associated with cognition in healthy elderly men. Neurology. 59 (2), 169-174 (2002).
- Gower, J. C. Generalized Procrustes analysis. Psychometrika. 40 (1), 33-51 (1975).
- Lorensen, W. E., Cline, H. E. Marching cubes: A high resolution 3D surface construction algorithm. ACM Siggraph Computer Graphics. , 163-169 (1987).

