Setting Limits on Supersymmetry Using Simplified Models
Summary
This paper demonstrates a protocol for recasting experimental simplified model limits into conservative and aggressive limits on an arbitrary new physics model. Publicly available LHC experimental results can be recast in this manner into limits on almost any new physics model with a supersymmetry-like signature.
Abstract
Experimental limits on supersymmetry and similar theories are difficult to set because of the enormous available parameter space and difficult to generalize because of the complexity of single points. Therefore, more phenomenological, simplified models are becoming popular for setting experimental limits, as they have clearer physical interpretations. The use of these simplified model limits to set a real limit on a concrete theory has not, however, been demonstrated. This paper recasts simplified model limits into limits on a specific and complete supersymmetry model, minimal supergravity. Limits obtained under various physical assumptions are comparable to those produced by directed searches. A prescription is provided for calculating conservative and aggressive limits on additional theories. Using acceptance and efficiency tables along with the expected and observed numbers of events in various signal regions, LHC experimental results can be recast in this manner into almost any theoretical framework, including nonsupersymmetric theories with supersymmetry-like signatures.
Introduction
One of the most promising extensions of the Standard Model, supersymmetry (SUSY)1-14, is the central focus of many searches by the LHC experiments at CERN. The data collected in 2011 are already sufficient to push the limits of new physics beyond those of any previous collider15-22. As new data arrive and the exclusions are pushed still farther, it will be increasingly important to clearly communicate to the physics community what regions of the extensive supersymmetric parameter space have been excluded. Current limits are typically set on constrained two-dimensional planes, which frequently do not represent the diverse available SUSY parameter space and are difficult to understand as limits on physical masses or branching fractions. A large set of simplified models23, 24 have been proposed for aiding in the understanding of these limits, and both ATLAS and CMS have provided exclusion results for several of these models15-20.
This paper demonstrates the application of these simplified model exclusions to a full new physics model using the example of the minimal supergravity (MSUGRA, also known as the CMSSM)25-30. This model is chosen in order to compare the limits set using simplified models to those published independently by the experiments. The procedure is sufficiently general to be extendable to any new physics model (NPM). As this represents the first attempt to "close the loop" and set limits on SUSY using simplified models, a number of assumptions about the applicability of limits on particular simplified models are explored, resulting in recipes for setting conservative and aggressive limits on theories that have not been examined by the LHC experiments.
For setting a limit in a NPM, three separate operations are required. First, the NPM must be deconstructed into its constituent pieces, separating the various production modes and decay modes for all new particles in the model. Second, a set of simplified models must be chosen to recreate the kinematics and relevant event topologies in the NPM. Third, the available limits on these simplified models must be combined in order to produce limits on the NPM. These three procedures are described in the protocol. Some additional approximations are also provided that may expand the applicability of the already-available simplified models to a broader range of event topologies.
A complete NPM typically involves many production modes and many possible subsequent decays. The deconstruction of new physics models into their components and the application of simplified model limits to those components allows the construction of an exclusion limit directly. For any signal region, the most conservative limit can be set using the production fraction P(a,b) (where a,b represents the simplified model sparticle production mode) of events identical to a simplified model i and the branching fraction for the produced sparticles to decay in the manner described by the simplified model†, BRa→ i x BRb → i. The expected number of events in a given signal region from these simple topologies can then be written as

where the sum is over simplified models, σtot is the total cross section for the NPM point, Lint is the integrated luminosity used in the search, and AEa,b → i is the acceptance times efficiency for the simplified model events in the signal region being considered. This number can be compared to the expected 95% confidence level upper limit on the number of new physics events to select the optimal search region. The model can then be excluded if N is larger than the observed number of new physics events excluded at the 95% confidence level. Exclusions in nonoverlapping regions may be combined if information about the correlations of their uncertainties is available. If this information is not available, the best signal region or analysis that provides the best expected limit can be used to attempt to exclude the model.
In order to construct concrete limits with this method, the Aε for various simplified models must be made available by the LHC experiments. Both CMS and ATLAS have published figures with the Aε for several models, and a few of the figures are available in the HepData database31. In order to demonstrate the value of publishing all such tables, we feel it is important to provide concrete limits that are comparable to those already published. Therefore we use (and describe in the protocol as an optional step) a fast detector simulation to emulate the effect of the ATLAS or CMS detector. The Aε derived from the Pretty Good Simulation (PGS)32 is compared to that published by ATLAS in a simplified model grid in Figure 1. These results are sufficiently close to one another (within roughly 25%) that, rather than wait for all results to be public, Aε results for the remaining grids are derived using PGS and used directly in the remainder of this paper. As the number of publicly available simplified model Aε results grows, the need for such approximations should be significantly reduced.
Two conservative assumptions allow the inclusion of a larger number of production and decay modes in the limit. The first is that for associated production the experimental Aε is at least as high as the Aε for the worse of the two production modes. For inclusive searches, this is generally a good assumption. The minimum expected number of events would then be

where the first sum runs over all production modes, and only those where a and b are exactly those particles from the simplified model are included in Equation 1. Similarly, the Aε for decays with different legs can be assumed to be at least as high as the Aε for the worse of the two legs. That is,

where diagrams with different decays on either side have now been included.
Two further assumptions would allow the setting of stricter limits. One can assume that the experimental Aε for all production modes in the theory is similar to the average Aε for the production modes covered by simplified models. In that case, the expected number of events can instead be written as

where the sums are both over only those production modes covered by simplified models. One might further assume that the Aε for all decay modes in the theory is similar to the average Aε for those events covered by the simplified model topologies. Then the expected number of events may be written as:

where again the sums run only over the simplified models. Clearly, the most aggressive MSUGRA limit is provided under this assumption, and a limit set in this manner risks claiming exclusion for regions that would not, in fact, be excluded at the 95% confidence level by a dedicated search. Although the accuracy of these two approximations might be suspect, if the inclusive event kinematics of the simplified models compare favorably to a complete SUSY parameter space point, they may not be unreasonable.
† Some simplified models now used at the LHC include associated production. While not explicitly discussed here, the equations can be trivially extended to allow for this case.
Protocol
1. Model Deconstruction
- Generate proton-proton collision events covering a plane in the parameter space of the NPM. Any event generator configuration that includes a parton shower and hadronization model can be used. In the case of MSUGRA for example, the mass spectra are generated using Isasugra33, and the branching fractions and decay widths are calculated using MSSMCalc34. For the event generation itself, MadGraph 5 1.3.934 with CTEQ 6L1 parton density functions35 is used to generate matrix-element events, since it includes additional radiation in the matrix element, which can be important for small mass-splitting scenarios. In order to mimic the LHC experiments' choices of leading-order generators for MSUGRA, the additional radiation in the MadGraph matrix element is disabled when generating MSUGRA events. Pythia 6.42536 is then used for SUSY particle (sparticle) decay, parton showering, and hadronization. Extensive documentation for any of these programs is readily available on the web.
- In order to mimic an LHC detector, pass the events through PGS with an LHC-detector parameter card. The ATLAS and CMS detector cards included with MadGraph 534 perform well enough for search reach analysis. Where available, the experiments' parameterizations of identification and performance made public with some analyses can be used. Ideally, the experiments will provide full maps of acceptance and efficiency for a number of simplified model grids, in which case these can be used directly and this step is unnecessary.
- In order to analyze the results quickly, an intermediate light-weight data format is desirable. Extracting the jets, stable leptons, missing transverse energy, and any other necessary final-state objects from the PGS output (e.g. using ExRootAnalysis34) in a convenient format is recommended.
- In order to classify the results, correlate the PGS event results with the portion of the generator event record necessary to classify the sparticle production and decay modes for each event. Keep track of all particle masses, production mechanisms, and decay chains as well as their respective counts in order to be able to calculate their corresponding branching fraction.
- Calculate the best available production cross-section calculations for the model of interest. In the case of MSUGRA, next-to-leading order cross-sections for each point can be calculated using Prospino 2.137 with NLL-Fast38 using CTEQ 6.6 NLO PDFs.
2. Model Reconstruction
- Based on the breakdown from the model deconstruction, choose a dictionary of simplified models so as to cover at least 50% of the open production and decay modes of the NPM. Because of the rapidly falling cross-section of most BSM models with mass, a factor of two in acceptance typically represents only 20-50 GeV in the limit, making this sufficiently close to be within the experimental and theoretical uncertainties. Most direct decay and one-step decay models, including off-shell/three-body decays, have been considered by the LHC experiments. CMS has collected a number of simplified model exclusion results in a single paper21. Both ATLAS and CMS have also considered a number of heavy-flavor simplified models. The full list of models has not been made publicly available in a single place. However, the results are available from the two experiments' public webpages39, 40. These are the simplified models that should be selected from for reconstruction of the NPM.
- In order to test the quality of the simplified model coverage, compare the kinematics of a few representative NPM points with those resulting from the simplified models used to reproduce that point. For a given NPM point, construct the relevant simplified models with the appropriate masses.
- Assign a weight to each model type that includes the production fraction represented by that simplified model times the branching fraction for the decay represented by that model.
- For associated production, if only pair-production simplified models are considered, divide the weight between the two relevant simplified models.
- It is recommended to apply a set of physically-motivated simplifications to the NPM event topologies in order to group similar production- and decay-modes.
- Normalize the sum of the weights for all the simplified models to unity.
- Calculate the kinematic distributions for the representative NPM points using the event generation procedure described in the previous protocol.
- If the kinematics of the NPM point after typical signal selections differ by more than σ (30%) from those of the combined simplified models, include additional simplified models to improve the production and decay phase-space coverage. Discrepancies on the 15% level have negligible impact on the final exclusion results because of the rapidly falling cross-sections in most new physics models.
3. Limit Construction
- Obtain the available and relevant Aε and 95% confidence level upper limit on the number of new physics events for the simplified models being considered in each experimental signal region that can be applied.
- Apply Equations 1 and 3-5 to the NPM of interest at each parameter space point to determine under which (if any) assumptions the point is excluded.
- Use the limit set by the signal region with the best expected performance, unless correlations between the signal regions' background uncertainties are available so that the regions can be properly combined‡.
- With the comparison of kinematics performed with the previous protocol and the spread of the exclusion contours, determine the range in which the experimental exclusion should lie.
‡ At present, no such correlations are available.
Representative Results
Having applied the model deconstruction step to a point in the parameter space of MSUGRA, a breakdown of the output can be best visualized by counting up the various production and decay modes for every generated event and plotting the corresponding production rates and branching fractions according to the relative frequencies. The branching fractions for the various production and decay modes for representative MSUGRA points are illustrated in Figures 2 and 3. A large number of similar figures for other points in SUSY parameter space are available online41.
For the case of MSUGRA, some trends across the phase space are present, as demonstrated in Figure 4. Squark production dominates in the low-m0, high-m1/2 region, and gluino production dominates in the high-m0, low-m1/2 region. In the region where squark production dominates, direct squark decays to the lightest supersymmetric particle (LSP) are favored. In regions where gluino production dominates, however, direct decays of the gluino to the LSP never comprise more than ~30% of the total decay phase space. In the interjacent region, direct chargino production makes up a nonnegligible contribution, especially towards high m0 and high m1/2 where the squarks and gluinos are all heavy. This MSUGRA plane, therefore, can be covered by five simplified model (SM) scenarios:
- Pair-production of squarks, which directly decay to the LSP via the emission of a quark (SM 1);
- Pair-production of gluinos, which directly decay to the LSP via the emission of a two quarks (SM 2);
- Pair-production of squarks, which decay in one-step to the LSP. The squark decays to a chargino via the emission of a quark, and the chargino decays to the LSP via emission of a W-boson (SM 3);
- Pair-production of gluinos, which decay in one-step to the LSP. The gluino decays to a chargino via the emission of two quarks, and the chargino decays to the LSP via emission of a W-boson (SM 4); and
- Pair-production of charginos, which directly decay to the LSP via the emission of a W-boson (SM 5).
The fraction of MSUGRA events classified as belonging to one of these five simplified models is shown in Figure 5. For the MSUGRA example, the following additional simplifying approximations are made: When the squark decays to the gluino, the gluino decay is counted in classifying the event topology, and the decay of the squark to the gluino is counted as an additional jet in the event ("plus jets"), as though it were identical to initial- or final-state radiation. When the gluino decays through a squark  →q
→q ,
, →q
→q![]() however, the final state of the decay still appears as though the gluino had produced two jets and decayed directly, omitting the squark-step, save some (small) differences in kinematics. For these cases, therefore, the decay chain is classified as though the gluino decayed via the emission of a pair of quarks with no intermediate squark (
however, the final state of the decay still appears as though the gluino had produced two jets and decayed directly, omitting the squark-step, save some (small) differences in kinematics. For these cases, therefore, the decay chain is classified as though the gluino decayed via the emission of a pair of quarks with no intermediate squark ( →qq
→qq![]() ), rather than classifying it as the squark decay with an additional initial- or final-state radiation-like jet (
), rather than classifying it as the squark decay with an additional initial- or final-state radiation-like jet ( →q
→q![]() plus jet(s)). Associated squark-gluino production is divided evenly among the squark and gluino simplified models. With these approximations, it is possible to classify a large fraction of SUSY events as one of the five simplified models under consideration. This is the first step towards the model reconstruction.
plus jet(s)). Associated squark-gluino production is divided evenly among the squark and gluino simplified models. With these approximations, it is possible to classify a large fraction of SUSY events as one of the five simplified models under consideration. This is the first step towards the model reconstruction.
The event kinematics for two MSUGRA parameter space points, along with a combination of simplified models used to mimic them, are shown in Figures 6, 7, and 8. These two points are deconstructed using the method described above, and the five selected simplified models are constructed and combined according to the mass spectra, production rates, and branching fractions of the points. The simplified model events were generated and analyzed in a manner identical to the MSUGRA events. Here, four of the key kinematic variables used in LHC supersymmetry searches are shown: leading jet transverse momentum (pT), lepton pT, missing transverse energy, and effective mass, defined as the scalar sum of the transverse momenta of the four leading jets and the lepton. Two features are visible in the effective mass, leading jet, and missing transverse energy distributions, corresponding to strong production and weakino production. In these inclusive distributions, some discrepancies are clearly visible. The low-pT lepton tail, for example, is predominantly from tau decays that are not covered by any of the simplified models. The low missing transverse energy, low effective mass region is in part from LSP-X associated production, which is not modeled. Most kinematic features are described well enough by PGS for the purposes of a search in a parameter space with rapidly falling background. Tau fake rates remain a significant challenge to a parameterization of tau analysis results, and completely addressing that issue is beyond the scope of this protocol.
However, the cuts of most signal regions used at the LHC are such that simple decay topologies are selected over the more complex, often softer or higher multiplicity events. Thus, signal region selection tends to improve the description of event kinematics by simplified models. Comparison in a one-lepton region similar to that used in a recent ATLAS SUSY search16 are shown in Figures 7 and 8. The agreement in both shape and tails is significantly better. The kinematics for the simplified models compare well to the inclusive SUSY model kinematics, suggesting that the efficiency and acceptance for a complete SUSY point may be well described by a limited combination of simplified models. Of course, the kinematics of only those SUSY events corresponding to topologies described by the simplified models are identical to their simplified model counterparts. This serves as a confirmation that those events not covered by these simplified models are either a small fraction of the total events or kinematically similar to those that are covered. This completes the model reconstruction step in the case of MSUGRA.
The limit-setting procedure under section 3 is then applied to the MSUGRA plane with tan β=10, A0=0 and μ>0, using signal regions from the ATLAS zero-lepton search16. Five signal regions are included in this search, and the signal region with the best expected limit is used for each point. A point is considered to be excluded if the number of expected SUSY events in the optimal signal region exceeds the observed 95% confidence level upper limit on new physics events in that signal region. The results of the simplified model exclusion are compared to the zero-lepton exclusion without systematic uncertainties on the signal, as discussed previously, in Figure 9. Four simplified model exclusion curves are shown, corresponding to Equations 1 and 3-5. In comparison to the zero-lepton exclusion limit, the most conservative simplified-model-based approach does rather poorly in the region dominated by 
 and weakino associated production, missing the correct limit by up to ~100 GeV. This is also in part due to the relatively complicated decay of the gluino (c.f. the large number of open modes in Figure 3). The coverage is much closer to the true limit for the region dominated by
 and
and 
 production, for which the simplified model-derived limit is within 40 GeV of the true limit.
This prescription omits the treatment of theoretical uncertainties on the signal model. In fact, the LHC experiments currently do not treat these uncertainties in a consistent way, nor are all of the uncertainties included. No experiment, for example, includes any uncertainty in the calculation of visible masses from the GUT scale parameters. The limits that are presented here, therefore, should be expected to differ from the published limits. In Figure 10, the published ATLAS exclusion limits in the zero-lepton channel are compared to those obtained here without any systematic uncertainty on the signal. The limit without signal uncertainties is clearly higher than the published limit. For the remainder of the paper, the limit without systematic uncertainties on the signal will be taken as the "correct answer" to be arrived at using simplified models. The theoretical uncertainty can be added to both in the same way and will affect both limits in approximately the same way.
In order to portray the results achievable with present resources as accurately as possible, simplified model points are generated on a grid corresponding roughly to that already in use by the ATLAS experiment17. Between these points, Aε is interpolated in the two-dimensional msquark / mgluino = mLSP grid. Because SM 3 and SM 4 are three dimensional grids, and because it is unlikely that experiments will provide full three-dimensional Aε, three values of intermediate chargino mass are used: mchargino= x × (msquark/gluino–mLSP) + mLSP, x=0.25, 0.5, and 0.75. To interpolate between these three two-dimensional planes, a simple quadratic fit is used. When approaching the boundaries of mLSP = mchargino and msquark/gluino, the decay modes naturally turn off, making more complicated interpolation unnecessary.
From comparing the exclusion curves, one can indeed see that a conservative exclusion limit set using Eq. 1 follows the "correct" exclusion limit quite well in regions of phase space that are well-covered by simplified models (c.f. Figure 5). In regions that are not as well covered, Eq. 3 still provides a conservative limit. The aggressive limit set by Eq. 5 overestimates the exclusion by up to 40 GeV in the squark-dominated region and by up to 100 GeV in the gluino-dominated region of phase space, because the assumption that the long gluino decay chains are well-modeled by the shorter chains of the simplified models is invalid at some level. In terms of parameter-space coverage, the conservative limits under-cover by 20%, the middle two limits under-cover by 10%, and the aggressive limit over-covers by 10%. Naturally, expanding the dictionary of simplified models available would improve the conservative limit and reduce the aggressive limit as more correct Aε are included for more production and decay modes. However, even with this small number of simplified models, the conservative limits set are close to the "correct" result.
For demonstrative purposes, limits are also placed on an MSUGRA signal region at high tan β. The limits are shown in Figure 11. Based on the agreement observed in Figure 10, the experimental exclusion should lie a bit beyond the exclusion set by Eq. 3.
In extrapolating to more exotic theories, or even in expanding the applicability of a small list of simplified models to SUSY theories, several approximations can be made:
- That heavy-flavor jets are identical to light flavor jets for searches that do not include flavor tagging;
- That photons are identical to jets for searches that do not identify photons;
- That more than half the time, chargino (neutralino) decays to the LSP via emission of a W-boson (Z-boson) produce a signature functionally identical to gluino decays via emission of two quarks.
Such approximations are physically well motivated and should result in limits that are still in agreement with the full experimental results.

Figure 1. Left, the public Aε for the ATLAS three jet "loose" one-lepton signal region17. Right, the same reproduced in the MadGraph + Pythia + PGS setup used here. Some differences are to be expected from the different generators and higher statistics used here, but the two follow one another closely. Click here to view larger figure.
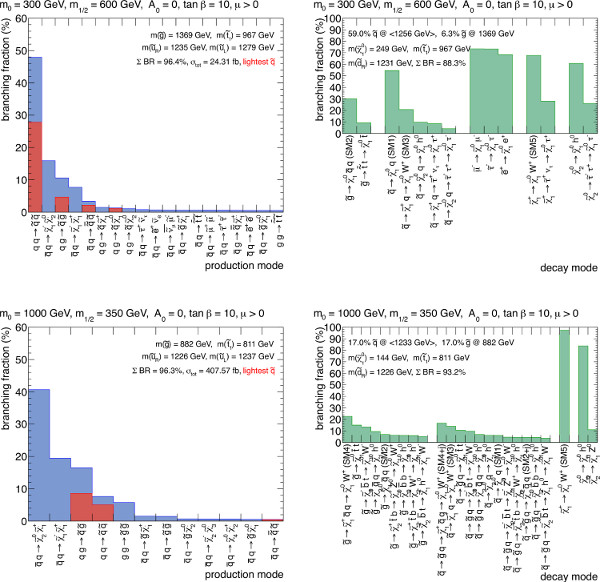
Figure 2. Branching ratios for SUSY production mechanisms and decay modes in the MSUGRA parameter space. The top row (m0=300 GeV, m1/2=600 GeV, tan(β)=10, A0 = 0 GeV, and μ > 0) is typical for the region in parameter space that is dominated by squark production, and the bottom row (m0=1,000 GeV, m1/2=350 GeV, tan(β)=10, A0 = 0 GeV, and μ > 0) is typical for the region in parameter space lying somewhat in between the two extremes. For clarity, production and decay modes are only listed if their branching fraction is greater than 0.5%. The labels "SM" with a number are given to decay modes corresponding to the simplified models discussed in the model reconstruction protocol. Click here to view larger figure.
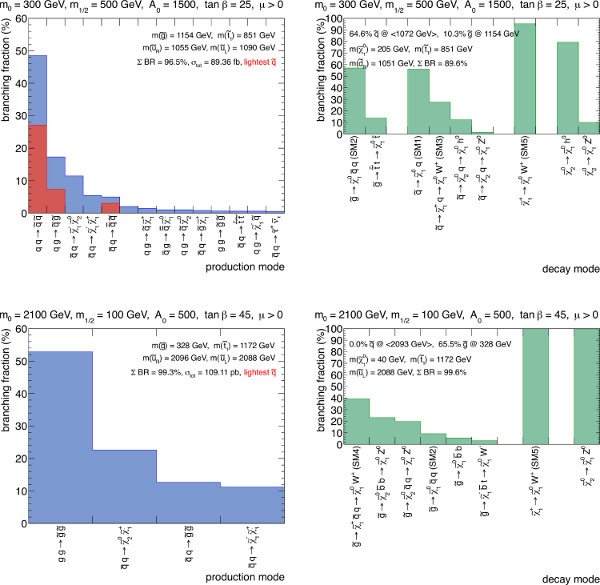
Figure 3. Branching ratios for SUSY production mechanisms and decay modes in the MSUGRA parameter space. The top row (m0=300 GeV, m1/2=500 GeV, tan(β)=25, A0 = 1,500 GeV, and μ > 0) is typical for the region in parameter space that is dominated by squark production, and the bottom row (m0=2,100 GeV, m1/2=100 GeV, tan(β)=45, A0 = 500 GeV, and μ > 0) is typical for the region dominated by gluino production. For clarity, production and decay modes are only listed if their branching fraction is greater than 0.5%. The labels "SM" with a number are given to decay modes corresponding to the simplified models discussed in the model reconstruction protocol. The models in the white regions had no events described by simplified models, with limited Monte Carlo statistics. Click here to view larger figure.
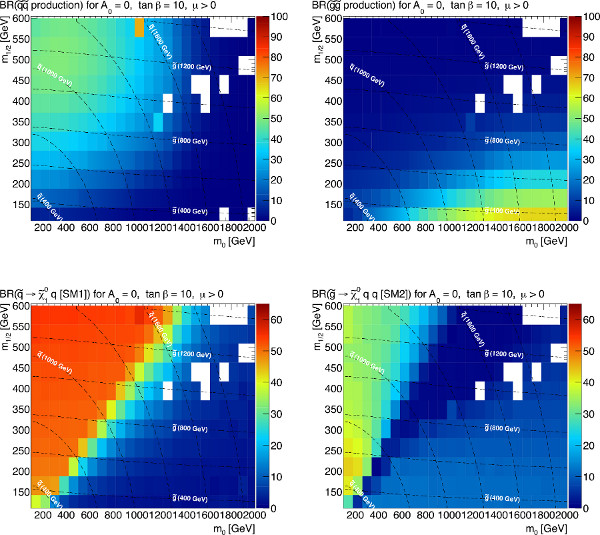
Figure 4. Variation of the branching ratios, in percent, of the main SUSY production and decay modes in the MSUGRA parameter space with tan(β)=10, A0 and μ > 0. The upper right corner, where the strong sparticles are heavy, includes a significant contribution from weakino production. The models in the white regions had no events described by simplified models, with limited Monte Carlo statistics. Click here to view larger figure.
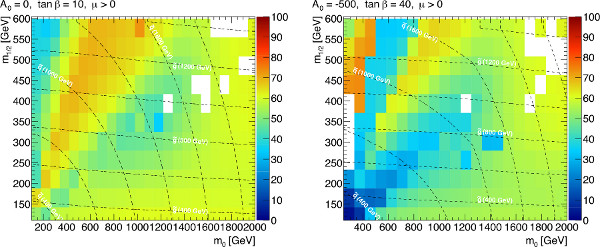
Figure 5. The percentage of MSUGRA events classified as belonging to one of the five simplified models considered in this paper, for low-tan(β) (left) and high-tan(β) (right). Click here to view larger figure.

Figure 6. Kinematics of a squark-production-dominated MSUGRA point (m0=300 GeV, m1/2=600 GeV, tan(β)=10, A0 = 0 GeV, and μ > 0) and a set of five simplified models constructed using the same mass spectrum. Clockwise from the top left, leading jet pT, leading muon pT, effective mass, and missing transverse energy. No signal selection has been applied. Click here to view larger figure.
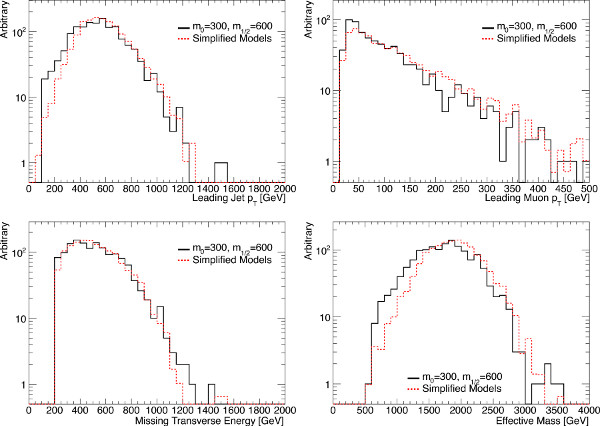
Figure 7. Kinematics of a squark-production-dominated MSUGRA point (m0=300 GeV, m1/2=600 GeV, tan(β)=10, A0 = 0 GeV, and μ > 0) and a set of five simplified models constructed using the same mass spectrum. Clockwise from the top left, leading jet pT, leading muon pT, effective mass, and missing transverse energy. A signal selection similar to the one-lepton four-jet "tight" ATLAS SUSY search has been applied. Click here to view larger figure.
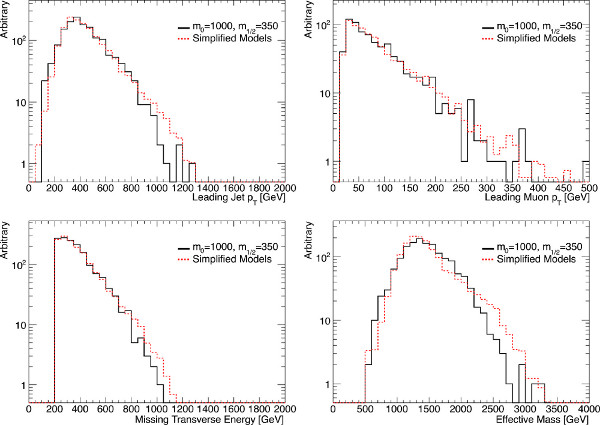
Figure 8. Kinematics of a complex MSUGRA point (m0=1,000 GeV, m1/2=350 GeV, tan(β)=10, A0 = 0 GeV, and μ > 0) and a set of five simplified models constructed using the same mass spectrum. Clockwise from the top left, leading jet pT, leading muon pT, effective mass, and missing transverse energy. A signal selection similar to the one-lepton four-jet "tight" ATLAS SUSY search has been applied. Click here to view larger figure.
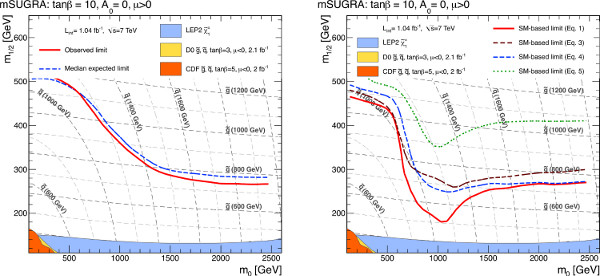
Figure 9. Combined zero-lepton exclusion limits for MSUGRA models with tan β=10, A0=0 and μ > 0 (10a) in comparison with the exclusion limit obtained using simplified models only (10b). The signal region providing the best expected limit is taken for a given point in parameter space. The expected 95% confidence level limit is shown as a dashed blue line, and the observed limit is shown as a solid red line. Results from previous searches are also shown for comparison purposes42-48, although some of these limits were produced using slightly different parameter choices. The simplified model limits are generated using four different sets of assumptions, corresponding to the limit equations in the main text. Click here to view larger figure.
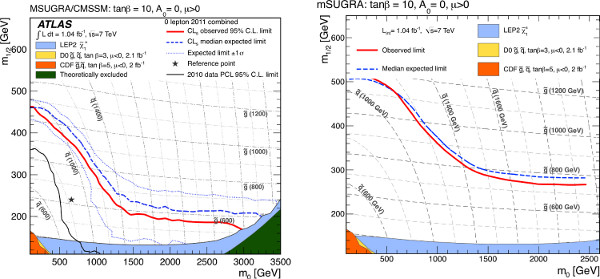
Figure 10. Combined zero-lepton exclusion limits for MSUGRA models with tan β=10, A0=0 and μ > 0 16 (left) in comparison with the exclusion limit obtained using PGS and without a systematic uncertainty on the signal. The signal region providing the best expected limit is taken for a given point in parameter space. The expected 95 % confidence level limit is shown as a dashed blue line, and the observed limit is shown as a solid red line. Results from previous searches are also shown for comparison purposes42-48, although some of these limits were produced using slightly different parameter choices. Click here to view larger figure.
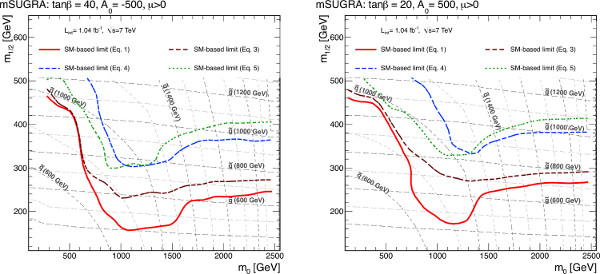
Figure 11. Exclusion limits for MSUGRA models with tan β = 40, A0 = -500 GeV and μ > 0 (left) and tan β = 20, A0 = 500 GeV and μ > 0 (right) obtained using simplified models only. Combined limits are obtained by using the signal region that generates the best expected limit at each point in parameter space. The simplified model limits are generated using four different sets of assumptions, corresponding to the limit equations in the main text. Click here to view larger figure.
Discussion
The application of simplified model limits to produce an exclusion contour in a complete new physics model has been demonstrated. Despite the apparent complexity of MSUGRA parameter space points, the kinematics can be well-reproduced by a combination of only a small number of simplified models. The kinematic agreement is further improved when looking within a particular signal region, since the searches thus far conducted at the LHC tend to favor simplified model-like event topologies with a (relatively) small number of high-pT objects.
The exclusion contours derived from simplified models compare favorably with those already published with dedicated searches. With this procedure, it is possible to trivially recast exclusion results into more exotic SUSY theories, or even into nonSUSY theories with signatures covered by simplified models. This method additionally allows a simple route for preservation of the data and application of current searches to future theories.
Practically, this approach means a significant resource saving for the LHC experiments and a great benefit to LHC theorists and phenomenologists. By recasting theories using information available from the matrix element and decay probabilities, no computing-intensive simulation of the model must be done. Instead, the experiments are free to straightforwardly provide exclusion results in a large variety of theoretical models that include – but may not be completely covered by – simple final state signatures. Similarly, theorists need not wait for the LHC experiments to produce limits in their favored model. Although the simplified models may not cover all the production and decay modes of a model, with a relatively small number of simplified models it is possible to cover a fairly broad range of possibilities. The exclusions acquired in this manner do not precisely overlap the results of a complete experimental search. In the current LHC search era, however, they give a critical and surprisingly accurate estimation of how much theory space has already been excluded by the already conducted searches, and how much may still be open to discovery.
Divulgations
The authors have nothing to disclose.
Acknowledgements
The authors would like to thank Jay Wacker for significant discussion of simplified models and potential pitfalls. Many thanks also to Max Baak and Till Eifert for constructive criticism and encouragement whenever it was necessary. Thanks to the CERN Summer Student Program for making this collaboration possible.
References
- Miyazawa, H. Baryon Number Changing Currents. Prog. Theor. Phys. 36, 1266-1276 (1966).
- Ramond, P. Dual Theory for Free Fermions. Phys. Rev. D. 3, 2415-2418 (1971).
- Gol’fand, Y. A., Likhtman, E. P. Extension of the Algebra of Poincare Group Generators and Violation of P invariance. JETP Lett. 13, 323-326 (1971).
- Neveu, A., Schwarz, J. H. Factorizable dual model of pions. Nucl. Phys. B. 31, 86-112 (1971).
- Gervais, J. L., Sakita, B. Field theory interpretation of supergauges in dual models. Nucl. Phys. B. 34, 632-639 (1971).
- Neveu, A., Schwarz, J. H. Quark Model of Dual Pions. Phys. Rev. D. 4, 1109-1111 (1971).
- Volkov, D. V., Akulov, V. P. Is the neutrino a goldstone particle. Phys. Lett. B. 46, 109-110 (1973).
- Wess, J., Zumino, B. A lagrangian model invariant under supergauge transformations. Phys. Lett. B. 49, 52-54 (1974).
- Wess, J., Zumino, B. Supergauge transformations in four dimensions. Nucl. Phys. B. 70, 39-50 (1974).
- Fayet, P. Supersymmetry and Weak, Electromagnetic and Strong Interactions. Phys. Lett. B. 64, 159-162 (1976).
- Fayet, P. Spontaneously Broken Supersymmetric Theories of Weak, Electromagnetic and Strong Interactions. Phys. Lett. B. 69, 489-494 (1977).
- Farrar, G. R., Fayet, P. Phenomenology of the Production, Decay, and Detection of New Hadronic States Associated with Supersymmetry. Phys. Lett. B. 76, 575-579 (1978).
- Fayet, P. Relations Between the Masses of the Superpartners of Leptons and Quarks, the Goldstino Couplings and the Neutral Currents. Phys. Lett. B. 84, 416-420 (1979).
- Dimopoulos, S., Georgi, H. Softly Broken Supersymmetry and SU(5. Nucl. Phys. B. 193, 150-162 (1981).
- The ATLAS Collaboration. Search for squarks and gluinos with the ATLAS detector in final states with jets and missing transverse momentum using 4.7 fb-1 of √s = 7TeV proton-proton collisions. Phys. Rev. D. , .
- The ATLAS Collaboration. Search for squarks and gluinos using final states with jets and missing transverse momentum with the ATLAS detector in √s = 7TeV proton-proton collisions. Phys. Lett. B. 710, 67-85 (2012).
- The ATLAS Collaboration. Further search for supersymmetry at √s=7 TeV in final states with jets, missing transverse momentum and isolated leptons with the ATLAS detector. Phys. Rev. D. , .
- The CMS Collaboration. Search for new physics in the multijet and missing transverse momentum final state in proton-proton collisions at sqrt(s) = 7 TeV. Phys. Rev. Lett. 109, 171803 (2012).
- The CMS Collaboration. Search for supersymmetry in pp collisions at √s=7 TeV in events with a single lepton, jets, and missing transverse momentum. J. High Energy Phys. 08, 165 (2011).
- The CMS Collaboration. Search for supersymmetry in events with b-quark jets and missing transverse energy in pp collisions at 7 TeV. Phys. Rev. D. 86, 072010 (2012).
- The CMS Collaboration. 2012 Report No.: CMS-PAS-SUS-11-016. Interpretation of Searches for Supersymmetry. , (2012).
- The CMS Collaboration. Search for new physics in events with opposite-sign leptons, jets, and missing transverse energy in pp collisions at sqrt(s = 7 TeV. Phys. Lett. B. 718, 815 (2012).
- Alves, D., et al. Where the Sidewalk Ends: Jets and Missing Energy Search Strategies for the 7 TeV LHC. JHEP. 1110, 012 (2011).
- Alves, D., et al. Simplified Models for LHC New Physics Searches. J. Phys. G.: Nucl. Part. Phys. 39, 105005 (2012).
- Chamseddine, A. H., et al. Locally Supersymmetric Grand Unification. Phys. Rev. Lett. 49, 970-974 (1982).
- Barbieri, R., et al. Gauge models with spontaneously broken local supersymmetry. Phys. Lett. B. 119, 343-347 .
- Ibanez, L. E. Locally supersymmetric SU(5) grand unification. Phys. Lett. B. 118, 73 (1982).
- Hall, L. J., et al. Supergravity as the messenger of supersymmetry breaking. Phys. Rev. D. 27, 2359-2378 (1983).
- Ohta, N. Grand Unified Theories Based on Local Supersymmetry. PTP. 70, 542-549 (1983).
- Chung, D. J. H., et al. The soft supersymmetry-breaking Lagrangian: theory and applications. J. Phys. Rept. 407, 1-203 (2005).
- Alwall, J. MadGraph 5: Going Beyond. JHEP. 1106, 128 (2011).
- Pumplin, J. New Generation of Parton Distributions with Uncertainties from Global QCD Analysis. JHEP. 0207, 012 (2002).
- Sjöstrand, T., Mrenna, S., Skands, P. Pythia 6.4 Physics and Manual. JHEP. 05, 026 (2006).
- . PhysicsResultsSUS < CMSPublic < TWiki [Internet] Available from: https://twiki.cern.ch/twiki/bin/view/CMSPublic/PhysicsResultsSUS
- . SupersymmetryPublicResults < AtlasPublic < TWiki [Internet] Available from: https://twiki.cern.ch/twiki/bin/view/AtlasPublic/SupersymmetryPublicResults (2013)
- Collaboration, D. 0. Search for Squarks and Gluinos in pp̄ collisions at √s=1.8TeV. Phys. Rev. Lett. 75, 618-623 (1995).
- Collaboration, C. D. F. Search for Gluinos and Scalar Quarks in pp̄ collisions at √s=1.8TeV using the Missing Energy plus Multijets Signature. Phys. Rev. Lett. 88, 041801 (2002).
- Collaboration, C. D. F. Inclusive Search for Squark and Gluino Production in pp̄ Collisions at√s=1.96TeV. Phys. Rev. Lett. 102, 121801 (2009).
- Collaboration, D. 0. Search for squarks and gluinos in events with jets and missing transverse energy using 2.1fb-1 of pp̄ collision data at √s=1.96TeV. Phys. Lett. B. 660, 449-457 (2008).
- Collaboration, D. E. L. P. H. I. Searches for supersymmetric particles in e+e-collisions up to 208 GeV and interpretation of the results within the MSSM. Eur. Phys. J. C. 31, 421-479 (2003).
- Collaboration, L. 3. Search for Scalar Leptons and Scalar Quarks at LEP. Phys. Lett. B. 580, 37-49 (2004).
- Collaboration, A. T. L. A. S. Search for squarks and gluinos using final states with jets and missing transverse momentum with the ATLAS detector in √s=7TeV proton-proton collisions. Phys. Lett. B. 701, 186-203 (2011).

