Imaging and Quantification of Intact Neuronal Dendrites via CLARITY Tissue Clearing
Summary
Neuronal dendritic morphology often underlies function. Indeed, many disease processes that affect the development of neurons manifest with a morphological phenotype. This protocol describes a simple and powerful method for analyzing intact dendritic arbors and their associated spines.
Abstract
Brain activity, the electrochemical signals passed between neurons, is determined by the connectivity patterns of neuronal networks, and from the morphology of processes and substructures within these neurons. As such, much of what is known about brain function has arisen alongside developments in imaging technologies that allow further insight into how neurons are organized and connected in the brain. Improvements in tissue clearing have allowed for high-resolution imaging of thick brain slices, facilitating morphological reconstruction and analyses of neuronal substructures, such as dendritic arbors and spines. In tandem, advances in image processing software provide methods of quickly analyzing large imaging datasets. This work presents a relatively rapid method of processing, visualizing, and analyzing thick slices of labeled neural tissue at high-resolution using CLARITY tissue clearing, confocal microscopy, and image analysis. This protocol will facilitate efforts toward understanding the connectivity patterns and neuronal morphologies that characterize healthy brains, and the changes in these characteristics that arise in diseased brain states.
Introduction
Understanding the spatial organization, patterns of connectivity, and morphology of complex three-dimensional biological structures is essential for delineating the functions of specific cells and tissues. This is especially true in neuroscience, in which tremendous effort has been dedicated to building high-resolution neuroanatomical maps of the central nervous system1,2. Close examination of the neurons that comprise these maps yields varied morphologies, with connections and locations that reflect the function of these diverse sets of neurons3,4. Moreover, investigation of subcellular structures, especially dendritic spines, can inform the maturity of synapses, thereby reflecting developmental processes and neurological disease states5,6,7. Thus, approaches that improve imaging resolution and throughput are essential toward better understanding brain function at all scales.
Recent advances have expanded the molecular and genetic toolkit for marking and manipulating populations of neurons. The development of new fluorescent markers, combined with new methods of introducing these markers into neurons, allows for differential labeling of populations of interacting neurons within the same animal or brain sample8,9,10,11. Because light is scattered by opaque lipids, and given the high lipid content of brain tissue, imaging neuronal populations has primarily been limited to thin sections or has relied on advanced microscropy techniques (e.g., confocal, multi-photon, and light-sheet microscopy) to image deep structures. However, these efforts have been greatly bolstered by advances in tissue clearing techniques. Clear Lipid-exchanged Acrylamide-hybridized Rigid Imaging/immunostaining/in situ hybridization-compatible Tissue-hYdrogel (CLARITY) is one such technique, in which tissues of interest are infused with hydrogel monomers (acrylamide and bis-acrylamide) and then washed with detergents12. The hydrogel monomers hybridize to create a stable 3D hydrogel scaffold that is optically transparent and permeable to macromolecule labels. Nucleic acids and proteins are maintained within the hybridized matrix, whereas lipids are removed by the detergent washes (Figure 1). This results in a stable tissue that is rigid enough to maintain the original shape and orientation of cells and non-lipid molecules, while optically transparent enough to easily image deep structures at high resolution. This maintenance of tissue structure and orientation allows for the imaging of thick slices, thereby preserving cell-to-cell connections and spatial relationships. Moreover, because the location and availability of proteins and nucleic acids is maintained during the clearing process, cleared tissues are able to hold expression-based markers, as well as exogenous labels. Thus, CLARITY lends itself as a potent method for imaging large amounts of deep brain structures and the connections between these structures at high resolution.
The use of CLARITY greatly improves approaches to imaging neuronal populations. This technique is especially adept at generating large amounts of imaging data. CLARITY works well with multiple forms of protein-based fluorescence. This protocol utilizes a lentiviral-based approach to sparsely label cells with EGFP and tdTomato; however, transgenic reporter alleles expressing tdTomato or EGFP to label cells for reconstruction have been routinely used. It is important to choose a fluorophore that is both photo-stable and bright (e.g., EGFP or tdTomato). Additionally, using a strong promoter to express the fluorophore yields superior contrast and image quality. The drawbacks of this technique arise as properly analyzing this large amount of data can be both labor- and time-intensive. Specialized microscopes can help improve throughput and decrease workload. However, building, owning, and/or operating advanced microscopes are often cost-prohibitive for many laboratories. This work presents a high throughput, relatively rapid, and simple method of visualizing large amounts of neural tissue at high-resolution using CLARITY tissue clearing of large sections, combined with standard confocal microscopy. This protocol describes this approach through the following steps: 1) dissecting and preparing the neural tissue, 2) clearing the tissue, 3) mounting the tissue, 4) imaging the prepared slices, and 5) processing full slice images using microscopy visualization software reconstruction and analysis (Figure 2). These efforts result in high-resolution images that can be used to analyze populations of neurons, neuronal connection patterns, 3D dendritic morphology, dendritic spine abundance and morphology, and molecular expression patterns within intact brain tissue.
Protocol
The following protocol follows all animal care guidelines for Baylor College of Medicine.
1. Dissection and tissue preparation
- Euthanize the mouse with an overdose of isoflurane by placing the mouse in a closed container with a towel soaked in isoflurane (or by other IUCAC approved means).
- Perfuse the animal transcardially using a 25 G needle with 10 mL of ice cold PBS, followed by 10 mL of 4% PFA.
- Dissect the brain region (or tissue) of interest.
- Place the dissected tissue into 4% PFA overnight at 4 °C. Proper fixation is key for this protocol. Do not skip or shorten this step.
- After fixation in 4% PFA for at least 12 h, transfer the tissue to a 4% acrylamide hydrogel mixture for 24 h at 4 °C.
NOTE: When thawing the hydrogel, ensure that it has not polymerized, this can happen if the hydrogel becomes too warm. Thaw on ice to prevent premature polymerization.
2. Tissue clearing
- Place the brain tissue (still submerged in hydrogel) in a vacuum incubator for 3 h at 37 °C with a -90 kPa vacuum. Leave the tube top unscrewed to allow the vacuum to form properly.
- Wash the tissue with PBS for 10 min at room temperature (25 °C) with gentle shaking.
- Place the polymerized tissue sample in the electrophoresis chamber, keeping note of the orientation of the tissue within the chamber.
- Fill the chamber and reservoir with the supplied electrophoresis SDS buffer.
- Run the sample at 70 V, 1 A, and 35 C, with constant current for about 2 h/mm of tissue.
- Check the sample periodically; it may require more time in the chamber to properly clear. A good starting point for clearing is 1-2 h per mm of brain tissue. A whole mouse brain requires 8-10 h for sufficient clearing. Remember the orientation of the sample before removing it from the chamber and be sure to replace it back into the chamber in the same orientation.
NOTE: Figure 3A shows what a fully cleared brain will look like. The brain will look opaque and not clear at this stage due to the presence of dissolved SDS, but there should be little to no yellow tissue colored hue after lipid extraction.
- Check the sample periodically; it may require more time in the chamber to properly clear. A good starting point for clearing is 1-2 h per mm of brain tissue. A whole mouse brain requires 8-10 h for sufficient clearing. Remember the orientation of the sample before removing it from the chamber and be sure to replace it back into the chamber in the same orientation.
3. Preparing and mounting the cleared tissue
- After the sample has finished clearing and looks sufficiently clear, wash in PBS overnight at room temperature. Replace the PBS with fresh PBS as often as possible. This step is critical to remove residual SDS that can form precipitates in later steps.
- Following the final wash in PBS, wash the tissue for 5 min in deionized water at room temperature three times. The tissue will become opaque at this step and may expand.
- Incubate the tissue in the refractive index matching solution (see Table 1) for at least 4 h at room temperature. Figure 3B shows a piece of cleared tissue after incubation in refractive index matching solution.
- During the incubation of tissue in refractive index matching solution, construct a suitable housing chamber to image the sample if necessary.
- Constructing an imaging chamber for small tissue samples/slices
- Using a glass slide as a base for mounting, lay down either rubber or plastic spacers and secure with super glue. If premade spacers are not available, use plastic rings made from conical tube cross sections.
- Ensure to secure these pieces to the glass slide without any holes (Figure 3C).
- Place the cleared tissue into the mounting chamber prefilled with refractive index matching solution.
- Securely mount the tissue by placing a glass coverslip on top and sealing it with nail polish.
- Image this tissue by adding a drop of refractive index matching mounting solution directly on top of the glass.
- Large tissue imaging chamber
- Construct this chamber if the tissue is larger than 5 mm thick (suitable for whole brains or hemispheres).
- Using a 10 cm glass dish with a high wall, place a 50 mL conical tube in the center, making sure that the diameter of conical is large enough to accept the barrel of the objective lens used.
- Make 3% agarose in water and pour it in the space between the glass dish and conical tube, allow to cool for 1 h (Figure 3D). This will form a ring of solid agarose (Figure 3E).
- Securely adhere the tissue to the bottom of the chamber using super glue and fill the chamber with refractive index matching solution. Apply glue to adhere the tissue on a region that will not be imaged to allow reclamation of the tissue from the dish without damaging the regions of interest.
NOTE: This preparation is time sensitive, as the refractive index media may start to polymerize unless preserved from air and stored at 4 °C.
4. Imaging cleared tissue samples
- Acquire the image using a confocal microscope fit with a 25x/0.95 NA objective with a 4 mm working distance.
- Turn on all the relevant imaging equipment. Place the sample on the stage and place a drop of refractive index matching solution onto the top of the mounting chamber.
- Carefully approach the immersion media with the objective and form a continuous column of media.
- Using epifluorescence, find an appropriate imaging field.
- Begin the image acquisition procedure by testing the appropriate settings.
- Start by setting the resolution and scan speed settings using Figure 4A as a guide. If imaging using a confocal microscope, fully close the pinhole to obtain the smallest optical section and thus best z-resolution.
- Gradually increase the laser power/sensor gain until a suitable image is obtained with a high signal-to-noise ratio.
- If utilizing standard EGFP/tdTomato two-color imaging, set the light collection settings using Figure 4B as a guide.
- Set the z-stack parameters based on the observed start and end points of the tissue. Set the step size based on the desired z-resolution using Figure 4C as a guide.
NOTE: Smaller step sizes will yield a greater z-resolution but will also introduce more laser dwell time, potentially leading to sample bleaching. - When satisfied with image acquisition settings, acquire the image.
- Ensure that the image has a high signal-to-noise ratio and shows distinct boundaries of structures (Figure 4D).
5. Image processing and 3D quantification using microscopy analysis software
NOTE: Microscopic image analysis software packages are powerful tools for three-dimensional image visualization and processing. Many of these programs are perfectly suited for the handling of large datasets that are generated from imaging cleared tissue samples. The following steps and associated figures correspond to the Imaris software workflow.
- Open the image stack and import it into the selected analysis software.
- View the image in three-dimensional space and make any desired changes to the lookup tables using the display adjuster to better visualize the image.
NOTE: Figure 5A demonstrates the possible extreme imaging depth accessible through 2-photon microscopy paired with CLARITY tissue clearing. Figure 5B shows distinct dendrite processes as well as clearly visible spine morphologies from the z-stack presented in Figure 5A. - To filter out any consistent background, click on the Image Processing button and select the background subtraction filter.
NOTE: Figure 5C shows the image with a consistent hazy background signal before processing. Figure 5D shows the image after the background subtraction filter has been applied. - Observe the 3D image and become familiar with it by looking at it from multiple angles and zoom levels.
- Start the dendrite tracing by first selecting the Filament tracer tool.
- Click on Edit the Filament Manually, Skip Automatic Creation.
- Set the mode to auto path and check Auto-center and Auto-diameter corrections.
- Shift + right click on the cell body to set a starting point.
- Trace the neuron along the entire length of the dendrite; left click on the end of the dendrite to set the termination point to allow the software to automatically calculate the path in between the start and end points.
- Repeat this step for all the dendrites, and fully trace out the cell structure.
- Visualize the traced cell and confirm its accuracy. Make manual adjustments as needed.
- Select the Creation tab.
- Select the Recompute Dendrite Diameter option.
- Follow the wizard to completion for a more accurately traced dendrite.
- Select the Draw tab.
- Click on the Spine radio button to start drawing spines.
- Set the approximate spine diameter as needed, and use the measurement tool to get an accurate representation of spine diameters.
- Click on the center of the spine heads to add a new spine.
- Repeat this for all spines on the dendrite.
NOTE: It is important to observe the dendrite from all possible angles when manually adding spines. - Check the newly added spines for accuracy and make changes as needed.
- Select the Creation tab.
- Select the Recompute Spine Diameter option to allow the software to determine the proper head and neck diameters, which are crucial for downstream data analysis.
- Follow the spine diameter creation wizard to completion.
- Observe the result of the computation and make any manual adjustments as needed. Figure 5E shows a fully traced neuron complete with spines.
- To create a classified list of spines, select the Tools tab.
NOTE: The MATLAB extension must be installed for this to work.- To install the MATLAB extension, open the preferences window.
- Select the Custom Tools option.
- Add the appropriate MATLAB runtime MCR.
- Click on Classify Spines.
- Edit the desired parameters for spine classification.
- Click on Classify Spines on the MATLAB extension. Figure 5F shows the dendrite overlaid with color-coded classified spines.
- Select the Estadística tab.
- Configure the desired statistics to quantify the data by clicking on the Configure button in the bottom-left corner of this tab.
- Once the method of statistics representation has been chosen, export the data using the Export Statistics on Tab Display to File button located on the bottom right of this window.
- Graph the statistics using a preferred graphing method.
Representative Results
After image acquisition, the representative cell morphology was analyzed using embedded statistics and classifying scripts within the analysis software. The collected data (Figure 6A) reflects that neuron 2 has a larger dendritic structure with a higher density of spines. As a whole, the data suggests that neuron 2 has a more complex dendritic structure compared to neuron 1. To substantiate this result, standard Sholl analysis was performed, which affirms that neuron 2 is more dendritically complex than neuron 1 as denoted by the increased number of Sholl intersections at 50-100 µm from the soma (Figure 6B). Finally, dendritic spines of the two imaged neurons were classified into four main categories based on their overall shapes and sizes. Spines that exhibit more filopodia-like shapes are likely more immature spine subtypes. Spines with defined heads, called mushroom spines, likely contain more developed and mature synapses7. The analysis presented here shows that neuron 1 contains a larger proportion of filopodia-like spines as compared to neuron 2 (Figure 6C). Thus, based on morphology, neuron 2 is more developmentally mature as it is larger, more highly branched, and contains a higher density of mature spines.
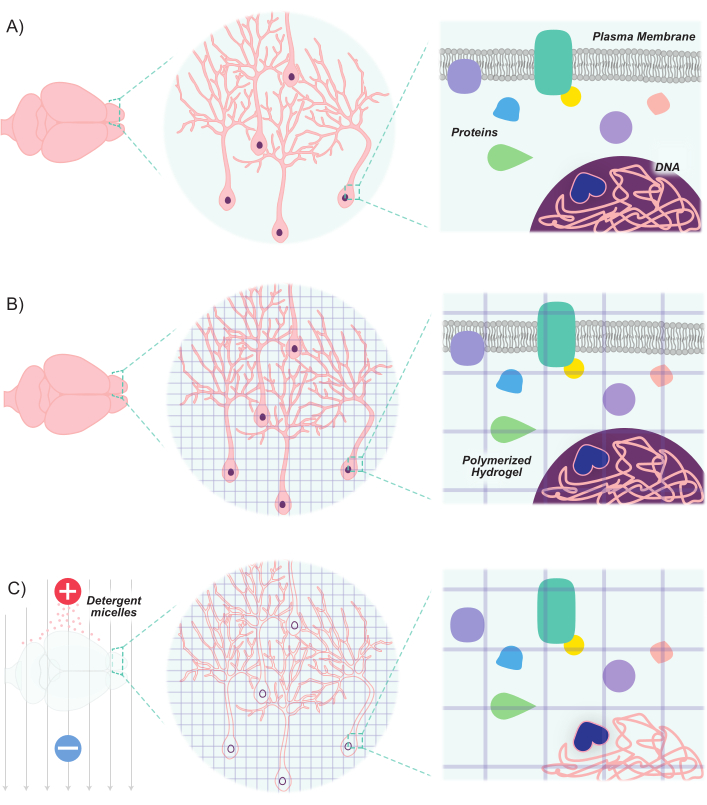
Figure 1: CLARITY protocol renders tissues transparent while maintaining inherent structure and molecule-molecule spatial relationships. (A) Original orientation of neuronal tissue and intercellular components prior to clearing. (B) Hydrogel monomers (purple lines) are infused into the tissue and polymerized into a hydrogel mesh. The tissue and hydrogel mesh are crosslinked via formaldehyde fixation. (C) The tissue is then washed with ionic detergent solutions while exposed to electric fields. During this process, the detergent micelles remove lipid molecules from the tissue, leaving behind a crosslinked network of transparent hydrogel and biomolecules. Please click here to view a larger version of this figure.
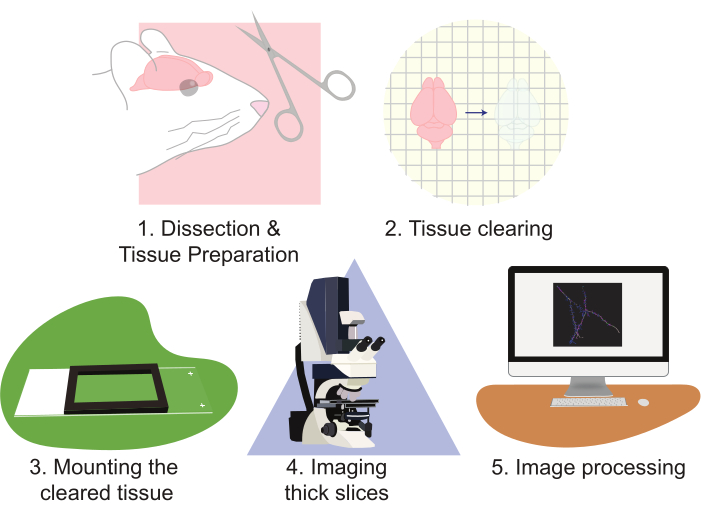
Figure 2: Flow chart of the protocol, diagramming the tissue preparation, clearing, mounting, imaging, and image processing. Please click here to view a larger version of this figure.
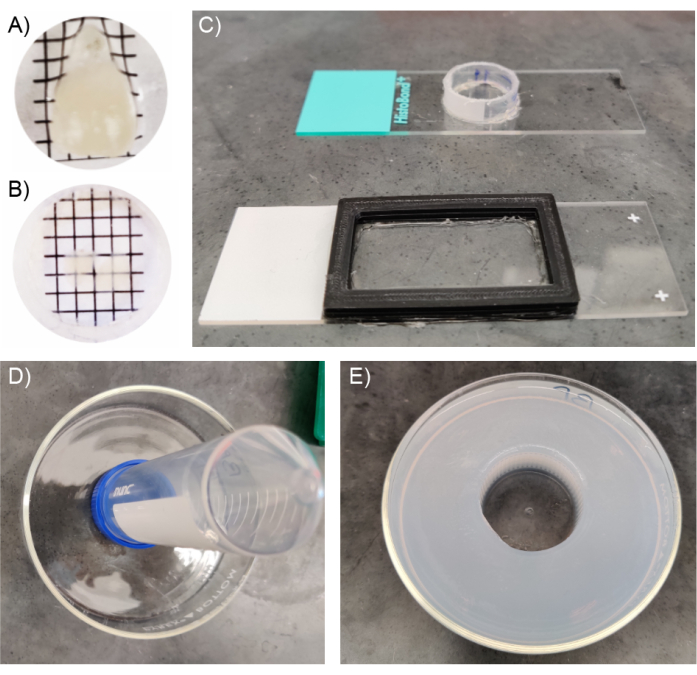
Figure 3: Constructing mounting chambers for cleared tissue samples. (A) Cleared whole brain in PBS prior to immersion in refractive index matching solution. (B) Brain slice in refractive index matching solution. (C) Imaging chamber for large and small cleared tissue samples. The chambers can be made using a variety of materials including but not limited to 3D printed plastics and cut conical tubes. (D) Imaging chamber for whole brain or hemisphere imaging, using 50 mL conical tube as a relief before pouring agarose. (E) Whole brain or hemisphere imaging chamber with agarose fully set; this setup is optimal for large barrel immersion objectives. Please click here to view a larger version of this figure.
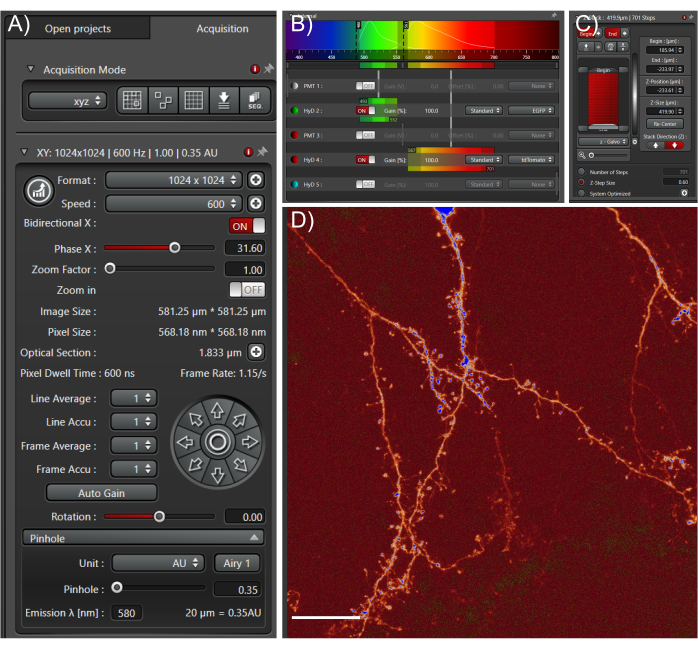
Figure 4: Acquire high quality large datasets from cleared tissue samples. (A) Image acquisition settings used for whole cell high-resolution imaging. The pinhole was fully closed to enable fine optical sections. Scan speed was determined empirically based on optimal pixel dwell times. (B) Light path settings: these will depend on the fluorophore and equipment used. (C) Z-stack settings; a fine z-step was used to capture as much information in the z-direction as possible. (D) Representative max projection; scale bar represents 25 µm. Please click here to view a larger version of this figure.
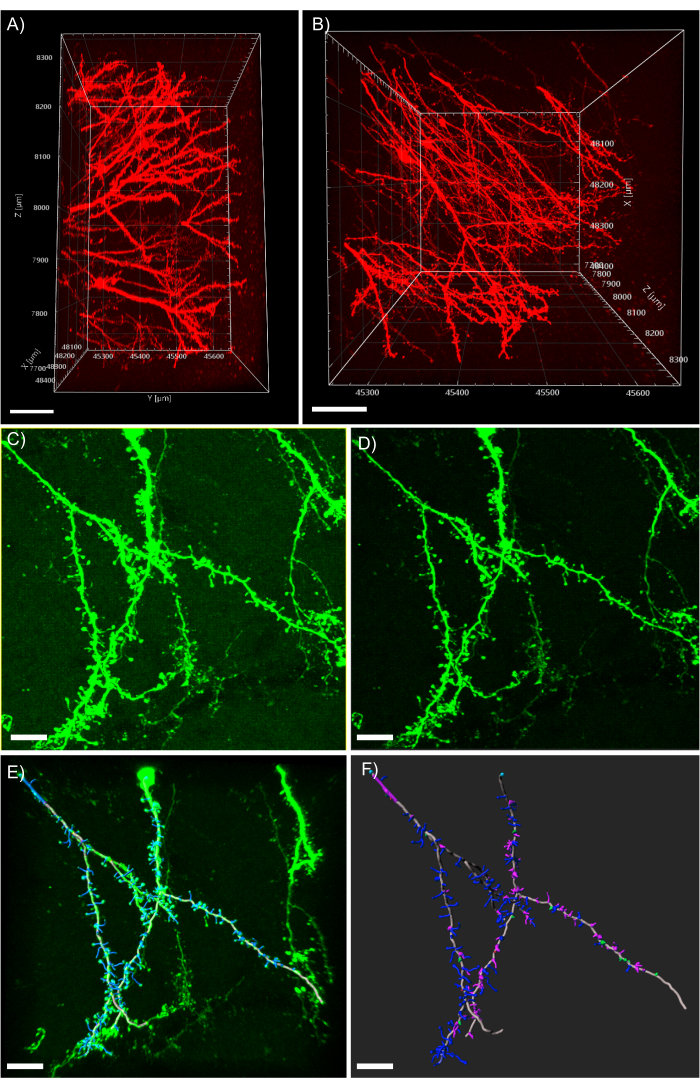
Figure 5: 3D analysis of dendrites in the analysis software. (A) Side-view of a two-photon acquired 600 µm z-stack acquired from a 1 mm thick tissue expressing tdTomato; scale bar represents 100µm. (B) Top-view of the same z-stack acquired in panel A; scale bar represents 100µm. (C) Confocal acquired image of tissue expressing EGFP. Image files can be directly imported into the analysis software and pre-processed for greater image quality; scale bar represents 25 µm. (D) Threshold subtraction is used to remove the consistent background signal present in C. (E) Filament tracing and spine identification: this process is best when performed semi-automatic with the auto-depth feature checked. Spines were then hand labeled after full dendrite reconstruction; scale bar represents 25 µm. (F) Spine classification using a built-in MATLAB extension. Spines have been color coded based on their morphology; stubby spines are red; mushroom spines are green; long thin spines are blue; filopodia are purple; scale bar represents 25 µm. Please click here to view a larger version of this figure.

Figure 6: Representative results. (A) Table of common morphological measurements automatically generated by the selected analysis program. (B) Number of Sholl intersections generated by program statistics. (C) Pie chart representing the distribution of dendritic spine morphologies. Please click here to view a larger version of this figure.
| Solution | Composition | Notes |
| Refractive index matching solution | 80 g of histodenz | pH to 7.5 with NaOH |
| 60 mL of 0.02 M phosphate buffer | Store at 4 °C | |
| 0.01% of sodium azide | Adapted from Marx, V. Nature Methods volume 11, pages 1209–1214 (2014) | |
| Hydrogel | 13.33 mL of 30% Acrylamide (no-bis) | Mix together on ice, otherwise the solution may begin to polymerize |
| 10 mL of 10x PBS | Aliquot and store at -20 °C | |
| 250 mg of VA-044 | ||
| 76.66 mL of ddH2O |
Table 1: Recipes for refractive image matching solution and hydrogel solution. The composition of the refractive index matching solution and the hydrogel are listed.
Discussion
Before the advent of contemporary tissue clearing techniques, studying neuronal morphology consisted of time-intensive sectioning, imaging, and reconstruction of adjacent very thin sections. Using electrophoretic tissue clearing in combination with confocal imaging provides an unobstructed view of complete neuronal morphology. From intact dendritic trees, down to the smallest synaptic bouton, imaging and quantifying neuronal morphology has never been more feasible.
The preparation of cleared brain tissue is straightforward and requires only one piece of specialized equipment. Tissue cleared and imaged using this protocol subverts the need for tedious thin sectioning, handling, and mounting, drastically decreasing the time from experimentation to image acquisition. Additionally, tissue imaged without sectioning remains more faithful to the original structures, as there are no sources of damage or necessary post-hoc image reconstruction. Finally, this protocol saves time by allowing simultaneous imaging of large-scale features such as dendritic trees alongside small-scale submicron features such as spines.
One important collection of steps in this protocol are the wash steps that follow the clearing process. These steps are critical for removing all traces of the SDS electrophoretic clearing buffer. If the cleared tissue is not sufficiently washed, precipitates will form during the mounting step. These precipitates can sometimes be redissolved by incubating the tissue at 37-55 °C for a short time. However, if the precipitates persist, they will scatter light, yielding poor imaging depth and quality.
Mounting large pieces of tissue presents a challenge compared to traditional thin slice imaging. Here we present multiple processes to mount large tissue, which depend on the imaging technique, objective lens properties, and the size of tissue sample. First, it is important to use an objective lens that is suitable for immersion in the specific refractive index matching media used, and which has sufficient working distance for imaging large tissue samples. This protocol is largely limited by the optical properties of the imaging platform used, specifically the working distance of objectives. Imaging at depth is readily achieved using this protocol. However, if an objective with sufficient working distance is not available, the tissue itself will present a physical barrier to acquiring large images. The next important decision is the imaging technique. Two-photon microscopy is typically used for its superb image quality, depth of imaging, and speed of acquisition. Two-photon microscopy enables imaging of up to 1 mm into CLARITY cleared tissue without loss of image quality as demonstrated in Figure 5A,B. However, very similar results can be achieved when using traditional confocal microscopy albeit with a sacrifice to imaging depth compared to two-photon microscopy (Figure 5C,D).
In summary, this method provides a robust and convenient platform for analyzing neuronal morphology at both large and small scales. Additionally, this method largely minimizes handling and processing time, while also providing more accurate and complete three-dimensional images. Cellular morphology is a commonly used proxy for assessing circuit function and health underlying many diseases and pathologies13,14,15. Imaging neuron morphology is powerful, straightforward, and well suited to assay in a multitude of disease models.
Divulgaciones
The authors have nothing to disclose.
Acknowledgements
We would like to thank the viral core NRDDC at the Jan and Dan Duncan Neurological Institute for producing the AAVs and lentiviruses used in these experiments. Additionally, we would like to thank the Baylor College of Medicine Center for Comparative Medicine for mouse husbandry and general maintenance of the mice used. We would like to thank the American Heart Association for their support under award number 20PRE35040011, and BRASS: Baylor Research Advocates for Student Scientists for their support (PJH). Finally, we would like to thank Logos for providing our lab with the Logos X-Clarity electrophoretic tissue clearing system.
Materials
| 15 mL Conical Tube | Thermo Scientific | 339650 | |
| 25 G x 1" Needle | BD | 305127 | |
| 30% Acrylamide (No-Bis) | National Diagnostics | EC-810 | |
| 50 mL Conical Tube | Thermo Scientific | 339653 | |
| Electrophoretic Tissue Clearing Solution | Logos | C13001 | |
| Histodenz | Sigma | D2158-100G | |
| Hydrogel Solution Kit | Logos | C1310X | |
| Imaris | Oxford Instruments | N/A | |
| Paraformaldehyde 16% | EMS | 15710 | |
| PBS, 1x, 500 mL, 6 bottles/case | fisher | MT21040CV | |
| VA-044 | Wako | 925-41020 | |
| X-CLARITY Polymerization System | Logos | C20001 | |
| X-CLARITY Tissue Clearing System II | Logos | C30001 |
Referencias
- Abbott, L. F., et al. The Mind of a mouse. Cell. 182 (6), 1372-1376 (2020).
- White, J. G., Southgate, E., Thomson, J. N., Brenner, S. The structure of the nervous system of the nematode Caenorhabditis elegans. Philosophical transactions of the Royal Society of London. Series B, Biological Sciences. 314 (1165), 1 (1986).
- Jiang, X., et al. Principles of connectivity among morphologically defined cell types in adult neocortex. Science. 350 (6264), (2015).
- Winnubst, J., et al. Reconstruction of 1,000 projection neurons reveals new cell types and organization of long-range connectivity in the mouse brain. Cell. 179 (1), 268-281 (2019).
- Araya, R., Vogels, T. P., Yuste, R. Activity-dependent dendritic spine neck changes are correlated with synaptic strength. Proceedings of the National Academy of Sciences of the United States of America. 111 (28), (2014).
- Bosch, M., Hayashi, Y. Structural plasticity of dendritic spines. Current Opinion in Neurobiology. 22 (3), 383-388 (2012).
- Martínez-Cerdeño, V. Dendrite and spine modifications in autism and related neurodevelopmental disorders in patients and animal models. Developmental Neurobiology. 77 (4), 393-404 (2017).
- Arenkiel, B. R., Ehlers, M. D. Molecular genetics and imaging technologies for circuit-based neuroanatomy. Nature. 461 (7266), 900-907 (2009).
- Kim, E. H., Chin, G., Rong, G., Poskanzer, K. E., Clark, H. A. Optical probes for neurobiological sensing and imaging. Accounts of Chemical Research. 51 (5), 1023-1032 (2018).
- Weissman, T. A., Pan, Y. A. Brainbow: New resources and emerging biological applications for multicolor genetic labeling and analysis. Genética. 199 (2), 293-306 (2014).
- Haggerty, D. L., Grecco, G. G., Reeves, K. C., Atwood, B. Adeno-associated viral vectors in neuroscience research. Molecular Therapy – Methods and Clinical Development. 17, 69-82 (2020).
- Chung, K., et al. Structural and molecular interrogation of intact biological systems. Nature. 497 (7449), 332-337 (2013).
- Kanning, K. C., Kaplan, A., Henderson, C. E. Motor neuron diversity in development and disease. Annual Review of Neuroscience. 33, 409-440 (2010).
- Ledda, F., Paratcha, G. Mechanisms regulating dendritic arbor patterning. Cellular and Molecular Life Sciences. 74 (24), 4511-4537 (2017).
- Falougy, H. E., Filova, B., Ostatnikova, D., Bacova, Z., Bakos, J. Neuronal morphology alterations in autism and possible role of oxytocin. Endocrine Regulations. 53 (1), 46-54 (2019).

