Application of Membrane and Cell Wall Selective Fluorescent Dyes for Live-Cell Imaging of Filamentous Fungi
Summary
Vital fluorescent dyes are essential tools for live-cell imaging analyses in modern fungal cell biology. This paper details the application of established and lesser-known fluorescent dyes for tracking plasma membrane dynamics, endo-/exocytosis and cell wall morphogenesis in filamentous fungi.
Abstract
The application of membrane and cell wall selective fluorescent dyes for live-cell imaging analyses of organelle dynamics in fungal cells started two decades ago and since then continues to contribute greatly to our understanding of the filamentous fungal lifestyle. This paper provides a practical guide for the utilization of the two membrane dyes FM 1-43 and FM 4-64 and the four cell wall stains Calcofluor White M2R, Solophenyl Flavine 7GFE 500, Pontamine Fast Scarlet 48 and Congo Red. The focus is on their low-dose application to ascertain artefact-free staining, their co-imaging properties, and their quantitative evaluation. The presented methods are applicable to all filamentous fungal samples that can be prepared in the described ways. The fundamental staining approaches can serve as starting points for adaptations to species that might require different cultivation conditions. First, biophysical and biochemical properties are reviewed as their understanding is essential for using these dyes as truly vital fluorescent stains. Secondly, step-by-step protocols are presented that detail the preparation of various fungal sample types for fluorescent live-cell imaging. Finally, example experiments illustrate different approaches to: (1) identify defects in the spatio-temporal organization of endocytosis in genetic mutants, (2) comparatively characterize shared and distinct co-localization of GFP-labeled target proteins in the endocytic pathway, (3) identify morphogenetic cell wall defects in a genetic mutant, and (4) monitor cell wall biogenesis in real time.
Introduction
Twenty years ago, the way in which hyphal morphogenesis and the underlying molecular cell biology could be visualized in filamentous fungi was revolutionized by the application of the membrane selective fluorescent Fei Mao dye FM 4-641. Later, the benefit of the chitin-binding dye Calcofluor White as vital fluorescent marker of fungal cell wall dynamics was realized2. Since then, both dyes and variants thereof have become an inherent part of live-cell imaging analyses of organelle dynamics in fungi, and continue to provide unprecedented insights into the filamentous fungal lifestyle. This paper details the application of established and lesser-known fluorescent dyes for tracking plasma membrane dynamics, endo- and exocytosis and cell wall morphogenesis in filamentous fungi. Endocytosis tracking assays allow various cell biological questions related to the general study of endocytosis to be addressed3. For this, the localization, speed and succession of stained compartments upon FM dye addition is recorded by time lapse microscopy and quantitatively compared between the tested fungal strains4. Cell wall dyes delineate the outer boundary of the cell and allow tracking of morphogenetic events, including polarized hyphal tip growth2, hyphal branching5, hyphal fusion6,7 and septum formation8. Furthermore, they facilitate the quantification of localized cell wall deposition and the identification of defects during cell wall biogenesis9. Because detailed knowledge of the biochemical and biophysical properties of any fluorescent marker is a fundamental prerequisite for its successful in vivo application, these characteristics are first summarized for the six dyes featured in this article.
Membrane selective dyes
FM (Fei Mao) styryl dyes are small amphiphilic molecules that cannot pass through but reversibly associate with the outer leaflet of the lipid bilayer of biological membranes10. They are virtually non-fluorescent in aqueous solution, but become intensely fluorescent upon plasma membrane integration, generating excellent signal-to-noise (S/N)-ratios11. These properties make them ideally suited for visualizing plasma membrane and intracellular organelle dynamics, including tracking of endo- and exocytosis12. The green-fluorescent FM 1-43 and the red-fluorescent FM 4-64 are the two most widely used fluorescent membrane markers for these purposes. SynaptoGreen C4 and SynaptoRed C2 are generic molecules from alternative suppliers that can be interchangeably used instead of FM 1-43 and FM 4-64, respectively.
Styryl dyes comprise three key structural regions: (1) the lipophilic tail that facilitates insertion of the dye into the lipid bilayer, (2) the fluorophore core that determines the spectral properties of the dye and is constituted by two aromatic rings connected by one to three double bonds, and (3) the positively charged hydrophilic head that prevents complete insertion and permeation of the dye through the membrane (Figure 1A).
The longer the lipophilic tail, the higher is the dye’s hydrophobicity and thus binding affinity to the membrane, but the lower is its water solubility and membrane de-staining rate. Consequently, different FM dye variants produce different staining dynamics and patterns. The higher hydrophobicity of the C4-tailed FM 1-43 provides a stronger and more stable fluorescence signal at plasma membranes and internal organelles quicker than the shorter C2-tailed FM 4-64, when applied at equimolar concentrations (Figure 2).
Importantly, the constant and high association/dissociation rates of both FM dyes11 with average retention times of 1–6 s per individual dye molecule13 reduce the chances for localized disruption of membrane function, for example, through the modification of membrane fluidity or forced permanent interaction of membrane proteins. This is probably the key reason why these molecules can be used as vital dyes. Nevertheless, FM dye concentrations above 50 µM are toxic to fungal and plant cells2,14, and evidence from BY-2 tobacco protoplasts indicates that more than 20 µM FM dye lead to plasma membrane saturation14. Thus, it is advisable not to exceed this limit, especially given the fact that excellent imaging has been achieved with as little as 2–5 µM15,16.
Notably, the spectral properties of FM dyes vary greatly depending on the particular membrane microenvironment (reviewed14). Generally, excitation and emission spectra of FM dyes in pure solvent solutions (as usually provided in the product information) differ significantly from that in cellular environments and can, in most cases, not directly be consulted for selecting live-cell imaging settings. The excitation/emission maxima of FM 1-43 and FM 4-64, for instance, become blue-shifted by 37/46 nm and 43/64 nm, respectively, when bound to fungal membranes in comparison to their solutions in methanol (Table 1).
The ground-breaking fundamentals for the use of FM 4-64 and FM 1-43 for tracking plasma membrane, endo-/exocytosis and organelle dynamics, including the Spitzenkörper and mitochondria, have already been comprehensively documented for a wide range of filamentous fungal species previously2,4,17,18,19. Recommended imaging settings for both FM dyes that work in various filamentous fungal species are depicted in Figure 1B. Technical limitations of the available equipment or particular cellular and experimental conditions, such as culture medium, pH or temperature, however, might require some adaptations. Fortunately, FM dyes operate over a wide spectral range, and very good imaging results are achieved by exciting FM 1-43 with 514 nm or FM 4-64 with 488 nm. Consequently, the optimal imaging settings must be determined individually for each sample type and intended application.
The considerable Stoke’s shift of more than 135 nm of FM 4-64 allows excellent, simultaneous co-imaging with fluorophores emitting green light; this is frequently exploited to evaluate the intracellular localization dynamics of green fluorescent protein (GFP)-labeled fusion proteins relative to the plasma membrane and the endocytic pathway9,20.
Cell wall-selective dyes
Calcofluor White M2R (CFW), also marketed as Fluorescent Brightener 28, is probably the best-known fluorescent dye used to stain the cell walls of bacteria, fungi, algae, higher plants and insects. Initially used as optical whitening agent in the paper, textile and detergent industry, its benefits for the clinical diagnosis of fungal infections was realized early on21,22. Because CFW intercalates irreversibly into the nascent chitin chain it disturbs normal chitin microfibril assembly during cell wall biogenesis thereby generating cell wall stress23. This in turn triggers a cell wall damage repair mechanism leading to locally heightened cell wall deposition as the result of glucan and chitin synthase activation24,25. This phenomenon can occur with any dye that operates by stably binding to cell wall polymers, is concentration-dependent and is most noticeable at hyphal tips which represent the most prolific growing and thus most sensitive parts of the mycelium (Figure 3). A comprehensive summary of the molecular machinery that responds to cell wall damage has recently been provided26.
Overdosed dye in combination with phototoxicity can lead to rapid cell lysis of hyphal compartments (Movie 1). Nonetheless, increased sensitivity to dye concentrations that are “vital” in the wild type can be exploited to identify defects in cell wall biosynthesis of gene loss-of-function mutants9. For CFW and Congo Red (CR), another textile colorant also known as Direct Red 28 and employed as α- and β-chitin-specific cell wall stain for fungi and insects27,28, threshold concentrations that strongly induce chitin synthases have been determined with > 60 µM CFW and > 70 µM CR, respectively, whereas concentrations <15 µM of either dye did not alter or inhibit fungal growth29,30,31. Hickey et al. placed this threshold concentration for CFW at 25 µM2. Therefore, it is advisable to use dye concentrations ≤ 5 µM to exclude stress-related artefacts and ensure using these molecules as truly “vital fluorescent dyes”2,32. This equally applies to Solophenyl Flavine 7GFE 500 (SPF) and Pontamine Fast Scarlet 4B (PFS), synonymous to Direct Yellow 86 and Direct Red 23, respectively, two other useful cell wall dyes whose application for fungi has been reported for the first time more than a decade ago33. But despite their remarkable spectral properties34,35, the use of both dyes has since then been very limited36,37. As previously shown for 1.5 µM CFW2, 2 µM SPF are sufficient to resolve cell wall dynamics under native conditions with very high temporal resolution (Movie 2). The same results can be obtained with 2 µM CR or PFS.
Together, these four dyes, CFW, SPF, PFS and CR, comprise a set of cell wall-selective fluorescent markers that cover almost the complete visible emission light spectrum (400–700 nm) utilized on modern fluorescent microscopes (Figure 4). The significant increase in fluorescence intensity upon binding to cell wall polymers is inherent to all four and generates excellent S/N-ratios. This in turn permits to keep dye concentrations and excitation light intensity very low and allows to perform cell wall staining as “low dose” live-cell imaging technique2. Because these cell wall dyes are plasma membrane impermeable, they simultaneously function as live/dead stains. Notably, due to their extremely wide emission light spectra, some limitations regarding the co-imaging properties of CFW and SPF with other fluorophores need to be carefully considered.
Protocol
1. Preparation of fungal samples
- Fungal pre-cultures
- Inoculate the desired strain on an appropriate solid agar medium, such as potato dextrose agar (PDA) for Trichoderma atroviride or Vogel’s Minimal Medium (VMM) for Neurospora crassa. Add an appropriate selection marker when working with transformant strains.
- Incubate the pre-culture at the organism’s optimal temperature. For instance, T. atroviride at 25 °C and N. crassa at 30 °C, and 12 h/12 h light/dark cycles until a sporulating mycelium has developed but not yet reached the edge of the plate. On a standard size Petri dish (9.2 cm Ø), this takes the wild-type T. atroviride on 4–6 days average, whereas the N. crassa wild type reaches this stage after 3–4 days on average.
- Cultivation of fungal colonies
- Using a sterile scalpel, cut a small 3 mm x 3 mm agar block carrying non-sporulating mycelium from the colony edge of the pre-culture.
- Place the agar block at the center of a fresh solid medium plate to inoculate the experimental culture.
- Incubate the experimental culture according to the developmental stage intended to be investigated. For instance, the wild-type T. atroviride requires 20–22 hours at 25 °C in the dark to develop colonies of about 2 cm diameter on PDA, whereas the wild-type N. crassa reaches colony diameters of about 4 cm after 14–16 h of incubation at 30 °C in the dark on VMM.
NOTE: Incubation in the dark prevents the formation of pigments which might introduce autofluorescence. In order to eliminate medium background fluorescence from the experimental culture, replace agar with 1.5% w/v of a transparent solidifying agent (see the Table of Materials), and any complex medium with a defined minimal medium.
- Cultivation of solid germling cultures
- Use 5 mL of sterile physiological salt solution (0.9% w/v NaCl) to harvest conidial spores from the pre-culture plate and collect the resulting spore suspension in a 15 mL screw cap tube.
- Mix the spore suspension well by vigorous vortexing and subsequently filter it over a 1 cm x 5 cm strip of sterile filter fabric (see the Table of Materials) lightly stuffed into a 1 mL pipette tip (both assembled and autoclaved beforehand) into a fresh sterile tube.
- Determine the spore density with a cell counting chamber and prepare a 1 x 10⁷ cells/mL spore suspension with physiological salt solution.
NOTE: The spore suspension can be kept at 4 °C for up to two weeks. - Prepare a standard size Petri dish (9.2 cm Ø) with 20 mL of solid medium and add 15–20 sterile glass beads (3 mm Ø) on top.
- Pipette 200 µL of the spore suspension onto the medium plate and evenly distribute the cells across the whole plate by gentle shaking. Collect the glass beads into a beaker with 70% ethanol for reuse.
- Incubate the experimental culture according to the developmental stage intended to be investigated. For instance, the T. atroviride wild type requires 5–6 h at 25 °C in the dark to develop conidial germlings on PDA, whereas the N. crassa wild type develops conidial germlings after 3–4 h of incubation at 30 °C in the dark on VMM.
NOTE: In order to eliminate any medium background fluorescence from the experimental culture, replace agar with 1.5% w/v of a transparent solidifying agent, and any complex medium with a defined minimal medium.
- Cultivation of liquid germling cultures
- Fill 190 µL of liquid culture medium into each well of an 8-well chambered micro-slide.
- Add 10 µL of a 1 x 10⁷ cells/mL spore solution (prepared in steps 1.4.1–1.4.3) and mix by gently pipetting up-and-down a few times. The resulting total number of cells is 1 x 10⁵ per well.
- Incubate the experimental culture according to the developmental stage intended to be investigated. For instance, the wild type T. atroviride requires 5–6 h at 25 °C in the dark to develop conidial germlings in potato dextrose broth (PDB), whereas the wild type N. crassa develops conidial germlings after 3–4 h of incubation at 30 °C in the dark in liquid VMM.
2. Preparation of dye working solutions
- To guarantee full solubility of each dye, prepare 2 mM stock solutions in dimethyl sulfoxide (DMSO) by adding the appropriate amount (see exact weights in Table 1) to 1 mL of 100% DMSO and mix well by vortexing.
CAUTION: Make sure to take the DMSO from a septum-sealed bottle; it should be a clear transparent liquid. Upon contact with air, DMSO turns brown—probably due to the oxidation of trace impurities—and might negatively affect cell growth or dye staining. - Filter sterilize the stock solution through a 0.2 µm syringe membrane filter into a fresh sterile 1.5 mL reaction tube. To minimize dye bleaching, wrap the tube in aluminum foil.
NOTE: The dye stock solution can be aliquoted into smaller volumes to avoid thawing/freezing cycles, and kept at 4 °C for several months. - Prepare a 20 µM aqueous dye working solution by dissolving 2 µL of dye stock solution in 198 µL of sterile distilled water in a fresh sterile 1.5 mL reaction tube. To minimize dye bleaching, wrap the tube in aluminum foil.
NOTE: The dye working solution should be prepared freshly on the day of the experiment. - During sample mounting (see section 3), the dye working solution will be standardly diluted 1:10, resulting in a final dye concentration of 2 µM and 0.1% w/v final DMSO concentration.
NOTE: Choosing different dilution factors by simply changing the volume ratio between dye working solution and mounting liquid, allows to easily adapt the desired final dye concentration.
CAUTION: To prevent unwanted effects due to dye or DMSO toxicity, the dilution factor should not fall under 1:4 to result maximum final concentrations of 5 µM dye and 0.4% w/v DMSO. Higher dye concentrations will quickly saturate the system and prevent reliable signal quantification, whereas more than 0.5% w/v (≥ 62.5 mM) DMSO can impair cell development38.
3. Sample preparation for microscopy
- Mount samples from fungal colonies (step 1.2) or solid germling cultures (step 1.3) by the inverted agar block method.
- Keep a clean 24 mm x 60 mm glass cover slip (#1 = 0.13–0.16 mm thickness) ready and add 18 µL of liquid minimal medium (VMM or M9) or physiological salt solution onto the center.
- Add 2 µL of the 20 µM dye working solution to the 18 µL of liquid and mix well by pipetting up and down several times, while avoiding the production of air bubbles.
NOTE: When working with several samples, it is advisable to prepare a master mix of liquid-dye solution for all in order to ensure equal dye concentration throughout the experiment. - With a clean scalpel, cut out a 15 mm x 15 mm sample from the periphery of the colony or solid germling culture and place it vertically beside the medium drop onto the cover slip.
- Using the scalpel to support the upper edge of the block and a finger to hold the rear side of the block in place, slowly lower the side carrying the mycelium or germlings onto the liquid. The sample is now ready for transfer onto the microscope stage.
CAUTION: It is essential to do this slowly and very carefully in order to minimize mechanical stress on the cells and to avoid air bubbles being trapped between sample and cover slip.
- Mount the liquid germling cultures from step 1.4.
NOTE: Most conveniently, liquid germling cultures in chambered micro-well slides can be directly transferred and further manipulated on the microscope stage.- Add 22 µL of dye working solution to 200 µL of liquid medium to result in standard final concentrations of 2 µM dye and 0.1% w/v DMSO.
NOTE: Liquid germling cultures have the great advantage that fluorescent dyes (or other chemicals, such as inhibitors) can be added at any desired time point of the experiment, also during recording. In that case, special care needs to be taken to administer the liquid drops very slowly in order to not disturb the cells. System vibrations and Brownian motion might already introduce some cell movement.
- Add 22 µL of dye working solution to 200 µL of liquid medium to result in standard final concentrations of 2 µM dye and 0.1% w/v DMSO.
4. Live-cell microscopy
- Adjust the basic image acquisition settings. The following image acquisition settings allow to capture staining dynamics in individual hyphae and are applicable to both of the following assays
- Apply 5–10% laser power of 20% of the full output power of the device.
- Use a Plan Apo 60x–63x glycerol or water immersion objective with a high numerical aperture ≥ 1.2.
- Restrict the image acquisition area to the outline of the hyphae by setting an image size of 1024 x 256 pixels and by using an optical zoom factor of 2–3.
- Use bidirectional scanning with 400 Hz. Adjust the pinhole size to 1 Airy unit.
- Set the gain of the most sensitive detector to 100%.
- For time laps recording, start image acquisition with one frame every 15 s to allow reasonable temporal resolution without producing dye bleaching or photo stress.
- For 3D recording, set the upper and lower spatial limit to the boundary of the hyphae and space optical sections 1 µm apart to allow reasonable spatial resolution.
NOTE: Due to the fast growth of hyphae, high spatial resolution in the Z axis has often been sacrificed for high temporal resolution in the X/Y axis or the other way around. Only very modern confocal laser scanning microscopes are fast enough to satisfy both demands.
- Endocytosis uptake assays
- Consult Figure 1 and Table 1 to identify the best excitation/emission settings for FM 1-43 and/or FM 4-64 available on the microscopy system and adjust accordingly.
NOTE: With the recommended 2 µM concentration, incorporation of FM dye into the plasma membrane is instant in normal healthy cells. The whole process from initial plasma membrane staining to dye appearance in tubular vacuoles is usually completed within 30–45 min at room temperature. Increasing the FM dye concentration increases the S/N-ratio and thus produces higher contrast images quicker. However, it also speeds up the labeling process making it more difficult to differentiate the chronological succession of organelle staining. - Start image recording using the above recommended basic image acquisition settings and evaluate the results.
- Optimize image acquisition settings to the spatial and temporal resolution required to capture the aspect of plasma membrane or endocytosis dynamics the experiment is focused on.
- For instance, in order to capture very fast dynamics in X/Y, decrease the overall image size, image only one focal plane and increase the scanning rate to 1 fps. For higher resolution in the Z axis, decrease resolution in X/Y, decrease image size and decrease the distance between optical sections to 0.5 µm.
- Consult Figure 1 and Table 1 to identify the best excitation/emission settings for FM 1-43 and/or FM 4-64 available on the microscopy system and adjust accordingly.
- Cell wall dynamics
- Consult Figure 4 and Table 1 to identify the best excitation/emission settings for the applied cell wall dye available on the microscopy system and adjust accordingly.
NOTE: Due to their broad emission spectra, CFW and SPF are not well suited for simultaneous co-imaging with other fluorophores, predominantly GFP. Some restrictions do even apply for sequential imaging approaches with these dyes, and thus have to be optimized individually. - Start image recording using the above recommended basic image acquisition settings and evaluate the results.
NOTE: With the recommended 2 µM concentration, incorporation of dye into the cell wall is not necessarily instant but reasonably fast. The whole process of septum formation, for instance, takes on average about 5–7 min at room temperature20. Increasing the cell wall dye concentration increases the S/N-ratio and thus produces higher contrast images quicker. However, it also rapidly introduces artefacts due to induced cell wall damage repair. - Optimize image acquisition settings to the spatial and temporal resolution required to capture the aspect of cell wall morphogenesis the experiment is focused on, as outlined in section 4.2.3.
- Consult Figure 4 and Table 1 to identify the best excitation/emission settings for the applied cell wall dye available on the microscopy system and adjust accordingly.
Representative Results
Quantitative image analysis
In addition to “just” visualizing cellular processes, live-cell imaging allows to extract quantitative information from the recorded data. Generally, quantitative image analysis is a complex topic whose proper discussion is far beyond the scope of this article, hence, the reader is referred to dedicated textbooks and articles39,40,41. Nevertheless, some basic guidelines associated to the following example data are provided. Several crucial prerequisites must be met to allow image quantification, including: (1) defined molarities of fluorescent dyes must be applied to all samples to allow accurate relative comparison; (2) image acquisition settings must be adjusted in a way that the emission light detectors are never saturated, otherwise maximum intensities are cut off; (3) image acquisition settings must remain fixed during the course of a coherent experimental set, otherwise artificial intensity changes are introduced; (4) image data must be saved in an information-lossless file format along with the meta information containing all instrument settings; and (5) image analysis should be limited to the minimal number of post processing steps required to extract the desired quantitative information.
Usually, defined standards that would allow absolute quantification of recorded signals are not available in the living cell. Thus, in its simplest form, quantitative image analysis relies on the relative comparison of pixel intensities within the same image or between different images recorded with identical settings. The manufacturer’s microscope control software normally includes basic tools for image post-processing and quantitative analysis, or can be upgraded with additional functions for image segmentation, thresholding, ratio imaging, etc. Several open source image processing platforms, differently suitable for various types of imaging data, are available, including ImageJ (https://imagej.net; https://imagej.nih.gov/ij/), icy (http://icy.bioimageanalysis.org/), CMEIAS Bioimage Informatics (http://cme.msu.edu/cmeias/) and Wimasis (https://www.wimasis.com/en/).
The presented example data was processed and analyzed using the ImageJ platform. Briefly, specific regions in the cell, such as the hyphal tip apex or septa, are marked with sizable area selection tools, and the intensity of all contained pixels is readout with the software implemented “measuring tool”. The intensity data from controls and experimental samples is transferred into a spreadsheet file, mathematically analyzed and prepared as graph. Further details may be found in the cited original publications.
Example data 1: FM 4-64 uptake assays
Fungal samples were cultivated as colonies (step 1.2) and mounted by the inverted agar block method (step 3.1). The final concentration of FM 4-64 was 1.67 µM. Imaging settings: HCX PL APO 63x/1.3 NA glycerol immersion objective on an inverted confocal laser scanning microscope (see the Table of Materials); FM 4-64 excitation at 488 nm and emission at 600–700 nm; one frame every minute for up to 150 min. FM 4-64 uptake assays identified defects in the spatio-temporal organization of endocytosis in gene deletion and gene overexpressing mutants of the fungal-specific Sur7-family protein 2 (Sfp2) of T. atroviride9 (Figure 5).
Example data 2: FM 4-64 co-staining of fluorescent fusion proteins targeted to endocytic compartments
Fungal samples were cultivated as colonies (step 1.2) and mounted by the inverted agar block method (step 3.1). The final concentration of FM 4-64 was 2 µM. Imaging settings: CFI Plan Apo VC 60x/1.2 NA XC water immersion objective on an inverted confocal laser scanning microscope (see the Table of Materials); GFP excitation at 488 nm and emission at 500–530 nm, FM 4-64 excitation at 488 nm and emission at 600–700 nm, and bright-field with transmitted light detector, all simultaneously; one frame every 15 s for up to 15 min. FM4-64 co-staining was employed to relate the subcellular distribution of the two enhanced green fluorescent protein (EGFP)-tagged transmembrane proteins Sfp2 and Gpr1 to the endocytic pathway in T. atroviride (Figure 6, Movie 3, Movie 4).
Example data 3: FM 4-64 co-staining for the identification of morphogenetic differences
Fungal samples were cultivated as colonies (step 1.2) and mounted by the inverted agar block method (step 3.1). The final concentration of FM 4-64 was 2 µM. Imaging settings: Plan Apochromat 63x/1.4 NA oil immersion objective on an inverted confocal laser scanning microscope (see the Table of Materials); GFP excitation at 488 nm and emission at 505–550 nm, FM 4-62 excitation at 488 nm and emission at 574–691 nm, and bright-field with transmitted light detector, all simultaneously; one frame every 8.5 s for up to 15 min. FM4-64 co-staining allowed to relate the subcellular localization dynamics of fluorescently labeled BUD-6 polarisome complex protein to endosome trafficking-dependent processes, such as the formation of septa and polarized hyphal tip growth, and characterized differences in the subcellular organization and hyphal architecture between wild type and mutant strains of N. crassa (Figure 7, Movie 5).
Example data 4: Cell wall staining reveals morphogenetic differences
Fungal samples were cultivated as colonies (step 1.2) and mounted by the inverted agar block method (step 3.1). Final concentrations of 2 µM CFW, 20 µM SPF and 100 µM CR were used. Imaging settings: CFI Plan Apo VC 60x/1.2 NA XC water immersion objective on an inverted confocal laser scanning microscope (see the Table of Materials); CFW and SPF excitation at 405 nm and emission at 430–470 nm, CR excitation at 543 nm and emission at 580–620 nm. The different interaction properties of CFW, SPF and CR with cell wall polymers highlight morphogenetic differences between the Δsfp2 mutant and the wild type strain of T. atroviride9. Increasing cell wall stress inflicted by elevated dye concentrations occurs quicker and more pronounced in the mutant compared to the wild type. In addition, the same images allow to quantify morphogenetic differences regarding hyphal diameter and septal distance between both strains (Figure 8).
Example data 5: Real-time monitoring of cell wall biosynthesis
Germlings were cultivated as liquid culture (step 1.4) in 8-well chambered micro-slides (step 3.2). The final CFW concentration was 0.12 µM. Imaging settings: CFI Plan Apo VC 60x/1.2 NA XC water immersion objective on an inverted confocal laser scanning microscope; CFW excitation at 405 nm and emission at 420–470 nm; one frame every 20 s for up to 35 min. The very low CFW concentration prevents saturation of the cell wall with dye molecules and allows quantitative real-time monitoring of cell wall biosynthesis. This reveals that the deposition of new cell wall material is not uniform but responds very rapidly to localized physical stresses resulting from the relative displacement of one cell upon cell-cell attachment prior to germling fusion in N. crassa (Figure 9, Movie 6).

Figure 1: Biochemical and biophysical properties of FM dyes. (A) Chemical structures of FM 1-43/SynaptoGreen C4 and FM 4-64/SynaptoRed C2. (B) Absorption and emission spectra of both FM dyes, overlaid with the optimal imaging settings for membrane-bound dyes in filamentous fungi: 445–495 nm blue light will excite FM 1-43 with 100–80% efficiency, whereas 488 nm of an Argon laser will excite the dye with 91% efficiency. Due to the blue-shift upon membrane binding (*), the optimal detection range of FM 1-43 emission is between 520–590 nm. Similarly, the optimal imaging settings for FM 4-64 in fungi are 471–541 nm (100–80% efficiency) when using a polychromatic excitation light source or 514 nm (99% efficiency) when using an Argon laser, and 650–750 nm for emission light detection. Please click here to view a larger version of this figure.
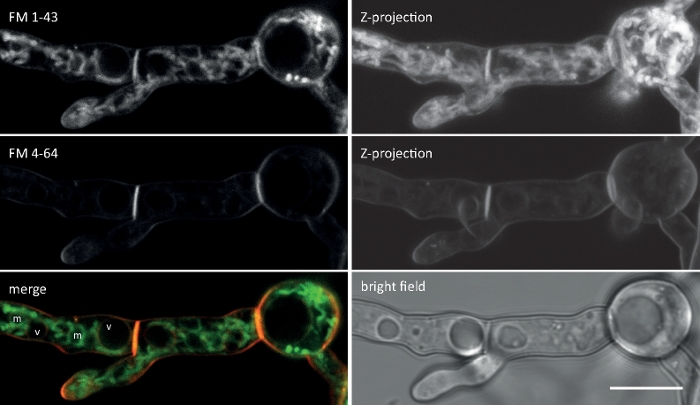
Figure 2: Simultaneous co-imaging of FM 1-43 and FM 4-64. An equimolar mixture of both dyes was added to a liquid germling culture of N. crassa yielding a final concentration of 10 µM. At 25 min after dye addition, FM 1-43 has stained the plasma membrane and already accumulated in internal membranes, including strongly stained mitochondria (m) but largely excluding vacuolar membranes (v), and is more than eight-times stronger compared to FM 4-64 (average fluorescence intensities 176 to 21, respectively), whose lower hydrophobicity/higher hydrophilicity slows down its internalization rate leading to a prolonged dwelling time at the plasma membrane. Scale bar = 10 µm. Please click here to view a larger version of this figure.
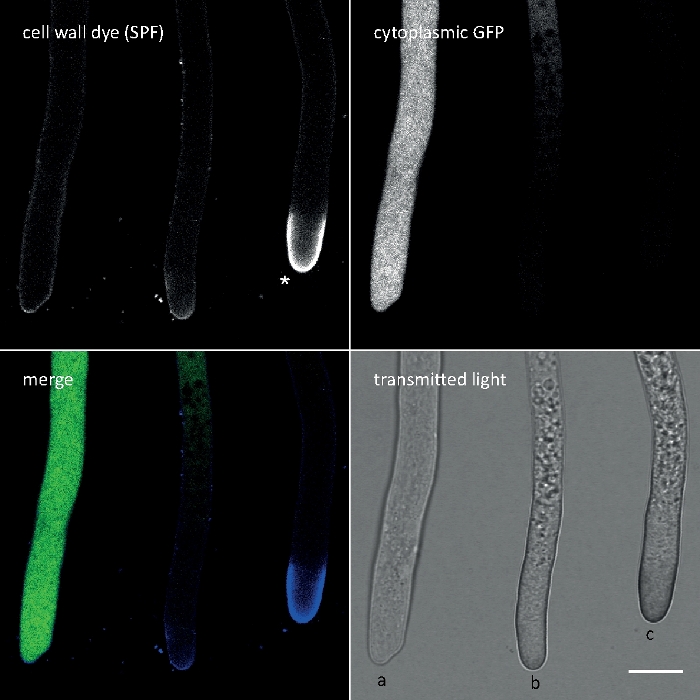
Figure 3: Cell wall stress-induced deposition of cell wall polymers at the tip apex often entails cell autolysis. Hyphae of T. atroviride expressing cytoplasmic GFP were stained with 10 µM Solophenyl Flavine 7GFE 500 (SPF) and imaged immediately upon mounting. Non-stressed hyphae (a), stressed hyphae with slightly increased glucan/chitin deposition at the apex and progressing autolysis (b), and heavily stressed hyphae with pronounced apical glucan/chitin cap (asterisk) and terminal autolysis (c) evident by the total loss of GFP fluorescence and extensive vacuolization. Scale bar = 10 µm. See Movie 1 for full time course sequence. Note that the three hyphae were indeed located next to each other. Please click here to view a larger version of this figure.
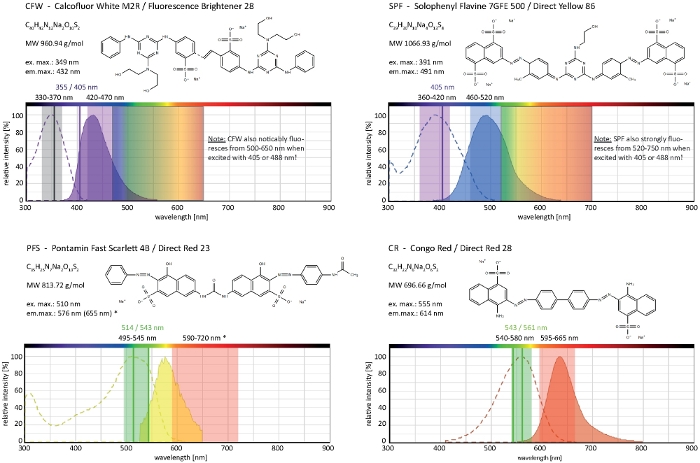
Figure 4: Biochemical and biophysical properties of cell wall selective dyes. Chemical features given are that of the sodium salts of each dye. Absorption and emission spectra correspond to those in cellular environments. Indicated monochromatic laser excitation lines (written in color), polychromatic excitation ranges applicable for epifluorescence microscopes, and emission light detection ranges are those recommended for imaging in filamentous fungi. Two laser excitation lines are indicated when both work equally well. (*) The emission spectrum of cell wall-bound PFS is significantly more red-shifted than previously noted33, however, resulting in very good S/N-ratios with lower dye concentrations than used before. The complete spectrum of CR is currently unavailable, hence that of Nile Red (CAS No: 7385-67-3) is shown as the closest match. Detailed information on the spectral properties of CR can be found elsewhere42. Please click here to view a larger version of this figure.
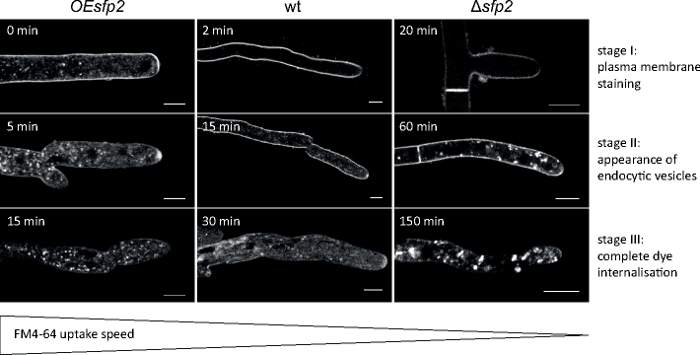
Figure 5: Influence of Sfp2 on the endocytic uptake of FM4-64. Three successive key stages of FM dye uptake are easily discernible in the wild type (wt). Stage I: exclusive plasma membrane staining, stage II: first appearance of FM dye in endocytic vesicles, and stage III: exclusive staining of endocytic vesicles and endomembranes. Equivalent staining patterns are shown at the earliest time point of their appearance. In comparison to the T. atroviride wild type, endocytosis is slightly accelerated in the sfp2 over-expressing mutant (OEsfp2), whereas dye uptake is dramatically delayed in the sfp2 deletion mutant (Δsfp2). For instance, dye uptake into the plasma membrane occurs instantly in OEsfp2 but takes 2 min in the wild type; and complete internalization of FM dye from the plasma membrane occurs 10x faster in OEsfp2 compared to Δsfp2. Scale bars = 5 μm. Figure is reproduced from Atanasova et al.9 in agreement with the Creative Commons License (https://creativecommons.org/licenses/by/4.0/). Please click here to view a larger version of this figure.
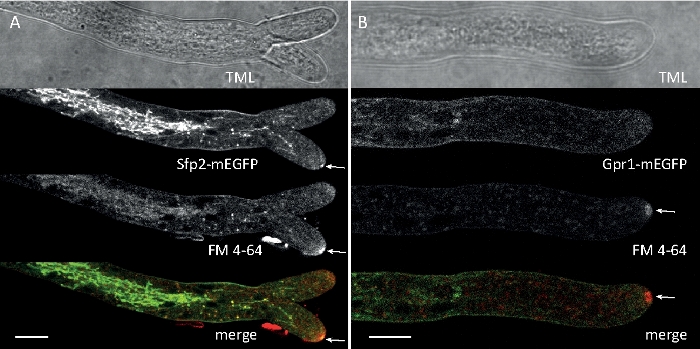
Figure 6: Co-staining of EGFP-labeled membrane proteins with FM 4-64 facilitates differentiation of distinct subcellular localization dynamics in T. atroviride. (A) The four-transmembrane domain protein Sfp2 co-localizes with FM4-64 labeled organelles, including the plasma membrane and septa, the Spitzenkörper (Spk; arrow) and presumable tubular vacuoles. (B) The GPCR-like seven-transmembrane protein Gpr1 co-localizes with FM4-64 to the same organelles as Sfp2, except the Spk. Scale bars, 10 µm. See Movie 3 and Movie 4 for full time course sequences. The figure has been modified from Atanasova et al.9 in agreement with the Creative Commons License. Please click here to view a larger version of this figure.
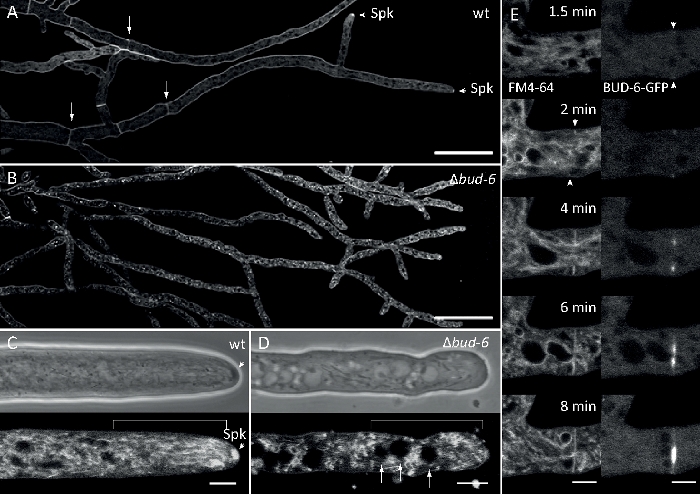
Figure 7: FM 4-64 staining differentiates Δbud-6 mutant from wild type, and localizes BUD-6 at the septal ring. (A) FM 4-64 staining of hyphae of the N. crassa wild type (arrows indicate septa; arrowheads indicate the Spk). (B) Septa and Spk are absent in ∆bud-6. Scale bars, 50 µm. (C and D) Close-up of the hyphal apex and subapex of wild type (C) and ∆bud-6 (D). Spk (arrowhead) differentiates in the wild type but not ∆bud-6. Brackets indicate the nuclear exclusion zone not established in ∆bud-6. Scale bars = 5 µm. (E) BUD-6-GFP recruitment to the incipient septation site preceding plasma membrane invagination (arrowheads) and accompanying septal constriction. Scale bars = 5 µm. See Movie 5a and Movie 5b for complete time course sequences. Figure has been reproduced with modifications from Lichius et al.16 in agreement with the Creative Commons License. Please click here to view a larger version of this figure.
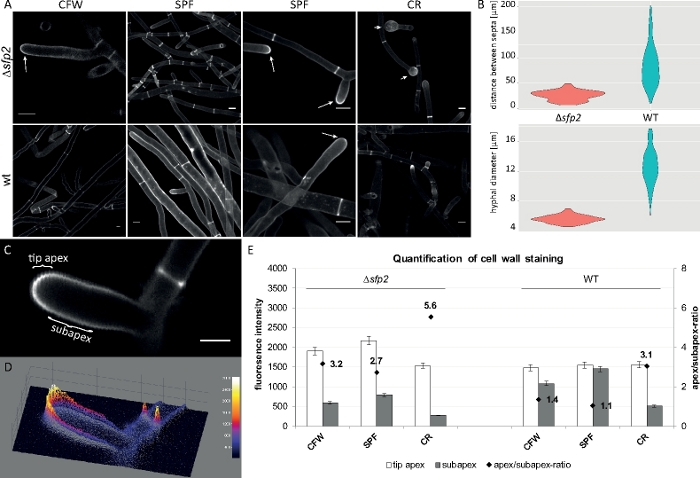
Figure 8: Deletion of sfp2 changes the deposition pattern of cell wall material and affects hyphal morphogenesis of T. atroviride. (A) CFW and SPF staining reveals increased cell wall deposition in Δsfp2 (arrows) compared to the wild type (wt). CR staining induces extensive tip swelling only in Δsfp2 (arrowheads). Scale bars = 10 µm. (B) Morphogenetic defects in Δsfp2 include significantly reduced septal distances (Δsfp2 = 26.0 µm, wild type = 85 µm; n = 60; ANOVA Pr < 2−16) and smaller hyphal diameters (∆sfp2 = 5.6 µm, wild type = 12.6 µm; n = 100; ANOVA Pr < 2−16). (C) Increased dye fluorescence in the tip apex compared to the subapex. Scale bar = 5 µm. (D) Intensity-coded 3D surface plot of (C). (E) Quantification of relative fluorescence intensities in Δsfp2 and wild type (n = 55). Figure has been reproduced from Atanasova et al.9 in agreement with the Creative Commons License. Please click here to view a larger version of this figure.
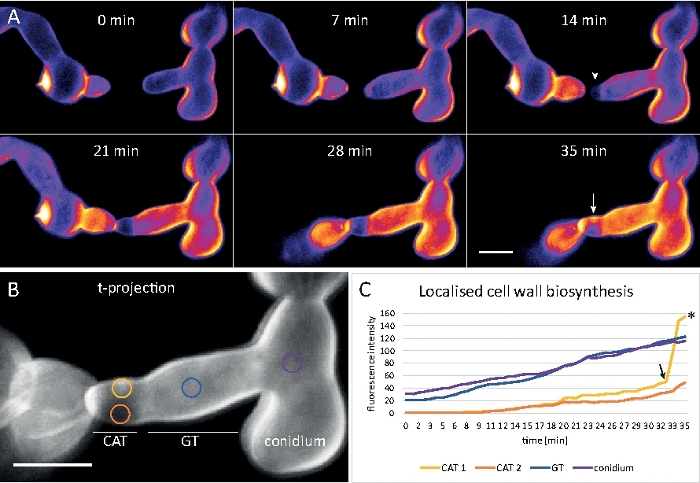
Figure 9: Real time monitoring of cell wall biosynthesis. (A) Conidial anastomosis tube (CAT) fusion between germlings of N. crassa. Physical contact becomes apparent by the germling torque response (21–28 min). Intensity color-coded CFW fluorescence indicates regions with little (dark blue) and intense (yellow) cell wall deposition. The initially unstained homing tip (arrowhead), deposits new cell wall material upon tip contact and in the area experiencing the greatest physical stress (arrow). Scale bar = 5 μm. See Movie 6 for full time course sequence. Figure reproduced from38 with permission. (B) Projection of (A) indicating four circular regions in which fluorescence intensities were measured. Scale bar = 5 μm. (C) Plot of the indicated regions showing the rapid increase in localized cell wall biosynthesis in response to physical stress (CAT 1, arrow). In the germ tube (GT) and the spore body (conidium), cell wall biosynthesis increases steadily. Please click here to view a larger version of this figure.

Movie 1: Dye-induced cell wall stress. 10 µM SPF (cyan) were added to T. atroviride hyphae expressing cytoplasmic GFP (magenta). Extensive tip staining occurs immediately, followed by the rapid lysis of hyphal compartments within 2 min; evident by the disappearance of GFP fluorescence. Please click here to download this Movie.
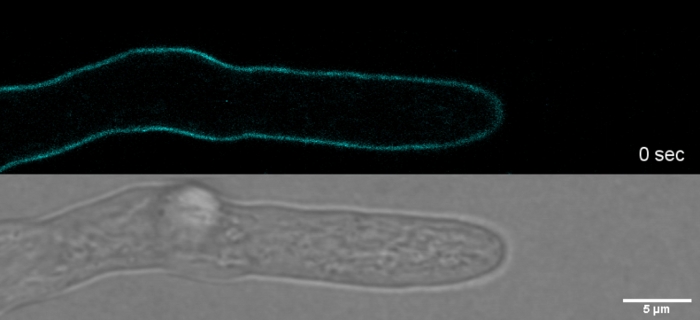
Movie 2: Vital SPF staining. 2 µM SPF (cyan) allow to track tip growth of T. atroviride hyphae with high spatial and temporal resolution without inducing cell wall stress artefacts at the tip apex. Please click here to download this Movie.
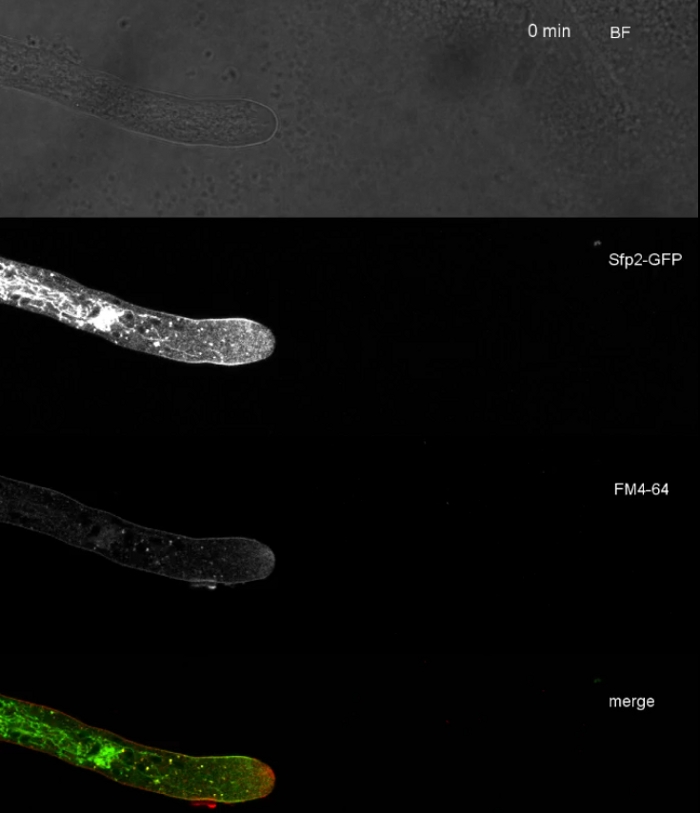
Movie 3: FM 4-64 co-staining of Sfp2-GFP. Co-staining of T. atroviride expressing Sfp2-mEGFP (green) with 1.67 µM FM 4-64 (red) reveal the overlapping and distinct localization of the membrane protein with the endocytic pathway. Please click here to download this Movie.

Movie 4: FM 4-64 co-staining of Gpr1-GFP. Co-staining of T. atroviride expressing Gpr1-mEGFP (green) with 1.67 µM FM 4-64 (red) reveal the overlapping and distinct localization of the membrane protein with the endocytic pathway. Please click here to download this Movie.
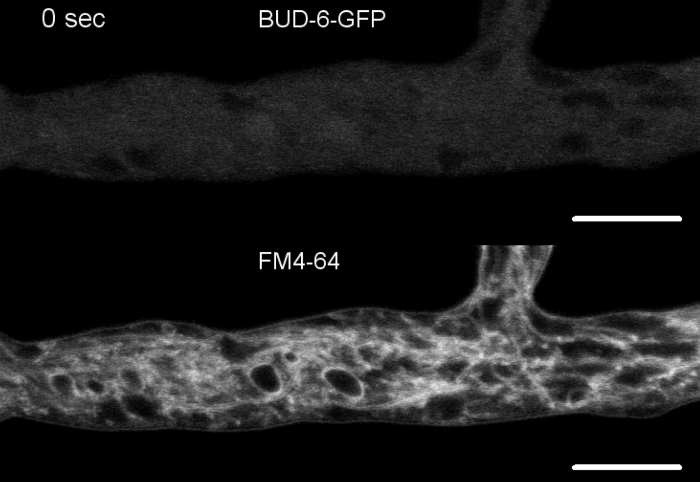
Movie 5: FM 4-64 co-staining of BUD-6-GFP. (5a) Co-staining of N. crassa expressing BUD-6-GFP (green) with 2 µM FM 4-64 (red) allow tracking of BUD-6 dynamics during septum formation relative to the associated plasma membrane invagination. (5b) Cropped and merge image of (5a). Please click here to download Movie 5a
Please click here to download Movie 5b.
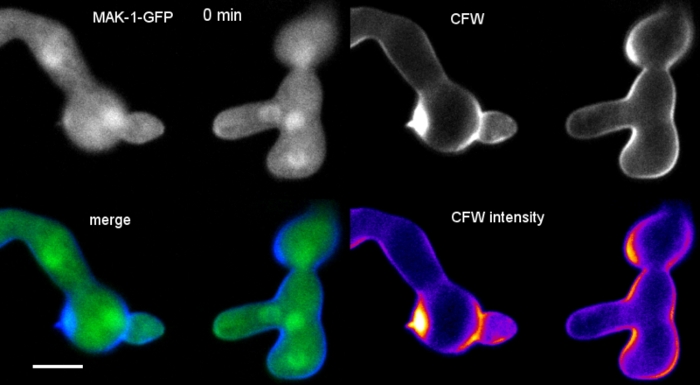
Movie 6: Real-time monitoring of cell wall biosynthesis. N. crassa germlings expressing MAK-1-GFP (green) were co-stained with 0.12 µM CFW (blue) to reveal localized cell wall biogenesis during CAT-mediated germling fusion. Note that there is some bleed through of the CFW signal into the GFP channels, illustrating that SPF or CR are better choices as sequential and simultaneous co-imaging dyes for GFP, respectively. Please click here to download this Movie.
Table 1: Properties of membrane and cell wall selective fluorescent dyes. * = mg/mL values corrected for the reduced purity/dye content to result equimolarity in all solutions; n.i.a. = no information available. Please click here to download this table.
Discussion
This article continues the ground breaking work that established the use of various fluorescent dyes as vital organelle markers for filamentous fungi in the early 2000s2,4,43, and attempts to discuss the photophysical and cell biological properties of FM dyes and selected cell wall dyes in greater detail than before. Especially with respect to unwanted cellular effects, such as membrane saturation or cell wall damage, that occur above certain dye concentrations. What previously has been considered non-toxic on the cellular level is now regarded toxic on the molecular level. Even though these effects might be very subtle and not directly evident by obvious changes in organelle or cell behavior, any possible interference of dye application other than visualization has to be minimized for the investigation of native molecular function. Fortunately, improved sensitivity and quantum efficiency of modern detectors, such as silicon avalanche photodiode detectors (Si-APDs)44 or the Airyscan area detector45, facilitate the use of even lower dye amounts than before. Another key objective of the article is to exemplify the co-imaging properties of these dyes with other fluorophores, most importantly, those of GFP as the most frequently used fluorescent protein in biology. This should aid the design of imaging experiments that aim to correlate the subcellular localization dynamics of fluorescent fusion proteins to those of the fungal cell wall, the plasma membrane or the endo- and exocytosis pathway etc.
Imaging under natural and stress-free conditions is key for the acquisition of reliable data. Some practical considerations regarding culture medium and sample preparation aim at providing a starting point for finding the optimal conditions that allow artefact-free, long time observation of healthy, unstressed cells with the highest S/N-ratio possible for any given sample. There is no universal way of achieving reliable and meaningful imaging results. It is inherent to the approach that biological variation of the sample, subjectivity and expectations of the microscopist, as well as image post processing have significant influence on data acquisition and interpretation, respectively. Hence, the practical experience of the microscopist, her/his intimate knowledge about the cell biology of the fungus under investigation, as well as skillful sample preparation to create conditions as ‘natural’ and undisturbed as possible in a lab setting, are paramount for acquiring and evaluating imaging data that truthfully reflects the studied cellular phenomena. As a rule of thumb, the occurrence of unwanted side effects of fluorescent dyes, ranging from the subtle and thus not obviously visible activation of plasma membrane or cell wall re-modelling stress response pathways to the straightforward cytotoxic induction of cell autolysis, can only be securely prevented by applying low dye concentrations ≤2 µM.
The application of fluorescent dyes is simple, yet their specificities are poorly characterized. A key strength of using fluorescent dyes is the preparative simplicity of the experimental protocols. Cultivation and sampling of the fungus, addition of the dye(s), and mounting onto the microscope stage are (with practice) straightforward. Adjustment of the basic imaging settings, including excitation and emission wavelengths, exposure times, time course settings etc., follow simple biophysical rules of the microscope and biological rules of the used fluorescent dyes inside the cells. Table 1 intends to support the identification of the most suitable dye or dye combination for experimentation. Furthermore, fluorescent dyes are reasonably priced, readily available with dependable high quality and thus ensure highly reproducible application.
Two major restrictions of using membrane or cell wall selective fluorescent dyes are the (often) limited knowledge of their precise staining properties, which in most cases are non-specific on the organelle and molecular level, and their concentration-dependent unwanted side effects. FM dyes are specific for lipid bilayers participating in endo- and exocytosis. However, precisely which subcellular organelles become successively labeled under the tested conditions is not immediately evident and requires comparison of different FM dye variants, and co-labeling with additional organelle-specific markers. The preference of FM 1-43 for mitochondrial membranes, in comparison to FM 4-64, is one example. Cell wall selective dyes display varying specificity for the three major polymers of the fungal cell wall. CFW is thought to be a non-specific stain for β-glucans and chitin, SPF is thought to be most selective for β-1,4-glucans, and CR is thought to be highly selective for α- and β-chitins. Information on the binding specificity of PFS to fungal cell wall polysaccharides is currently not available. To what ratio which fungal cell wall polymer is most effectively labeled at a given dye concentration in the fungal species under investigation is not easily answered, and the application of detailed measurements acquired in vitro or in vivo in other organisms or other fungal species must be considered very carefully. Unfortunately, this information is sparse and highly scattered in the literature35,42,46. More recent records that would follow on previous studies33 to provide new insights into the precise staining properties of the featured dyes specifically in fungi are currently not available.
Imaging controls are essential to evaluate staining patterns and cellular responses accurately. Probably the most challenging part, however, is to know the cell biology of the fungus so well that the recorded changes in the subcellular localization of membrane and cell wall selective fluorescent dyes, alterations in cellular architecture or hyphal growth pattern can exclusively and confidently be related to the intended effects of the experimental treatment. For this, it is crucial to have good controls alongside any new live-cell imaging experiment. These include the untreated wild type as negative imaging control to exclude background autofluorescence and detector noise from the acquired image, and to have a morphological comparator when working with mutants. Furthermore, a positive imaging control, for example a strain that expresses GFP or RFP in the cytoplasm or another well-known fluorescent marker protein, is essential to set the excitation light intensity to the required minimum and have a cell vitality control. Once these controls are set, the use of fluorescent dyes is not restricted to visualization tasks only, but their concentration-dependent staining dynamics, as well as concentration-dependent side effects can be analytically exploited; for instance, for quantitatively monitoring cell wall biosynthesis in real time or for the identification of mutant-specific phenotypes in susceptibility assays47.
Improved future applications depend on a detailed functional analyses of dye staining properties. A major ongoing challenge is to further improve and automate quantitative image analyses in order to advance functional evaluation of the subcellular dynamics of membrane and cell wall selective fluorescent dyes in filamentous fungi. For this, extensive, quantitative co-localization studies of these dyes with known organelle and cell wall polymer markers in combination with mutant strains deficient in particular transport pathways or that lack specific structural components are first required. Several endocytosis markers for comparative analyses with FM dyes are available48,49, and with respect to the still poorly characterized binding specificities of cell wall dyes in fungi, the application of fluorescently-labeled glucan-specific antibodies50 might provide one possibility to address this issue.
Divulgaciones
The authors have nothing to disclose.
Acknowledgements
Thanks are due to the Tyrolean Science Fund (TWF) for providing grant #256524 to AL, to the Vienna Science and Technology Fund (WWTF) for providing grant #LS13-086 to SZ, and to the Publication Fund of the University of Innsbruck for supporting open access publication. The authors also thank the Department of Zoology of the University of Innsbruck for providing the Leica TCS SP5 II confocal laser scanning microscope.
Materials
| BRAND cell counting chamber | Merck | BR718005 | Thoma format |
| Calcofluor White M2R | Merck/Sigma-Aldrich | F3543 | cell wall dye |
| CFI Plan Apo VC 60x/1.2 NA XC WI | Nikon | MRD07602 | water immersion objective |
| CFI Plan Apo VC 60x/1.2 NA XC WI | Nikon | MRD07602 | water immersion objective |
| Congo Red | Merck/Sigma-Aldrich | C6277 | cell wall dye |
| Dimethyl sulfoxide | VWR | 8,36,73,230 | organic solvent |
| Eclipse TE2000-E with C1 scanning unit | Nikon | custom configuration | inverted laser scanning confocal microscope used to acquire example data 2 and 4 |
| Eclipse TE2000-U with Bio-Rad Radiance 2100 scannig unit | Nikon | custom configuration | inverted laser scanning confocal microscope used to acquire example data 5 |
| FM 1-43 | Merck/Sigma-Aldrich | S6814 | membrane dye |
| FM 4-64 | Merck/Sigma-Aldrich | S6689 | membrane dye |
| Glass beads | Rettberg | 1340691030 | 3 mm glass beads |
| Glass cover slips | Thermo Fisher Scientific | BB02400600A113MNT0 | 24 x 60 # 1 glass cover slips |
| HCX PL APO 63x/1.3 NA Glyc | Leica | 15506353 | glycerol immersion objective |
| LSM 510 Meta | Zeiss | custom configuration | inverted laser scanning confocal microscope used to acquire example data 3 |
| M9 Minimal Medium | Merck/Sigma-Aldrich | M6030 | generic fungal growth medium |
| Micro-slide 8-well | ibidi | 80826 | ibiTreat #1.5 polymer coverslip |
| Miracloth | Merck/Millipore | 475855-1R | polyester filtration material |
| Petri dish | Sarstedt | 8,21,472 | 92 x 16 mm culture dish w/o cams |
| Phytagel | Merck/Sigma-Aldrich | P8169 | transparent gelling agent |
| Plan Apochromat 63x/1.4 NA Oil DIC | Zeiss | 440762-9904-000 | oil immersion objective |
| Pontamine Fast Scarlet 4B | Merck/Sigma-Aldrich | 212490 | cell wall dye |
| Potato Dextrose Agar (PDA) | BD Difco | 213400 | fungal growth medium for T. atroviride |
| Potato Dextrose Broth (PDB) | BD Difco | 254920 | fungal growth medium for T. atroviride |
| Reaction tube | Sarstedt | 72,706 | 1.5 mL SafeSeal tube |
| Scalpel | B.Braun | 5518016 | Cutfix sterile scalpel #23 |
| Screw cap tube | Sarstedt | 6,25,54,502 | 15 mL polypropylene tube |
| Solophenyl Flavine 7GFE 500 | CIBA | 1485385V6 | cell wall dye |
| SynaptoGreen C4 | Biotum | 70020 | membrane dye |
| SynaptoRed C2 | Biotum | 70021 | membrane dye |
| Syringe membrane filter | Thermo Fisher Scientific | 723-9945 | 0.45 µm SFCA syringe filter |
| TCS SP5 II | Leica | custom configuration | inverted laser scanning confocal microscope used to acquire example data 1 |
| Vogel's Minimal Medium (VMM) | FGSC | Fungal Genetics Stock Centre | fungal growth medium for N. crassa |
Referencias
- Read, N. D., Fischer, S., Parton, R. M. Imaging Spitzenkörper, pH and calcium dynamics in growing fungal hyphae. Pesticide Science. 54 (2), 179-181 (1998).
- Hickey, P. C., Swift, S. R., Roca, M. G., Read, N. D. Live-cell imaging of filamentous fungi using vital fluorescent dyes and confocal microscopy. Microbial Imaging. , 63-87 (2004).
- Jelínková, A., et al. Probing plant membranes with FM dyes: tracking, dragging or blocking. The Plant Journal. 61 (5), 883-892 (2010).
- Fischer-Parton, S., et al. Confocal microscopy of FM4-64 as a tool for analysing endocytosis and vesicle trafficking in living fungal hyphae. Journal of Microscopy. 198 (3), 246-259 (2000).
- Harris, S. D. Branching of fungal hyphae: regulation, mechanisms and comparison with other branching systems. Mycologia. 100 (6), 823-832 (2008).
- Roca, M. G., Arlt, J., Jeffree, C. E., Read, N. D. Cell biology of conidial anastomosis tubes in Neurospora crassa. Eukaryotic Cell. 4 (5), 911-919 (2005).
- Becker, Y., et al. The fungal cell-wall integrity MAPK cascade is crucial for hyphal network formation and maintenance of restrictive growth of Epichloë festucae in symbiosis with Lolium perenne. Molecular Plant-Microbe Interactions. 28 (1), 69-85 (2015).
- Justa-Schuch, D., Heilig, Y., Richthammer, C., Seiler, S. Septum formation is regulated by the RHO4-specific exchange factors BUD3 and RGF3 and by the landmark protein BUD4 in Neurospora crassa. Molecular Microbiology. 76 (1), 220-235 (2010).
- Atanasova, L., et al. The Gpr1-regulated Sur7 family protein Sfp2 is required for hyphal growth and cell wall stability in the mycoparasite Trichoderma atroviride. Scientific Reports. 8 (1), 12064 (2018).
- Betz, W. J., Mao, F., Bewick, G. S. Activity-dependent fluorescent staining and destaining of living vertebrate motor nerve terminals. Journal of Neuroscience. 12 (2), 363-375 (1992).
- Wu, Y., Yeh, F. L., Mao, F., Chapman, E. R. Biophysical characterization of styryl dye-membrane interactions. Biophysical Journal. 97 (1), 101-109 (2009).
- Betz, W. J., Mao, F., B, S. C. Imaging exocytosis and endocytosis. Current Opinion in Neurobiology. 6, 365-371 (1996).
- Hoopmann, P., Rizzoli, S. O., Betz, W. J. Imaging synaptic vesicle recycling by staining and destaining vesicles with FM dyes. Cold Spring Harbor Protocols. 2012 (1), 77-83 (2012).
- Bolte, S., et al. FM-dyes as experimental probes for dissecting vesicle trafficking in living plant cells. Journal of Microscopy. 214, 159-173 (2004).
- Riquelme, M., et al. Spitzenkorper localization and intracellular traffic of green fluorescent protein-labeled CHS-3 and CHS-6 chitin synthases in living hyphae of Neurospora crassa. Eukayotic Cell. 6 (10), 1853-1864 (2007).
- Lichius, A., Yáñez-Gutiérrez, M. E., Read, N. D., Castro-Longoria, E. Comparative live-cell imaging analyses of SPA-2, BUD-6 and BNI-1 in Neurospora crassa reveal novel features of the filamentous fungal polarisome. PloS one. 7 (1), 30372 (2012).
- Peñalva, M. A. Tracing the endocytic pathway of Aspergillus nidulans with FM4-64. Fungal Genetics and Biology. 42 (12), 963-975 (2005).
- Dijksterhuis, J., Molenaar, D. Vesicle trafficking via the Spitzenkörper during hyphal tip growth in Rhizoctonia solani. Antonie van Leeuwenhoek. 103 (4), 921-931 (2013).
- Hickey, P. C., Read, N. D. Imaging living cells of Aspergillus in vitro. Medical Mycology. 47, 110-119 (2009).
- Delgado-Álvarez, D. L., Bartnicki-García, S., Seiler, S., Mouriño-Pérez, R. R. Septum development in Neurospora crassa: the septal actomyosin tangle. PLoS One. 9 (5), 96744 (2014).
- Hageage, G. J., Harrington, B. J. Use of Calcofluor White in clinical mycology. Laboratory Medicine. 15 (2), 109-112 (1984).
- Monheit, J. E., Cowan, D. F., Moore, D. G. Rapid detection of fungi in tissues using Calcofluor White and fluorescence microscopy. Archives of Pathology and Laboratory. 108 (8), 616-618 (1984).
- Herth, W., Schnepf, E. The fluorochrome Calcofluor White binds oriented to structural polysaccharide fibrils. Protoplasma. 105 (1-2), 129-133 (1980).
- Elorza, M. V., Rico, H., Sentandreu, R. Calcofluor White alters the assembly of chitin fibrils in Saccharomyces cerevisiae and Candida albicans cells. Journal of General Microbiology. 129 (5), 1577-1582 (1983).
- Lagorce, A., et al. Genome-wide analysis of the response to cell wall mutations in the yeast Saccharomyces cerevisiae. Journal of Biological Chemistry. 278 (22), 20345-20357 (2003).
- Sanz, A. B., García, R., Rodríguez-Peña, J. M., Arroyo, J. The CWI Pathway: regulation of the transcriptional adaptive response to cell wall stress in yeast. Journal of Fungi. 4 (1), (2017).
- Slifkin, M., Cumbie, R. Congo Red as a fluorochrome for the rapid detection of fungi. Journal of Clinical Microbiology. 26 (5), 827-830 (1988).
- Michels, J., Büntzow, M. Assessment of Congo Red as a fluorescence marker for the exoskeleton of small crustaceans and the cuticle of polychaetes. Journal of Microscopy. 238 (2), 95-101 (2010).
- Pancaldi, S., Poli, F., Dall’Olio, G., Vannini, G. L. Morphological anomalies induced by Congo Red in Aspergillus niger. Archives of Microbiology. 137 (3), 185-187 (1984).
- Roncero, C., Durán, A. Effect of Calcofluor White and Congo Red on fungal cell wall morphogenesis: in vivo activation of chitin polymerization. Journal of Bacteriology. 163 (3), 1180-1185 (1985).
- Kopeck, M., Gabriel, M. The influence of Congo Red on the cell wall and (1,3)- β-d-glucan microfibril biogenesis in Saccharomyces cerevisiae. Archives of Microbiology. 158 (2), 115-126 (1992).
- Heilmann, C. J., et al. Surface stress induces a conserved cell wall stress response in the pathogenic fungus Candida albicans. Eukayotic Cell. 12 (2), 254-264 (2013).
- Hoch, H. C., Galvani, C. D., Szarowski, D. H., Turner, J. N. Two new fluorescent dyes applicable for visualization of fungal cell walls. Mycologia. 97 (3), 580-588 (2005).
- Liesche, J., Ziomkiewicz, I., Schulz, A. Super-resolution imaging with Pontamine Fast Scarlet 4BS enables direct visualization of cellulose orientation and cell connection architecture in onion epidermis cells. BMC Plant Biology. 13, 226 (2013).
- Ursache, R., Andersen, T. G., Marhavý, P., Geldner, N. A protocol for combining fluorescent proteins with histological stains for diverse cell wall components. The Plant Journal. 93 (2), 399-412 (2018).
- Knight, N. L., Sutherland, M. W. A rapid differential staining technique for Fusarium pseudograminearum in cereal tissues during crown rot infections. Plant Pathology. 60 (6), 1140-1143 (2011).
- Fajardo-Somera, R. A., et al. Dissecting the function of the different chitin synthases in vegetative growth and sexual development in Neurospora crassa. Fungal Genetics and Biology. 75, 30-45 (2015).
- Lichius, A. . Cell Fusion in Neurospora crassa. , (2010).
- Chen, W., Li, W., Dong, X., Pei, J. A Review of Biological Image Analysis. Current Bioinformatisc. 13 (4), 337-343 (2018).
- Goldman, R. D., Swedlow, J., Spector, D. L. . Live cell imaging: A laboratory manual. , (2010).
- Eliceiri, K. W., et al. Biological imaging software tools. Nature methods. 9 (7), 697-710 (2012).
- Zemanek, G., Jagusiak, A., Chłopaś, K., Piekarska, B., Stopa, B. Congo Red fluorescence upon binding to macromolecules – a possible explanation for the enhanced intensity. Bio-Algorithms and Med-Systems. 13 (2), 1187 (2017).
- Hickey, P. C., Jacobson, D. J., Read, N. D., Louise Glass, N. Live-cell imaging of vegetative hyphal fusion in Neurospora crassa. Fungal Genetics and Biology. 37 (1), 109-119 (2002).
- . Hamamatsu Si APD – high sensitivity photodiodes having an internal gain mechanism: Avalanche photodiode selection guide 2019 Available from: https://www.hamamatsu.com/resources/pdf/ssd/si_apd_kapd0001e.pdf (2019)
- Huff, J. The Airyscan detector from ZEISS: confocal imaging with improved signal-to-noise ratio and super-resolution. Nature Methods. 12, 1205 (2015).
- Thomas, J., Idris, N. A., Collings, D. A. Pontamine Fast Scarlet 4B bifluorescence and measurements of cellulose microfibril angles. Journal of Microscopy. 268 (1), 13-27 (2017).
- Ram, A. F. J., Klis, F. M. Identification of fungal cell wall mutants using susceptibility assays based on Calcofluor White and Congo Red. Nature Protocols. 1 (5), 2253-2256 (2006).
- Toshima, J. Y., et al. Spatial dynamics of receptor-mediated endocytic trafficking in budding yeast revealed by using fluorescent alpha-factor derivatives. Proceedings of the National Academy of Science of the USA. 103 (15), 5793-5798 (2006).
- Kilaru, S., Schuster, M., Latz, M., Guo, M., Steinberg, G. Fluorescent markers of the endocytic pathway in Zymoseptoria tritici. Fungal Genetics and Biology. 79, 150-157 (2015).
- Fu, C., Tanaka, A., Free, S. J. Neurospora crassa 1,3-α-glucan synthase, AGS-1, is required for cell wall biosynthesis during macroconidia development. Microbiology. 160, 1618-1627 (2014).

