Toxicity Study of Zinc Oxide Nanoparticles in Cell Culture and in Drosophila melanogaster
Summary
We describe a detailed protocol for evaluating the toxicological profiles of zinc oxide nanoparticles (ZnO NPs) in particular, the type of cell death in human MRC5 lung fibroblasts and ROS formation in the fruit fly Drosophila.
Abstract
Zinc oxide nanoparticles (ZnO NPs) have a wide range of applications, but the number of reports on ZnO NP-associated toxicity has grown rapidly in recent years. However, studies that elucidate the underlying mechanisms for ZnO NP-induced toxicity are scanty. We determined the toxicity profiles of ZnO NPs using both in vitro and in vivo experimental models. A significant decrease in cell viability was observed in ZnO NP-exposed MRC5 lung fibroblasts, showing that ZnO NPs exert cytotoxic effects. Similarly, interestingly, gut exposed to ZnO NPs exhibited a dramatic increase in reactive oxygen species levels (ROS) in the fruit fly Drosophila. More in-depth studies are required to establish a risk assessment for the increased usage of ZnO NPs by consumers.
Introduction
Nanotechnology refers to the application of nanosized materials that are used across all scientific fields, including medicine, materials science, and biochemistry. For instance, ZnO NPs which are known for their ultraviolet scattering, chemical sensing, and anti-microbial properties, as well as high electrical conductivity, are utilized in the production of various consumer products such as food packaging, cosmetics, textiles, rubbers, batteries, catalyst for automobile tail gas treatment, and biomedical-related applications1,2,3.
However, the burgeoning applications of ZnO NP-based products, leading to increased human exposure to ZnO NPs, have raised concerns on their potential adverse effects on human health. A number of in vitro cellular studies have demonstrated that ZnO NPs can induce oxidative stress, autophagy-related cytotoxicity, inflammation, and genotoxicity4,5,6,7,8. Notably, the toxicity of ZnO NPs is assumed to be caused by the dissolution of Zn to free Zn2+ ions, as well as the surface reactivity of ZnO, resulting in the cellular ionic and metabolic imbalances that are linked with impaired ionic homeostasis and an inhibition of ion transportation4,7,9,10. Importantly, studies have shown that the generation of reactive oxygen species (ROS) is one of the primary mechanisms underlying ZnO NPs-associated toxicity. Insufficient anti-oxidative activity following ROS insult has been shown to be responsible for eliciting the cytotoxicity and DNA damage9. The toxic effects of ZnO NPs have also been reported in animal models, including rodent1, zebrafish11,12, as well as the invertebrate Drosophila13.
Drosophila serves as a well-established alternative animal model for toxicity screening of chemical entities and nanomaterials (NMs)14,15. Importantly, there are high levels of genetic and physiological similarity between human and Drosophila that justifies the use of Drosophila as an in vivo model for evaluating biological responses to environmental contaminants such as NMs16. Furthermore, there are many advantages of using Drosophila due to its small size, short lifespan, genetic amenability, and easy and cost-effective maintenance. Moreover, Drosophila has been widely adopted for the study of genetics, molecular and developmental biology, ever since its full genome was fully sequenced years ago back in 2000, therefore making it suitable for a variety of high-throughput screening and for tackling unresolved biological questions17,18,19,20,21. In recent years, a number of studies related to immunotoxicity using different types of NPs in Drosophila have been reported15,22,23,24. This fundamental new knowledge obtained from the studies using Drosophila has helped to provide more insights into our understanding of nanotoxicology.
ROS is a well-known culprit for cytotoxicity and genotoxicity caused by NPs, in particular, metal-based NPs25. ROS are oxygen-containing chemical species with higher reactive properties than molecular oxygen. Free radicals such as superoxide radical (O2–) and even, non-radical molecules such as hydrogen peroxide (H2O2) can act as ROS. Under normal physiological condition, they are required to maintain cellular homeostasis26, however, excessive ROS due to overproduction or dysregulation of the antioxidant defense system can cause oxidative stress, leading to damage to proteins, lipids and deoxyribonucleic acid (DNA)27. For instance, as ROS levels increase and glutathione (GSH) level decreases concomitantly, disruption of adenosine triphosphate (ATP) synthesis takes place and lactate dehydrogenase (LDH) level increases in the medium, culminating in cell death27.
Here, we provide protocols for performing cellular and genetic analyses using cultured mammalian cells and Drosophila to determine the potential adverse effects of ZnO NPs. An overview of the method used for the toxicity study of ZnO NPs is shown in Figure 1.
Protocol
1. Fluorescence Activated Cell Sorting (FACS) Analysis on Lived/Fixed cells
- Sonicate ZnO NPs in suspension for 15 min.
- Prepare ZnO NPs at various concentrations (e.g., 0, 10, 25, 50,100 and 200 µg/mL) using 1 mg/mL ZnO NP stock solution for the treatment of cultured cells.
- Seed MRC5 human lung fibroblasts (1 x 10⁵ cells/well) onto a 6-well culture plate a day in advance, and then treat the cells with 2 mL of ZnO NPs (in triplicates) for 8 h, 16 h, and 24 h.
- At each time point, collect the cells by centrifuging at 300 x g for 5 min.
- Wash the cell pellets twice with phosphate buffered saline (PBS).
- Resuspend the cells with 1x binding buffer, which is composed of 0.1 M HEPES/sodium hydroxide (NaOH), 1.4 M sodium chloride (NaCl), and 25 mM calcium chloride (CaCl2), at a concentration of 1 x 10⁵ cells per 100 µL.
- Add 5 µL of Fluorescein isothiocyanate (FITC) Annexin V stain and 5 µL of propidium iodide (PI) DNA stain, and incubate the cells for 15 min at room temperature (RT; 25 °C) in dark.
- Top up the samples with an additional 400 µL of 1x binding buffer before sorting the cells by flow cytometry. A minimum of 10,000 cells is analyzed for each sample.
- Tabulate the bar chart using the median intensity obtained.
2. Exposure of ZnO NPs to Drosophila
- Add 1 mL of nanoparticles at different concentrations into vials, followed by 9 mL of fly food to make a final concentration of 0.1 mg/mL, 0.25 mg/mL or 0.5 mg/mL ZnO NPs.
- Mix the nanoparticles with food thoroughly in the vials using the pipette.
- Allow fly food containing ZnO NPs to cool for at least 2-3 h before use.
- Introduce adult male and female flies into the vials for 5 days, and allow them to mate and lay eggs (which appear as white spots) on the surface of the food.
- Remove the parental flies, and allow the eggs to undergo further development, which consists of 4 different developmental stages (embryonic, larval, pupal and adult stage).
3. Dissection of Fly
- Collect late 3rd instar larvae from the wall of the vials for analyses. Freshly laid eggs normally develop into late 3rd instar larvae after 72-120 h at RT.
- Clean the dissection dish and fill up the well with dissection medium/PBS.
- Dissect the larvae (late 3rd instar) under the stereomicroscope, using a pair of forceps.
- Use the tip of the forceps to make a tiny hole and break open the cuticle layer of the larvae. Carefully pull out the gut and place it into a 1.5 mL microcentrifuge tube containing Schneider's Drosophila medium, prior to the fixing step using 1 mL of 4% paraformaldehyde (PF).
- 3.5Fix the gut in PF for 10 min at RT, for subsequent experiments, such as immunostaining.
4. ROS Detection Using Dihydroethidium (DHE) Staining
- Treat larvae with various concentrations of ZnO NPs as described in step 2.1.
- Following the dissection of the gut from 3rd instar larvae as described under section 3, incubate the gut in Schneider's Drosophila medium at RT before tissue staining is performed. Dissolve 1 µL of DHE dye (from the stock concentration of 30 mM) in 1 mL of Schneider's medium, making a final working concentration of 10-30 µM DHE dye.
- Incubate the gut for 5 min at RT in dark, and then wash three times using Schneider's medium for every 5 min.
- Fix the gut with 4% PF (optional step) and mount the gut onto glass slides, with anti-fade mounting medium containing 4′,6-diamidino-2-phenylindole (DAPI). Capture images under a confocal microscope.
5. Measuring Fluorescence Using ImageJ Software
- Import the captured fluorescence images acquired using fluorescence microscopy or confocal laser scanning microscopy into the ImageJ software.
- Click on the Analyze menu and select Set measurements.
- Select the output measure such as area integrated intensity and mean grey value.
- Click Measure.
- Select a region without fluorescence to set the background.
- Export the data into the Excel spreadsheet and determine the corrected total cell fluorescence (CTCF), using the calculation as shown below.
CTCF = Integrated Density – (Area of selected cell X Mean fluorescence of background readings) - Construct a bar chart and perform statistical analysis.
Representative Results
NP-exposed cells were processed with the cell staining reagent kit, followed by cell sorting using flow cytometry. ZnO NP-treated cells (bottom, right panel) exhibit a higher percentage of early (R3)/ late apoptotic cells (R6) than control cells (R5, bottom, left panel). Necrotic cell death is denoted by R4 (top, right panel) (Figure 2). The results of the FITC/Annexin V Assay on ZnO NP-treated MRC-5 fibroblasts are shown in Figure 2.
For the Drosophila experiments, sonicated ZnO NPs at various concentrations were added to fly food in 10 mL tubes and then mixed well using a pipette controller (Figure 3). Late third instar larvae collected from vials were dissected under the stereomicroscope. The larvae were first washed to remove remnants of remaining food (Figure 4). The outer cuticle layer was torn apart to expose internal organs. The gut was identified by the characteristic long and semitransparent appearance (whereas other organs appear opaque and light yellowish under the microscope) (Figure 5). The gut was carefully removed, without breaking, and transferred into a new microcentrifuge tube containing fixative on ice (Figure 6).
For the quantitation of fluorescence intensity such as the intensity of the DHE probe in the gut, the images were exported in JPEG or TIFF formats and opened with the ImageJ software. The part of the gut for analysis was selected and identified, for example, the midgut or hindgut region, and the fluorescence intensity of the region of interest (ROI) was measured. To compare the relative intensities of the different experimental groups, we employed the same quantitative confocal microscopy method described in the previous section. For comparison of fluorescence intensities, the parameter was set using the negative untreated control. Calculations of the signal intensity on the basis of calibration intensities of untreated control allowed a direct comparison between different experimental groups. Figure 7 shows the average intensity of the DHE signal in the 3rd instar larval gut exposed to ZnO NPs at different concentrations. The gut of larvae treated with 0.5 mg/mL of ZnO NP treatment showed the highest fluorescence intensity.
The differences in relative intensities between all the experimental groups were further tabulated, and statistical analysis was performed, providing both qualitative and quantitative results (Figure 8).
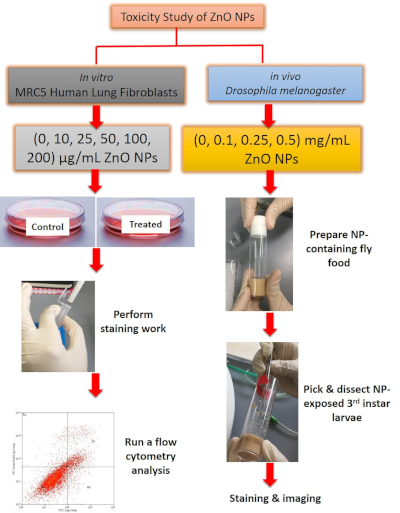
Figure 1: Overview of the method used for toxicity study of ZnO NPs. For in vitro work, ZnO NP-treated cells were stained prior to flow cytometry analysis. For in vivo work, gut was dissected from 3rd instar larvae, followed by staining with DHE dye and image acquisition. Please click here to view a larger version of this figure.
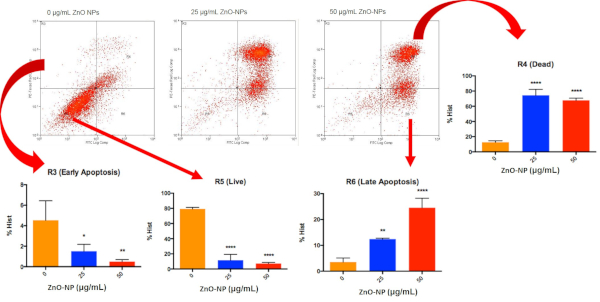
Figure 2: Dot plot of cells separated into different populations based on their FITC and PE staining. The pictograms show the results of FITC/Annexin V assay with 24 h treatment of ZnO-NPs on MRC-5. Statistical analysis of the cells at different stages can then be performed. Please click here to view a larger version of this figure.
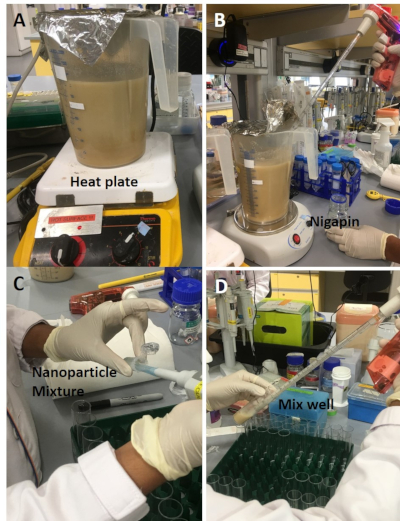
Figure 3: Preparation of ZnO NP-containing fly food medium. (A) Ingredients for fly food are added to water, allowed to swell, and boiled for 5 min. (B) After cooling down to 50 °C with stirring, Nipagin was added and mixed thoroughly. (C) Prepare a master mix for the nanoparticles (total volume not exceeding 10% of the final food volume). (D) Medium is then aliquoted, mixed with ZnO NPs at various concentrations and allowed to cool down completely before storage. Please click here to view a larger version of this figure.
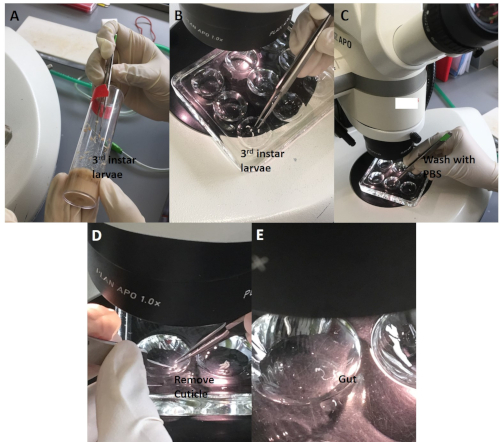
Figure 4: The whole gut dissection procedure. (A) Transfer 3rd instar larvae to a dissection disc. (B) Use forceps to gently hold a larva, and (C) wash away the remnant of food using saline. (D) Gently tear the cuticle apart without touching the gut and other internal organs. (E) Place the gut into the saline for subsequent procedure. Please click here to view a larger version of this figure.
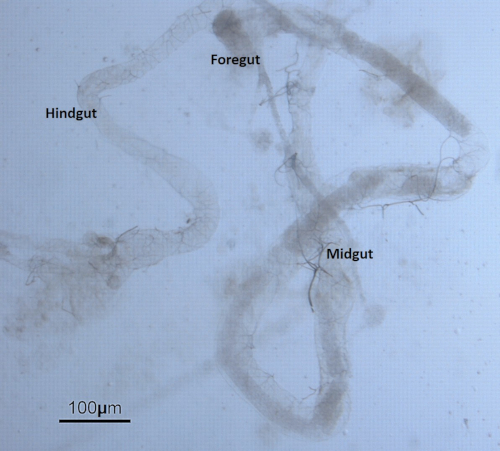
Figure 5: The anatomy of the digestive tract/gut. The gut extracted from the Drosophila larva is divided into three discrete domains of different developmental origin namely the foregut, midgut, and hindgut. Please click here to view a larger version of this figure.
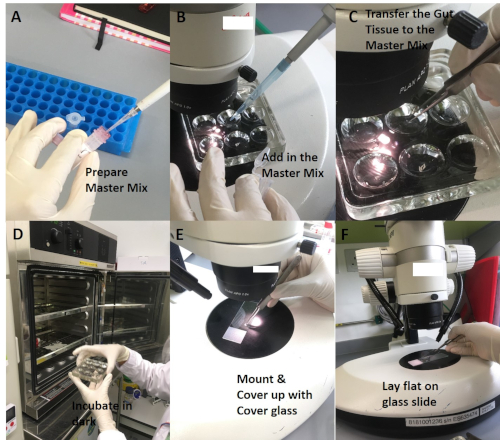
Figure 6: Staining of the gut tissue with DHE. (A) Prepare a master mix containing growth medium and DHE (a final concentration of 30 µM). (B) Add the master mix into the well of a dissection disc. (C) Transfer the dissected gut tissue into the well containing the DHE master mix. (D) Incubate at RT for 5 min and protect the tissue from light; wash 3x in PBS/saline for 5min. (E) Fix in 4% PF for 10 min; wash the tissue three times with PBS (optional). (F) Gently transfer the gut onto a glass slide, lay flat without having any tissue folded and mount with mounting medium before covering with cover glass. Please click here to view a larger version of this figure.

Figure 7: ZnO NPs induce ROS in the gut of Drosophila larvae. (a) DHE stain in control gut shows the basal level of ROS. (b and c) Treated gut cells show a gradual increase in DHE intensity in a dose-dependent manner. Please click here to view a larger version of this figure.
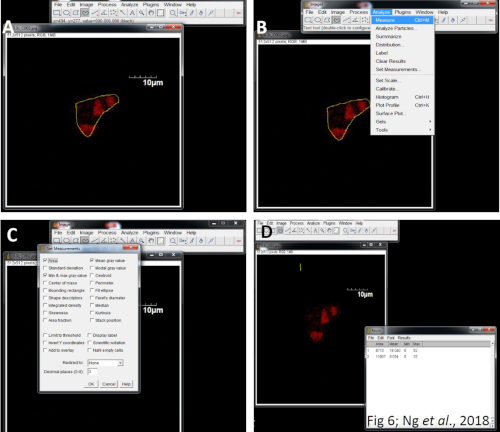
Figure 8: Quantitation of fluorescent images using ImageJ. (A) Import the captured images. (B) Click on the Analyze menu and select Set measurements. (C) Select the area integrated intensity and mean grey value. Select a region without fluorescence to set the background. (D) Export the data into Excel and calculate the CTCF for subsequent statistical analysis. Please click here to view a larger version of this figure.
Discussion
In order to assess if ZnO NP can induce apoptosis in MRC5 fibroblasts, we use flow cytometry to distinguish the cells from necrotic or apoptotic cell death. In normal live cells, phosphatidylserine (PS) is localized at the cell membrane. If apoptosis occurs, PS is translocated to the extracellular leaflet of the plasma membrane, allowing the binding of Annexin V labeled with fluorescein (FITC Annexin V)29. On the other hand, the red-fluorescent propidium iodide (PI), a nucleic acid binding dye, is impermeable to living cells and apoptotic cells but stains dead cells30. This allows us to identify the dead cells (red and green), apoptotic cells (green fluorescence) and live cells (little or no fluorescence), using a flow cytometer with the 488 nm line of an argon-ion laser for excitation.
For DHE staining of the Drosophila gut, it is important to reconstitute the dye with DMSO just before you start the experiment, as prolonged storage may lead to an auto-oxidation of the dye that turns the dye into dark/purplish color31,32. In addition, the reconstituted stock solutions also tend to expire rather quickly, so one has to pay attention to the "expiry date". Alternatively, fluorogenic probes such as the green version of the photostable probe, which has the added ability to be multiplexed with stains, and produces much clearer signals than DHE, could be used. The dissected gut was transferred to Schneider's medium containing the dye at the desired concentration with no fixative added. This is to permit the incorporation of the dye in live cells, and hence staining is performed in the culture medium, to allow for better respiration of the cells.
With regard to the quantitation of DHE staining, for a start, avoid saturation of the pixels in control untreated cells. The imaging software program was used to determine exposure time by visually flagging saturated pixels. The untreated sample was used to set the exposure time and maintain the same parameters when capturing images for comparison of the intensity across different treatment groups which is important for quantification of the fluorescence image intensity later on. It is essential to acquire all images (control and treated samples) using the same system and acquisition settings/parameters, and the background should be standardized for all images (so that there is consistency for background subtraction)33.
Divulgaciones
The authors have nothing to disclose.
Acknowledgements
The study was supported by the grant number R706-000-043-490. The study does not represent the view of the grant sponsor.
Materials
| 15% Methyl 4-Hydroxybenzoate | Sigma Aldrich | ||
| 4% Paraformaldehyde | Sigma Aldrich | P6148 | |
| Bacto Agar | BD biosciences | ||
| cncCK6/TM3, Sb | a gift from Dr. Kerppola T | ||
| cornmeal, glucose, yeast brewer | Sigma Aldrich | ||
| CyAn ADP with Summit Software | DAKO | https://flow.usc.edu/files/2014/07/BC-Cyan-ADP-User-Guide-2016.pdf | |
| Dihydroethidium (Hydroethidine) | Thermo Fisher Scientific | D11347 | |
| FITC Annexin V Apoptosis Detection Kit I | BD biosciences | 556547 | |
| Fluorescent microscope | Olympus | ||
| Glucolin | Supermarket | ||
| Image J software | NIH | ||
| MRC5 human lung fibroblast | ATCC | CCL-171 | |
| Schneider’s Drosophila medium | Thermo Fisher Scientific | 21720-024 | |
| vectashield antifade mounting medium with DAPI | Vector Laboratories | H-1200 | |
| wild- type Canton-S; Sod2N308/CyO | NIG-FLY | ||
| Zinc Oxide Nanoparticles | Sigma Aldrich | 721077 | Refer Sheet 2 |
Referencias
- Kim, Y. R., et al. Toxicity of 100 nm zinc oxide nanoparticles: a report of 90-day repeated oral administration in Sprague Dawley rats. International Journal of Nanomedicine. 9 Suppl 2, 109-126 (2014).
- Xie, Y., He, Y., Irwin, P. L., Jin, T., Shi, X. Antibacterial activity and mechanism of action of zinc oxide nanoparticles against Campylobacter jejuni. Applied and Environmental Microbiology. 77, 2325-2331 (2011).
- Colvin, V. L. The potential environmental impact of engineered nanomaterials. Nature Biotechnology. 21, 1166-1170 (2003).
- De Angelis, I., et al. Comparative study of ZnO and TiO(2) nanoparticles: physicochemical characterisation and toxicological effects on human colon carcinoma cells. Nanotoxicology. 7, 1361-1372 (2013).
- Johnson, B. M., et al. Acute exposure to ZnO nanoparticles induces autophagic immune cell death. Nanotoxicology. 9, 737-748 (2015).
- Singh, N., et al. NanoGenotoxicology: the DNA damaging potential of engineered nanomaterials. Biomaterials. 30, 3891-3914 (2009).
- Song, W., et al. Role of the dissolved zinc ion and reactive oxygen species in cytotoxicity of ZnO nanoparticles. Toxicology Letters. 199, 389-397 (2010).
- Wahab, R., et al. ZnO nanoparticles induced oxidative stress and apoptosis in HepG2 and MCF-7 cancer cells and their antibacterial activity. Colloids and Surfaces B: Biointerfaces. 117, 267-276 (2014).
- Namvar, F., et al. Cytotoxic effects of biosynthesized zinc oxide nanoparticles on murine cell lines. Evidence-Based Complementary and Alternative. 2015, (2015).
- Wong, S. W., Leung, P. T., Djurisic, A. B., Leung, K. M. Toxicities of nano zinc oxide to five marine organisms: influences of aggregate size and ion solubility. Analytical and Bioanalytical Chemistry. 396, 609-618 (2010).
- Hua, J., Vijver, M. G., Richardson, M. K., Ahmad, F., Peijnenburg, W. J. Particle-specific toxic effects of differently shaped zinc oxide nanoparticles to zebrafish embryos (Danio rerio). Environmental Toxicology and Chemistry. 33, 2859-2868 (2014).
- Zhao, X., Wang, S., Wu, Y., You, H., Lv, L. Acute ZnO nanoparticles exposure induces developmental toxicity, oxidative stress and DNA damage in embryo-larval zebrafish. Aquatic Toxicology. 136-137, 49-59 (2013).
- Alaraby, M., Annangi, B., Hernandez, A., Creus, A., Marcos, R. A comprehensive study of the harmful effects of ZnO nanoparticles using Drosophila melanogaster as an in vivo model. Journal of Hazardous Materials. 296, 166-174 (2015).
- Rand, M. D. Drosophotoxicology: the growing potential for Drosophila in neurotoxicology. Neurotoxicology and Teratology. 32, 74-83 (2010).
- Ong, C., Yung, L. Y., Cai, Y., Bay, B. H., Baeg, G. H. Drosophila melanogaster as a model organism to study nanotoxicity. Nanotoxicology. 9, 396-403 (2015).
- Hoffmann, J. A., Reichhart, J. M. Drosophila innate immunity: an evolutionary perspective. Nature Immunology. 3, 121-126 (2002).
- Hughes, T. T., et al. Drosophila as a genetic model for studying pathogenic human viruses. Virology. 423, 1-5 (2012).
- Jennings, B. H. Drosophila – a versatile model in biology & medicine. Materials Today. 14, 190-195 (2011).
- Adams, M. D., Sekelsky, J. J. From sequence to phenotype: reverse genetics in Drosophila melanogaster. Nature Reviews Genetics. 3, 189-198 (2002).
- Adams, M. D., et al. The genome sequence of Drosophila melanogaster. Science. 287, 2185-2195 (2000).
- Ong, C., et al. Silver nanoparticles disrupt germline stem cell maintenance in the Drosophila testis. Scientific Reports. 6, (2016).
- Alaraby, M., Demir, E., Hernandez, A., Marcos, R. Assessing potential harmful effects of CdSe quantum dots by using Drosophila melanogaster as in vivo model. Science of the Total Environment. 530-531, 66-75 (2015).
- Barik, B. K., Mishra, M. Nanoparticles as a potential teratogen: a lesson learnt from fruit fly. Nanotoxicology. , 1-27 (2018).
- Jovanovic, B., et al. The effects of a human food additive, titanium dioxide nanoparticles E171, on Drosophila melanogaster – a 20 generation dietary exposure experiment. Scientific Reports. 8, (2018).
- Cao, Y. The Toxicity of Nanoparticles to Human Endothelial Cells. Advances in Experimental Medicine and Biology. 1048, 59-69 (2018).
- Akhtar, M. J., Ahamed, M., Alhadlaq, H. A., Alshamsan, A. Mechanism of ROS scavenging and antioxidant signalling by redox metallic and fullerene nanomaterials: Potential implications in ROS associated degenerative disorders. Biochimica Et Biophysica Acta-General Subjects. 1861, 802-813 (2017).
- Akter, M., et al. A systematic review on silver nanoparticles-induced cytotoxicity: Physicochemical properties and perspectives. Journal of Advanced Research. 9, 1-16 (2018).
- Vecchio, G. A fruit fly in the nanoworld: once again Drosophila contributes to environment and human health. Nanotoxicology. 9, 135-137 (2015).
- Marino, G., Kroemer, G. Mechanisms of apoptotic phosphatidylserine exposure. Cell Research. 23, 1247-1248 (2013).
- Stoddart, M. J. Cell Viability Assays: Introduction. Mammalian Cell Viability: Methods and Protocols. , (2011).
- Yazdani, M. Concerns in the application of fluorescent probes DCDHF-DA, DHR 123 and DHE to measure reactive oxygen species in vitro. Toxicology in Vitro. 30, 578-582 (2015).
- Chen, J., Rogers, S. C., Kavdia, M. Analysis of kinetics of dihydroethidium fluorescence with superoxide using xanthine oxidase and hypoxanthine assay. Annals of Biomedical Engineering. 41, 327-337 (2013).
- Hartig, S. M. Basic image analysis and manipulation in ImageJ. Current Protocols in Molecular Biology. , (2013).

