Automated Image-Based Quantification of Neutrophil Extracellular Traps Using NETQUANT
Summary
Here, we present a protocol for generating neutrophil extracellular traps (NETs) and operating NETQUANT, a fully automatic software option for quantification of NETs in immunofluorescence images.
Abstract
Neutrophil extracellular traps (NETs) are web-like antimicrobial structures consisting of DNA and granule derived antimicrobial proteins. Immunofluorescence microscopy and image-based quantification methods remain important tools to quantitate neutrophil extracellular trap formation. However, there are key limitations to the immunofluorescence-based methods that are currently available for quantifying NETs. Manual methods of image-based NET quantification are often subjective, prone to error and tedious for users, especially non-experienced users. Also, presently available software options for quantification are either semi-automatic or require training prior to operation. Here, we demonstrate the implementation of an automated immunofluorescence-based image quantification method to evaluate NET formation called NETQUANT. The software is easy to use and has a user-friendly graphical user interface (GUI). It considers biologically relevant parameters such as an increase in the surface area and DNA:NET marker protein ratio, and nuclear deformation to define NET formation. Furthermore, this tool is built as a freely available app, and allows for single-cell resolution quantification and analysis.
Introduction
Neutrophils are crucial mediators of innate host defense responses against a wide variety of microbial pathogens1. They execute their antimicrobial functions by releasing their granules containing a wide array of antimicrobial proteins2, producing reactive oxygen species (ROS) and hypochlorite1, and through phagocytosis3. In addition, Brinkmann et al.4 described neutrophil extracellular traps (NETs) as a novel mechanism by which neutrophils trap and eliminate invading pathogens. Since their discovery a little over a decade ago4, NETs have been implicated in a wide variety of infectious5,6 and non-infectious7 morbidities. NET formation is an active process and results in the extrusion of chromatin DNA coated with granule-derived antimicrobial proteins8. Some of the key changes in cellular and nuclear morphology associated with NET formation include the loss of nuclear morphology, chromatin decondensation, mobilization of granule proteins from cytoplasm to the nucleus and an increase in the nuclear and cellular diameter8,9.
The web-like NETs, which may appear as diffuse structures slightly larger than the cell or as structures several times larger than a single neutrophil are considered as indicators of NETosis5,10. Using fluorescence microscopy, NETs can be detected by probing DNA with a fluorescent probe such as 4',6-diamidino-2-phenylindole (DAPI) and by immunofluorescence staining against NET-bound proteins such as neutrophil elastase. Quantification of overlapping areas of staining for DNA and NET-bound proteins determines the total area under NETs in an image11.
A number of image analysis options are available to perform fluorescence image-based quantification of NETs11,12. But these software options present limitations in not being user-friendly and/or fully automated. In this article, we demonstrate the operation of NETQUANT13, a freely available app that can perform unbiased fully automated immunofluorescence microscopy image-based NET quantification. The app has a user friendly graphical interface (GUI) and can perform single-cell analysis. The software quantifies NETosis in an image by detecting the morphological changes in the area of DNA-NET-bound marker, chromatin decondensation associated deformation of the nucleus and increase in the DNA:NET-bound protein ratio. Taken together, the multiple NET definition criteria allows for stringent NET quantification across several data sets in an unbiased fashion.
Protocol
The ethics committee of Lund University approved the collection of venous blood from healthy volunteers in accordance with the Declaration of Helsinki (2013/728). All volunteers provided their written informed consent.
1. Isolation of Peripheral Blood Neutrophils using Density-Gradient Centrifugation
- Collect human venous blood in tubes containing heparin and allow the tubes to reach room temperature.
Note: A minimum of 16 mL of blood from a healthy donor is required to yield a sufficiently large cell pellet. - Mix the blood with one volume of 2% dextran in saline (0.9% NaCl) and allow to sediment at room temperature for 30 min in a sterile 50 mL conical centrifuge tube.
- Aspirate the supernatant into a sterile 50 mL conical centrifuge tube and centrifuge at 200 x g for 10 min at 4 °C.
- From this step onwards continue isolation at 4 °C or on ice.
- Resuspend the pellet in 5 mL of ice cold saline and layer on top of 5 mL of leukocyte isolation gradient (9.1% sodium diatrizoate with 5.7% dextran, w/v) in a sterile 15 mL conical centrifuge tube.
- Centrifuge for 30 min at 400 x g at 4 °C.
- Aspirate the supernatant and discard it.
- Lyse red blood cells by resuspending the pellet in 3 mL of ice-cold water for 30 s. Immediately add 1 mL of 3.6% NaCl and then fill up with 10 mL of ice cold saline.
- Centrifuge the cell suspension for 10 min at 350 x g.
- Remove the supernatant, collect the cell pellet and resuspend it in 1 mL of saline. Set aside 10 µL in a microcentrifuge tube for assessment of the cell number and viability using trypan blue in a Bürker chamber.
- Add 10 µL of cell suspension to 90 µL of 0.4% trypan blue solution. Take 10 µL of the cell suspension in a Bürker chamber. Count the cells in the 4 squares bound by 3 lines at each corner of the chamber. Cells that appear dark blue to the uptake of dye are non-viable, exclude them from the total cell number.
- Express the cell number as cells/mL as defined by the equation below.

Note: Here chamber factor was 10,000, dilution factor was 10 and the total number of squares was 4. - Dilute the remaining cell suspension to 10 mL for a final washing step.
- Centrifuge for 5 min at 200 x g.
- Resuspend the neutrophils in RPMI-1640 with 2 mg/mL heat-inactivated human serum albumin (HSA) at a concentration of 5 x 10⁵ cells/mL.
2. Preparation of Coverslips and Stimulation of Neutrophils
- Place one coverslip (10 mm, #1) in each well of a 12-well plate and coat the coverslip by adding 200 µL of 0.01% poly-L-lysine solution and leave it at 37 °C overnight.
- Wash coverslips with 300 µL phosphate buffer saline (PBS) once and leave to dry.
- Add 400 µL of 5 x 10⁵ neutrophils/mL to each well and incubate at room temperature for 15 min.
- Move the plate containing neutrophils to an incubator at 37 °C with 5% CO2 for 15 min.
- Remove the supernatant. Add 400 µL of prewarmed RPMI-1640 medium with 2 mg/mL HSA to controls. Add 300 µL pre-warmed RPMI with 20 nM phorbol 12-myristate 13-acetate (PMA) for stimulation.
- Stimulate neutrophils for 150 min at 37 °C with 5% CO2.
3. Visualization of NETs
- Remove the supernatant and wash the samples 2x with 200 µL of PBS.
- Fix samples by adding 200 µL of 4% paraformaldehyde (PFA) in PBS for 20 min at 37 °C.
Note: PFA is toxic and must be handled with care. - Wash samples 3x with 200 µL of PBS.
- Permeabilize the samples by adding 50 µL of 0.5% Triton X-100 for 30 s.
- Wash the samples 3x with 200 µL of PBS.
- Block the samples with 5% goat serum in PBS for 1 h at 37 °C.
- Add 300 µL of primary rabbit anti-human neutrophil elastase in blocking solution at a dilution of 1:500 for 90 min at 37 °C.
- Wash the samples 3x with 300 µL of PBS.
- Add 300 µL of secondary goat anti-rabbit fluorescent antibody at a dilution of 1:1000 for 90 min at 37 °C.
- Wash the coverslips 3x with 300 µL of PBS.
- Remove the coverslips from the wells and mount the coverslip with 10 µL mounting medium containing DAPI. Store overnight at room temperature in the dark to dry the samples.
Note: The staining of DNA with DAPI is certainly a critical step in the method. The users can also troubleshoot by adding exogenous DAPI solution at a final concentration range of 0.1‒0.5 µg/mL for 2‒3 min, followed by 3 washing steps with 300 µL PBS. - Acquire images with a wide-field fluorescence microscope using a 20X objective.
4. Analysis and Quantification of NETs using NETQUANT
Note: NETQUANT can be downloaded by clicking the installation file found on the Zenodo Github archive or the Nordenfelt Lab website (https://nordlab.med.lu.se/?page_id=34).
- Importing datasets for analysis, naming of channels and conversion of images
- Open the Setup tab in NETQUANT.
- Choose the source folder for analysis by clicking the Get path option in the source menu and select the folder containing the image sequences to be analyzed.
- Click on the Get Path option in the target menu and select the folder for saving the data following the image analysis.
- Name the channels so that “DNA channel” corresponds with the DNA staining (e.g, DNA or DAPI) and “NET-channel” depicts the NET-bound protein staining (e.g, NET, neutrophil elastase) in the images. For the smooth functioning of the software, (recommended) name the folder containing the control image files as “control”.
Note: The NET channel refers to the NET-bound granule protein marker staining only. - Feed the image metadata into the software by clicking the Load image information button on the Image information sub-menu.
- Select the correct channel order contained in the images in the Channel order sub-menu. This option has been included as a fail-safe to prevent accidental mismatches.
- Acquire primary image properties from the raw data and convert the images by clicking the Prepare data button. The converted images appear in the Sample type sub-menu. Click on the Sample type menu for displaying and selecting all datasets acquired for analysis.
- Select an image from the Sample type sub menu and click on the Display image data button to display the images split into the DNA and NET channel respectively.
- Segmentation of Cells in the DNA channel and the NET channel
- Select the segmentation method by clicking on the Method sub menu in both the DNA channel and the NET channel.
Note: The default method of segmentation is set to adaptive and is the recommended setting. Other options are also available including global, edge and Chan-Vese. A watershed option is also included to help distinguish between closely placed cells or NETs. - Enter the Segmentation tab to segment control cells first in both channels by clicking on the Segment control samples option.
- Select PMA from the sample type sub-menu and click on the Batch option (recommended) to begin segmentation of all images included in the data set. Select the images in the sample type menu and click on the Display image data button to visualize and validate the binary image masks (DNA mask and NET mask) generated post-segmentation.
- Select the segmentation method by clicking on the Method sub menu in both the DNA channel and the NET channel.
- Single-cell Analysis of Identifiable Properties
- Enter the analysis tab and analyze the control samples by clicking on the Determine threshold button.
- Change the sample type to PMA and click on the Get cell properties button to complete the analysis of stimulated samples.
- Select an image from the Sample type sub-menu and click on the Display image data button to display the overlay and the number of cells and NET forming cells in the image.
- Comparison of Cell properties to Identify NET-forming Cells
- Select sample from the sample type sub-menu and click on the Analyze NETs button to complete the analysis. Individual images can be selected from the sample type sub-menu for analysis or the entire batch of images can be analyzed by selecting the batch option (recommended).
- Adjust NET criteria manually to yield optimal results for a given sample. Compare identified NETs with the original images to assess the quality of identification.
Note: The NET criteria can then be used across all images in the data set. Any changes in the NET-criteria are applied simultaneously across all control samples. This limits the possibility of any potential differences that may arise due to over-fitting of the NET parameters. The settings in the NET criteria can be adjusted according to the user's requirements. The relationship between false discovery rates and NETQUANT has been explored previously13. Typical ranges for area increase are 2‒4, circularity to be 0.7‒0.9 and the DNA/NET ratio to be 0.6–2.0. - Inspect the data summary in the Cell data sub-menu where the number of images, cell count per image and percentage of NETs per image are displayed.
Note: The total percentage of NETs in the entire dataset is displayed by the “NET-gauge”. The total image count, cell count, percentage of NETs in the sample (NETs%) and NETs% in the control sample are displayed in the summary statistics table below the NET-gauge. We recommend that the control data are reported alongside the data obtained from stimulated samples.
- Result Outputs
- Enter the Output tab to select and view result outputs.
- Explore and compare the various data outputs generated from the analysis of control and PMA by selecting the form of the output and clicking on the Output results button.
Note: All data generated post-analysis for both controls and stimulations is saved in the analysis folder as chosen in the target sub-menu. Data are saved in either .csv or .pdf formats. - Launch the Method file to obtain the version of the software and NET-criteria used for the analysis (to be included in methods section for publication purposes).
- Click on the Results data table to visualize the individual data points in a given sample.
- Visualize the NET area distribution and DNA:NET ratio in the samples. The red line indicates the threshold value in the graphs.
- Determine the NET area versus shape of DNA by clicking on the Bivariate distribution file.
- Loading Previous Analysis and Batch All Steps
- Load previously successful analysis settings into NETQUANT using the Load previous analysis button.
- Use the Batch all steps button included in the Setup menu to run steps 5‒12 (Figure 1, Figure 2, Figure 3, Figure 4, Figure 5) directly to obtain the final output.
Representative Results
5 x 10⁵ neutrophils/mL were seeded onto coverslips placed in a 12-well plate and stimulated with either 20 nM PMA or left unstimulated for 150 min. The samples were then stained using primary rabbit anti-human neutrophil elastase antibodies, secondary goat anti-rabbit fluorophore conjugated antibodies and DAPI – a fluorescently labelled dye that stains DNA (See the Table of Materials for details). A minimum of 5 images were then acquired using an epifluorescence microscope and a 20X (NA = 0.75) objective. Sample data used for the test analysis in the manuscript can be downloaded by following the link https://nordlab.med.lu.se/?page_id=34 and clicking on the sample dataset icon.
Here we describe the ability of the NETQUANT workflow (Figure 1) to quantify NET formation in a given sample. The software tool can be installed as an app in MATLAB and can be used without any previous knowledge of this interface. The GUI of NETQUANT was used to analyze the datasets as described above. All images used for analysis by NETQUANT are always left unaltered in the parent directory. The GUI is divided into 4 tabs — setup tab, segmentation tab, analysis tab and results output tab. The samples were prepared for analysis in the setup tab (Figure 2). The file paths (1), naming conventions (2), image information (3) and channel orders (4) are defined by the user. The prepare data option (5) ensures that the conversion and organization in a standardized fashion throughout the experiment. The segmentation parameters were the set in the segmentation tab (Figure 3) to identify individual cells in the samples (6). The control samples are always segmented first (7) prior to the segmentation of stimulated samples (8). All recommended values for segmentation are indicated in the software tab. The properties that define unstimulated control cells are first acquired (9) and then compared to PMA stimulated cells (10) (Figure 4). NETs are then analyzed in the samples based upon the NET criteria (11) and displayed with total image counts, cell counts and corresponding NETs% in the control samples. The final data outputs from the analysis were selected and then visualized (Figure 5). An option for loading and using a previously successful analysis, and a batch-all option to process groups of steps 5-12 (Figure 1, Figure 2, Figure 3, Figure 4, Figure 5) have also been included in the setup tab.
During the analysis, a total of 2619 cells were analyzed in the experiment. The PMA stimulated neutrophils were able to generate 90.59% NETs (NETs%) in contrast to 25.87 NETs% in the control samples (Figure 6). The image analysis was completed within 10 min of initiating the workflow on the software. In summary, NETQUANT provides a rapid and convenient option to quantify NET formation in images that have been acquired using immunofluorescence microscopy.
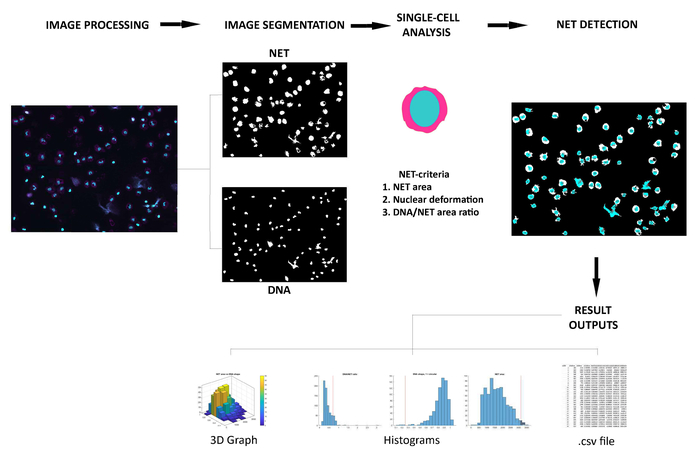
Figure 1: Overview of the NETQUANT workflow. Fluorescent micrographs of human neutrophils double stained with anti-elastase and DAPI (DNA) are first processed and converted. The images are then segmented, followed by analysis of cell properties, detection of NETs and result outputs. Please click here to view a larger version of this figure.

Figure 2: Setup tab options in NETQUANT. File paths for the datasets to be analyzed and data output folders are entered in the setup tab first (1). The naming conventions are then filled in to define channel names and the control folder name (2). The image information is then acquired (3) followed by naming the correct channel order (4). The proper setup of all fields is recommended prior to the processing of the datasets (5) for standardized image conversion. Please click here to view a larger version of this figure.
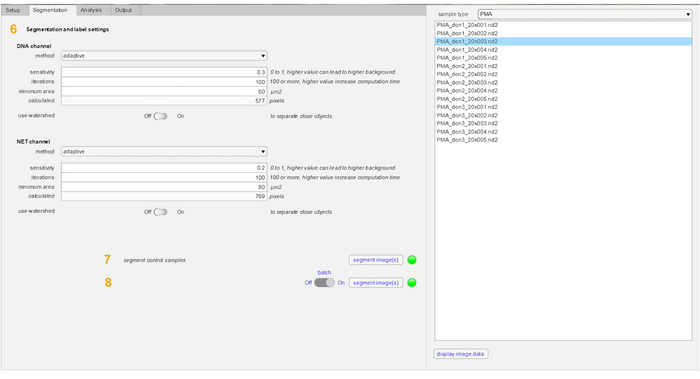
Figure 3: Segmentation tab parameters in NETQUANT. The parameters used for segmentation of both DNA channel and NET-protein marker include method, sensitivity, iterations, minimum area and watershed (6). The use of an adaptive segmentation method and watershed is recommended. Also, other settings provided as presets in the software can be used without modification for most purposes. Control samples are first segmented (7) and then the stimulated samples are segmented (8). Please click here to view a larger version of this figure.
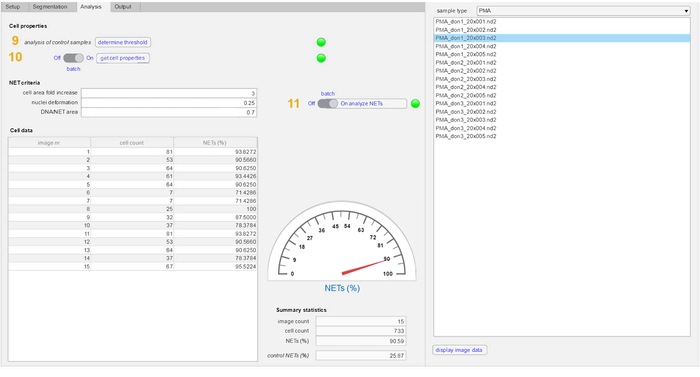
Figure 4: Detection of NETs in the analysis tab. The cell properties defining unstimulated cells are analyzed and acquired from control samples (9). This is followed by the analysis of cell properties in the experimental samples (10). The NET-definition criteria (fold increase in cellular area, nuclear deformation (values 0 to 1) and DNA staining area/NET-marker staining area) are applied to both control and stimulated samples to define NET formation (11). The quantity of NETs, total cell count and number of images in both samples is displayed in the summary statistics section. Please click here to view a larger version of this figure.
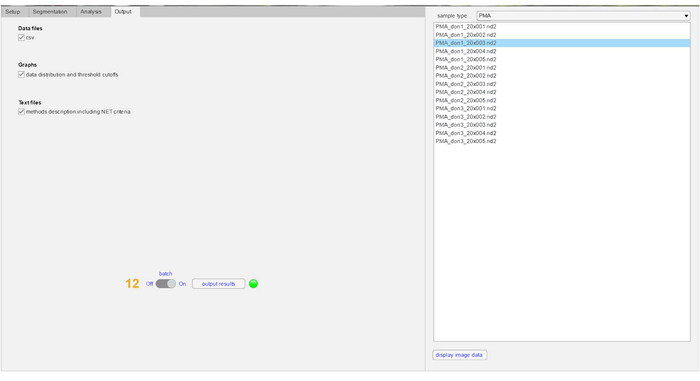
Figure 5: Visualization of result output files in NETQUANT. Results obtained post-analysis can be selected by the individual user. The result outputs that can be generated with NETQUANT includes a .csv file containing data points from individual cells. Also, histograms depicting distribution of cells undergoing increase in NET (cellular) area, deformation of nucleus due to chromatin decondensation and DNA:NET-marker ratio, and a 3D graph of NET area versus nuclear deformation are also generated in the analysis. All outputs are automatically saved in the analysis folder chosen in the setup tab as .csv, .pdf and .txt files. Please click here to view a larger version of this figure.
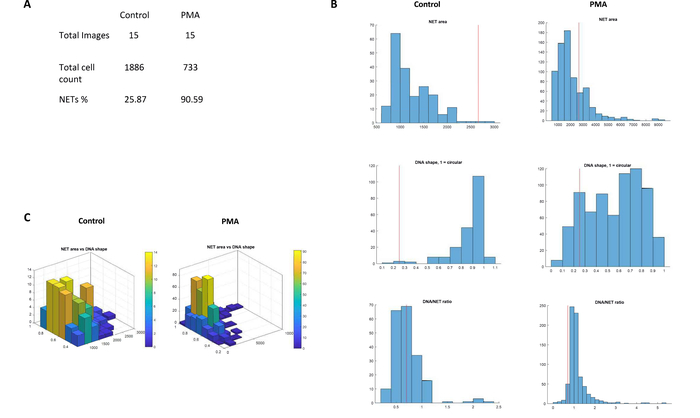
Figure 6: Analysis of NET formation. (A) The NETs%, total cell count and number of images from the test data set as observed in the summary statistics for controls and PMA-stimulated (20 nM) neutrophils. (B) A side-by-side comparison of histograms depicting increase in the area, nuclear deformation (values 0 to 1) and DNA/NET ratio in control and PMA-stimulated samples. The red line in the histograms threshold values for the NET-definition criteria. (C) Comparison of 3D graph of NET area versus nuclear deformation generated by NETQUANT analysis of control and PMA-stimulated samples. Please click here to view a larger version of this figure.
Discussion
NET formation is a relatively recent addition to the diverse neutrophil armamentarium4 and there has been a noticeable surge of interest to study the implication of NETs in a wide array of research areas5,7,14,15. Acquisition of images using Immunofluorescence microscopy and subsequent image-based quantification is a widely used method to quantify NETs. This approach has the advantage of being able to detect cells forming NETs at a single-cell level and can therefore better reduce the background signal. Manual methods of quantification can be exhaustive, slow and subject to user bias. A few semi-automatic options exist that have provided users with reliable analysis11,12. However, they might require significant technical skill for operation or may require several manual steps for quantification. This is challenging especially to previously non-experienced users. In a recent publication, a fully automatic computational method has been used to quantify NET formation using flow cytometry-based imaging as well as thin tissue sections. However, it can only be applied to specific scenarios and also requires a significant knowledge of programming for operation16. Presently, fully automated image quantification software dedicated towards general NET quantification that is easy to use and possesses single-cell resolution capacity is unavailable to researchers.
Here we present NETQUANT, a fully automated NET quantification software that is freely available. This software has been developed specifically to quantify NET formation with high stringency using immunofluorescence microscopy images, and with the ability to perform single-cell analysis and quantification. Apart from considering the increase in the area of staining under NETs, NETQUANT also takes into account nuclear deformation due to chromatin decondensation and an increase in the DNA/NET-marker protein co-localization to define NET formation in a given sample. This allows for distinguishing cells that have only undergone nuclear decondensation from cells that have undergone complete NET formation. The NET definition criteria included in the NETQUANT algorithm allows for higher stringency in quantification in comparison to many earlier quantification approaches that rely solely upon an increase in the area of NET staining.
The GUI is aimed to be user-friendly and simple to use. Each step of the analysis is numbered to ensure that users can follow the workflow. One of the key features provided in the software is the segmentation tool/tab that allows NETQUANT to perform single-cell analysis in images, which is the highest possible sensitivity that can be achieved. This makes NETQUANT one of the few available options that can perform single-cell quantification to quantitate NET formation. In addition, Mohanty et al. have demonstrated that the software can also adapt to image variations and acquisition parameters13. Due to the flexibility offered in the segmentation and NET-definition criteria, donor and plate variations can be accommodated. NETQUANT can handle large data sets adequately and can be used for reliable high-throughput image analysis13.
Although we found the workflow to yield robust results from multiple donors, we recommend that the user should decide on the appropriate values based on the individual samples. In theory, the data generated post-analysis could also be influenced by high cell density. Also, excessive aggregation of NETs can result in the reduction of the number of NETs detected. This is because the segmentation algorithm cannot distinguish entangled NETs into separate events. A similar problem with segmentation may also arise when unstimulated neutrophils are trapped within the NETs. The use of images acquired at 20X and 40X is currently recommended as NETQUANT's performance has not been tested at other magnification levels. Still, as long as the pixel size is set correctly (either manually or from metadata in the load image info section) the software should adapt area calculations accurately to higher or lower magnifications. Proper staining of the DNA and the granule marker is a critical factor. Poor staining or poor image quality in either channel will result in suboptimal results. Therefore, it is recommended that the user should determine a suitable cell number, staining procedure and antibody titer to yield optimal results.
NETQUANT has only been tested on NETs derived from human neutrophils in vitro. NETs from other species can also quantified with proper corrections in the criteria. NET quantification can be performed on fixed samples in chamber slides or multi-well glass bottom plates. High quality images of samples stained for DNA and granule protein markers are critical. NETQUANT can also be adapted to quantify other forms of extracellular traps (ET)-osis, e.g., as exhibited by eosinophils. Quantifying ETs in non-granulocytes such as monocytes is currently not possible as cytoplasmic granule staining area is required for the segmentation algorithm.
In conclusion, NETQUANT is a simple, automatic and rapid tool for accurately identifying NET formation that allows for single-cell analysis and quantification. We believe this software may lower the barrier for performing automatic NET quantification and that the research community will benefit from this freely available app.
Divulgaciones
The authors have nothing to disclose.
Acknowledgements
The work was funded by the Crafoord Foundation (TM and PN), Swedish Government Research grant (PN, TM), Swedish research council (PN) and Groschinsky Foundation (TM, PN).
Materials
| BD Vacutainer Heparinised plastic tubes | BD Biosciences | 367885 | |
| Lymphoprep | Axis-Shield | 114547 | |
| RPMI-1640 with L-Glutamine | Gibco | 11835-030 | |
| 50mL conical flasks | Sarstedt | 62.547.004 | |
| 15mL conical flasks | Sarstedt | 62.554.002 | |
| 12-well Tissue culture plates | Falcon | 10626491 | |
| #1 Coverslips 10mm | Menzel Glaser | CS10100 | |
| Glass slides | Menzel Glaser | 631-0098 | |
| Primary anti-human elastase | DAKO | DAKO rabbit 1373, contract immunization | |
| Secondary fluorophore conjugated goat anti-rabbit | Life technologies | A-11072, A-11070 | |
| PROLONG-Gold Antifade reagent with DAPI | Life technologies | P36930 | Mounting medium |
| Goat serum | Sigma-Aldrich | G9023 | |
| Phorbol 12-myristate 13-acetate (PMA) | Sigma-Aldrich | 79346 | |
| Paraformaldehyde | Sigma-Aldrich | 158127 | |
| Triton X-100 | Sigma-Aldrich | T8787 | |
| Nikon Ti-E Epifluorescence microscope | Nikon | ||
| CCD camera | Andor Zyla | ||
| Plan Apochromat 20x, 40x objectives | Nikon | ||
| Windows 10 | Microsoft | Operating system | |
| macOS Sierra 10.12 | Apple | Operating system | |
| MATLAB | Mathworks |
Referencias
- Nauseef, W. M., Borregaard, N. Neutrophils at work. Nature Immunology. 15 (7), 602-611 (2014).
- Borregaard, N., Cowland, J. B. Granules of the human neutrophilic polymorphonuclear leukocyte. Blood. 89 (10), 3503-3521 (1997).
- Nordenfelt, P., Tapper, H. Phagosome dynamics during phagocytosis by neutrophils. Journal of Leukocyte Biology. 90 (2), 271-284 (2011).
- Brinkmann, V., et al. Neutrophil extracellular traps kill bacteria. Science. 303 (5663), 1532-1535 (2004).
- Sorensen, O. E., Borregaard, N. Neutrophil extracellular traps – the dark side of neutrophils. Journal of Clinical Investigation. 126 (5), 1612-1620 (2016).
- Yipp, B. G., Kubes, P. NETosis: how vital is it?. Blood. 122 (16), 2784-2794 (2013).
- Jorch, S. K., Kubes, P. An emerging role for neutrophil extracellular traps in noninfectious disease. Nature Medicine. 23 (3), 279-287 (2017).
- Fuchs, T. A., et al. Novel cell death program leads to neutrophil extracellular traps. J Cell Biol. 176 (2), 231-241 (2007).
- Mohanty, T., et al. A novel mechanism for NETosis provides antimicrobial defense at the oral mucosa. Blood. 126 (18), 2128-2137 (2015).
- Hakkim, A., et al. Activation of the Raf-MEK-ERK pathway is required for neutrophil extracellular trap formation. Nature Chemical Biology. 7 (2), 75-77 (2011).
- Brinkmann, V., Goosmann, C., Kuhn, L. I., Zychlinsky, A. Automatic quantification of in vitro NET formation. Frontiers in Immunology. 3, 413 (2012).
- Coelho, L. P., et al. Automatic determination of NET (neutrophil extracellular traps) coverage in fluorescent microscopy images. Bioinformatics. 31 (14), 2364-2370 (2015).
- Mohanty, T., Sorensen, O. E., Nordenfelt, P. NETQUANT: Automated Quantification of Neutrophil Extracellular Traps. Frontiers in Immunology. 8, 1999 (2017).
- Kaplan, M. J., Radic, M. Neutrophil extracellular traps: double-edged swords of innate immunity. Journal of Immunology. 189 (6), 2689-2695 (2012).
- Cedervall, J., Olsson, A. K. Immunity Gone Astray – NETs in Cancer. Trends in Cancer. 2 (11), 633-634 (2016).
- Ginley, B. G., et al. Computational detection and quantification of human and mouse neutrophil extracellular traps in flow cytometry and confocal microscopy. Scientific Reports. 7 (1), 17755 (2017).

