Determining Tribocorrosion Rate and Wear-Corrosion Synergy of Bulk and Thin Film Aluminum Alloys
Summary
Here, we present a protocol to measure the tribocorrosion rate and wear-corrosion synergy of thin film and bulk Al alloys in simulated sea water at room temperature.
Abstract
The increasing complexity and severity of service conditions in areas, such as aerospace and marine industries, nuclear systems, microelectronics, batteries, and biomedical devices, etc., impose great challenges on the reliable performance of alloys exposed to extreme conditions where mechanical and electrochemical attack co-exist. Finding ways for alloys to mitigate the combined attack of wear and corrosion (i.e., tribocorrosion) under such extreme conditions is thus highly critical for improving their reliability and service lifetime when used in such conditions. The challenge lies in the fact that wear and corrosion are not independent of each other, but rather work synergistically to accelerate the total material loss. Thus, a reliable method to evaluate the tribocorrosion resistance of metals and alloys is needed. Here, a protocol for measuring the tribocorrosion rate and wear-corrosion synergy of Al-based bulk and thin film samples in a corrosive environment under room temperature is presented.
Introduction
Tribocorrosion is a material degradation process caused by the combined effect of wear and corrosion1,2. Tribocorrosion takes place both in nature and in industrial applications where mechanical contact and a corrosive environment are simultaneously present. The complexity of tribocorrosion lies in the fact that chemical and mechanical degradation mechanisms are not independent of each other. A combination of mechanical and chemical attack often leads to accelerated failure, due to synergetic effects. Thus, the total material loss can be calculated as T = C0 + W0 + S (eqn. 1), where C0 is the material loss resulted from corrosion in the absence of wear, W0 is the material loss due to mechanical wear in the absence of corrosion, and S is the material loss due to wear-corrosion synergy3,4. The synergetic effect is prominent for passive alloys such as aluminum, titanium, and stainless steels, which spontaneously form a protective thin (a few nanometer in thickness) oxide film (passive film) when in contact with oxygen or water5,6. During corrosion, and if this passive film is locally disturbed by mechanical wear, depassivation could lead to localized corrosion and unexpected failures1,3,7,8,9.
As an example of the economic impact of tribocorrosion in our society, wear and corrosion are estimated to cost nearly $300 billion per year in the United States10. In Florida, tribocorrosion phenomena of structural alloys in seawater is of interest given its ocean economy (fishing, marine transportation, and coastal construction), which contributes around 4% of Florida's total Gross Domestic Product11. Thus, a better understanding of tribocorrosion of metals and alloys will lead to better guidelines for application and usage of alloys in harsh environment service conditions. Such understanding will also serve to improve design principles for manufacturing new alloys and coatings against tribocorrosion and enhancing durability.
Tribocorrosion studies require integration of a tribometer and an electrochemical measurement system. The tribometer provides controlled mechanical loading and relative motion, and measures the friction force and sample surface height change. The electrochemical measurement system includes a potentiostat/galvanostat with a zero-resistance ammeter (optional) that determines open-circuit potential (OCP) and electrochemical polarization measurements. Such techniques provide a quick and inexpensive method to obtain the electrochemical properties of a material, where the corrosion rate of a metal can be measured by observing the response of the charge-transfer process to a controlled electrochemical disturbance. Here, we present a testing protocol for determining the tribocorrosion rate and wear-corrosion synergy of Al alloys, mostly following the ASTM standard G1192. This protocol includes sample preparation, machine setup, tribocorrosion testing, and post-testing calculation procedures. We hope this effort will benefit those new to the field to perform reliable and repeatable tribocorrosion tests to evaluate the deformation and degradation behavior of bulk as well as thin film metallic samples.
Protocol
CAUTION: Please consult all relevant materials safety data sheets (MSDS) before use. Some chemicals used in the protocol are toxic. Please use all appropriate safety practices when performing experiments, including the use of engineering controls (fume hood) and personal protective equipment (safety glasses, gloves, lab coat, full-length pants, and closed-toe shoes). The CNC (Computer Numerical Control) machine must be operated by trained personnel. Hydrofluoric acid must be handled inside a fume hood that is identified with a sign stating "Danger, Hydrofluoric Acid Used in this Area" or similar.
1. Sample Preparation
NOTE: Proper surface preparation of samples prior to tribocorrosion tests is critical to ensure good reliability of the performed test and enhance test repeatability. In this protocol, a commercial Al 3003 alloy (Si: 0.1, Fe: 0.4, Cu: 0.08, Mn: 1.1 wt.%, balance Al) is used as an example.
- Bulk metallic sample preparation
- Cut as-received Al 3003 alloys (hereafter referred as Al) into several 1.5 × 2 cm2 coupons using a CNC machine.
- Mechanically grind one side of the sample surface using sandpaper with increasing grit numbers (#180, 240, 400, 600, and 1200).
- Grind the sample using #180 sandpaper for 30 s along one arbitrary direction.
- Rotate the sample 90˚ and grind it using #240 sandpaper until the scratch lines from the previous step are completely eliminated. Use an optical microscope to aid this inspection.
- Repeat the sample rotation procedure and move to the next grinding paper. Use a soft brush between steps to clean the sample surface in running water to eliminate any contamination from the previous step.
- After grinding, polish the sample surface using different sizes of high viscosity alumina polishing suspension (1 µm, 0.3 µm, and 0.05 µm) on microfiber cloth pads. Use a different cloth pad for each compound size.
- Pour ~ 1 oz of 1 µm alumina suspension (10-30% alumina, 0.6-1% silica glass, 70-90% water) on a clean cloth pad. Polish the sample in one direction or draw a shape of '8' (avoid drawing a shape of '0') until removing the scratch lines from the previous step.
- Repeat for 0.3 and 0.05 µm polishing suspension (10-30% alumina, 0.6-1% silica glass, 70-90% water) until reaching a mirror finish.
- Place the polished specimen in a beaker with 40 mL of deionized (DI) water and place the beaker in an ultrasonic cleaner for 1-2 min to remove any surface particle. Use compressed gas to completely dry the surface. Figure 1a shows an example of an unpolished vs. a polished Al sample.
- Cut a 5 cm long, ~ 1-2 mm diameter electrical wire and strip away the protective plastic cover (~ 1 cm in length) on both ends to expose the interior Cu wire to air.
- Electrically connect one end of the wire to the back (the unpolished side) of the sample using a conductive tape or conductive epoxy. If using conductive epoxy, follow the manufacturer's recommendation until complete cure.
- Use electrochemical stop-off lacquer to paint a ~ 1×1 cm2 window on the polished side and the complete back side of the sample. For the back side, paint over the exposed Cu wire.
- Dry the painted sample completely in a well-ventilated fume hood for at least 24 h before the experiments. Figure 1b shows an example of the painted bulk sample, which is used as working electrode for the corrosion and tribocorrosion tests.
- Thin film sample preparation
NOTE: Metallic thin films deposited on a flat substrate such as glass, Si wafer, and other metal plate using non-equilibrium processing techniques such as physical vapor deposition and electrodeposition can be used for tribocorrosion testing after proper preparation. Here a magnetron-sputtered Al-Mn thin film sample deposited on Si substrate is used as an example to explain the critical steps.- Polish a Si wafer (100 mm diameter) with 1:50 hydrofluoric acid water solution for 2 min to remove any surface oxidation layer.
- Clean the Si wafer with 95% ethanol. Then dry it with compressed air and transfer it directly into a magnetron sputtering machine vacuum chamber.
- Operate the sputtering machine at 80 W input power under a 5 mTorr argon atmosphere (99.99%)1. Grow a ~ 2-3 µm thickness Al-20 at % Mn film (hereafter referred as Al thin film) using an Al-Mn target in the sputtering machine.
- Spin coat a thin protective layer of a positive photoresist (~ 10 mL for a 100 mL Si wafer) on the deposited side of Si wafer and dice it into several 1.5 × 2 cm2 coupons.
- Immerse the diced sample in acetone for 1 min to completely remove the protective layer. Rinse it by alcohol and finally dry it by compressed air.
- Follow steps 1.1.5 and 1.1.8 to make an electrical connection and paint the sample surface for tribocorrosion test. Figure 1c shows an example of a painted thin film sample.
2. Tribocorrosion Test
- Tribocorrosion machine setup
- Perform a tribocorrosion test using a custom-designed corrosion cell installed on a universal mechanical tester (UMT) as shown in Figure 2a. Use the schematic of the tribocorrosion testing setup as shown in Figure 2b. Figure 3 shows the custom-designed corrosion cell installed on the UMT rotary stage. The force sensing resolution is 50 µN and 50 mN for load ranges of 5-500 mN and 10-1000 N, respectively.
- For the electrochemical measurement, use 2 x 10-17 Amp current resolution and 1014 Ω input impedance.
- Tribocorrosion rate measurement principle
- Measure tribocorrosion resistance according to the ASTM G119 standard2, where the total material loss T = C0 + W0 + S (see introduction for details).
- Measure the corrosion rate C0 from the potentiodynamic test.
- Measure the pure wear rate W0 during cathodic polarization from tribocorrosion test. Apply a ball-on-disc configuration using an alumina ball to impose reciprocal mechanical wear in the load range of mN to a few N.
- For the thin film sample, choose a proper normal load. This ensures that the plastic deformation is confined within the top surface so that the deposited sample thickness is large enough to resemble true bulk material behavior. Such estimation can be made by using Hertzian contact theory12.
- Measure the tribocorrosion rate T from tribocorrosion test at OCP.
- Calculate the synergy S from the above measurements and equation 1.
- Measure tribocorrosion resistance according to the ASTM G119 standard2, where the total material loss T = C0 + W0 + S (see introduction for details).
- Measurement of corrosion rate C0 from potentiodynamic (PD) test
- Prepare the working electrode (i.e., bulk or thin film metal specimen under analysis). Clean the surface of the metal with acetone, followed by 95% ethanol.
- Clean the corrosion cell before every corrosion run. Scrub the cell with household detergent and rinse thoroughly with tap water. Repeat this step 3 times.
- Rinse the corrosion cell 3 times with de-ionized water (DI) water to remove potential contaminants found in tap water.
- Pour 100 mL of 95% ethanol into the corrosion cell and swirl around to contact all internal surfaces. Pour out the ethanol and repeat this step 3 times.
- Leave the corrosion cell under a fume-hood for 30 min to allow all ethanol to completely evaporate.
- Take the clean, dry corrosion cell and rinse it with the electrolyte that will be used for the corrosion run. For each rinse, fill the corrosion cell with 40 mL of the electrolyte and repeat this procedure 3 times. For this protocol, rinse the corrosion cell with 3.5 wt% (0.6 M), pH ≈ 7 sodium chloride aqueous solution (i.e., simulated sea water).
- Following the rinse, fill the corrosion cell with 40 mL of electrolyte ready for the reaction.
- Setup the three-electrode configuration. Use the Al sample, a standard Ag/AgCl, and an activated titanium mesh as the working, reference, and counter electrode respectively.
- Place the working electrode centrally at the bottom of the corrosion cell and glue the bottom using super glue. Place the exposed Cu wire tip above the expected electrolyte surface height.
- Place the reference electrode ~ 1 cm above the working electrode.
- Loosely bend the counter electrode to wrap around the specimen under test (working electrode). The distance between the counter and working electrode is ~ 2-4 cm.
- Connect electrodes with the potentiostat. Ensure that the electrodes are not touching.
- Open the electrochemical software package, which interfaces with the USB controlled potentiostat. Turn the potentiostat on.
- Open and use the Measurement View to view the potential and current readings of corrosion environment. During the OCP phase where no ramp potential is yet applied the current reading between the working (positive potential) and counter (negative) electrode is around 0 ± 0.01 µA.
- Leave the sample to equilibrate and stabilize at OCP within the corrosion cell environment. The time duration for this varies (1 to 6 h) and is dependent on the material tested. Monitor the potential using measurement view to determine if a stabilized condition (i.e., a potential change of less than 50 mV over more than half an hour) is reached.
- Run the corrosion test. Following the stabilization of the corrosion potential (Ecorr), ramp the applied potential in the positive direction relative to the reference electrode.
- Select the cyclic voltammetry potentiostat procedure within the setup view from the procedure tab. Enable the following parameters to be sampled for the corrosion run: time, working electrode (WE) potential, and current for the corrosion run.
- Select the option to automate the current range. Set the highest current in the range to be 10 mA, and the lowest current in the range to be 10 nA for the WE.
- Ensure that the final cut-off selection is controlled through the potential by setting the 'cycle back' parameter to 0.8 mV to allow the hysteresis loop to complete.
- Record OCP from the measurement view into the OCP parameter text box. Set the start potential at 100 mV below the recorded OCP value. Set the upper vertex potential to 800 mV, the lower vertex to 100 mV below the start potential and the stop potential to 100 mV below the lower vertex potential. Set the scan rate to 0.167 mV/s (ASTM standard).
- Press start. After a few hours, the corrosion test is finished.
- View the results in the software.
NOTE: Optical microscopy will be performed after each test. Discard samples showing any indication of crevice corrosion under the stop-off lacquer. The results for each test condition should be repeated at least three times. Figure 4 shows representative results of bulk and thin film Al after PD tests in 3.5 wt.% NaCl aqueous solution at pH ≈ 7. - Determine the pitting potential (Epit) from the PD test as the potential at which a rapid increase in corrosion current took place (Figure 4).
- Obtain a nominal value of the cathodic polarization slope (βc) by fitting a straight line to the portion of the polarization curve that corresponds to potentials more than 50 mV lower than Eoc.
- Obtain a nominal value of the anodic polarization slope (βa) likewise using the portion of the curve that started at potentials > 50 mV higher than Eoc and ended at Epit.
- Extrapolate both of those trends to Eoc and suitable average of both to obtain a nominal corrosion current density (icorr) (Figure 4).
- Calculate corrosion rate C0 from the corrosion current icorr using Faraday's conversion (1 µA.cm-2≈ 10.9 µm/y) assuming uniform corrosion with the formation of Al3+. The Faraday's equation is R = M/nFP(icorr), where R is the corrosion rate, icorr is the corrosion current measured from the PD test, M is the atomic weight of the metal, P is the density, n is the charge number that indicates the number of electrons exchanged within dissolution reaction, and F is Faraday's constant equivalent to 96,485 C/mol. M/n is the equivalent weight.
- Measurement of wear rate W0 from cathodic protection test
NOTE: To measure the wear rate, an alumina ball with 4 mm diameter is used as the counter body to scratch on the sample surface while the sample is immersed in the solution, as shown in Figure 5. Below is the procedure of cathodic protection test.- Perform steps from 2.3.1 to 2.3.13 in section 2.3.
- Move the indenter probe down towards the surface of the sample as closer as possible (1 mm distance away from sample surface). Ensure the indenter stays near the center of the sample and there is no electrical contact between the electrodes, the probe, and the sample surface.
- Move the indenter up forward for 200 mm. Pour the 3.5 wt.% NaCl aqueous solution into the corrosion cell until all electrode, probe and sample surface are immersed.
- Move the indenter probe down towards the sample surface as close as possible. Connect the electrodes with the potentiostat.
- Open the electrochemical software package, which interfaces with the USB controlled potentiostat. Turn on the potentiostat.
- Select Experiment to view DC Corrosion and choose Potentiostatic mode.
- Apply a cathodic potential of 350 mV below OCP. This cathodic potential (350 mV below OCP) is chosen to avoid hydrogen evolution reaction during sliding, which might lead to embrittlement of the samples13. The initial potential and final potential is -350 mV vs Eoc. The total experimental time is 1,800 s including 300 s of scratching time.
- Set up the wear test from the UMT software by applying 1 Hz scratch frequency, 5 mm scratch length, and 0.5 N normal load. Press the Run button in the wear system to start the tribocorrosion. Note, the scratch frequency, scratch length, and applied load are testing parameters that can be varied based on the purpose of experiment.
- After 1,800 s, the test finished. View the results in the UMT software. For reliable testing, repeat the tests under the same condition for at least three times.
- Use a surface profilometer to measure the depth of wear track from at least three different locations along the wear track for each sample. The scan direction is vertical to the scratch line and the scan length is larger than the width of wear track (see Figure 6). The radius of the profilometer stylus is 5 µm, the stylus force is 3 mg, and the scan resolution is 0.028 µm/sample.
- Export the profile measurement data. Use software to directly integrate the depth below the unworn surface (shaded area in Figure 7).
- Calculate the cross-sectional wear area as
 , where h (x) is the surface height as a function of position x, and a is the wear track width. Using A, calculate the wear volume as
  (A is the cross-sectional wear area, L is the wear track length = 5 mm).
 - Finally, calculate the wear rate W0 as W0=V/Ltot, where Ltot is the total sliding distance.
- Measurement of tribocorrosion rate T from tribocorrosion test at OCP
- Following steps 2.4.1-2.4.8 except in step 2.4.6, set the applied potential during the test as the OCP.
- Once the test is finished, follow step 2.4.10 to calculate T, where T=V/Ltot.
- Calculation of wear-corrosion synergy S
- After performing all previous steps, calculate the wear-corrosion synergy as S=T-W0-C0, where T is the total material loss measured at OCP, W0 is the material loss measured at the cathodic potential primarily due to mechanical wear (where corrosion becomes negligible compared to wear), and C0 is the material loss due to pure corrosion estimated from PD tests14,15. Note, if C0 is measured in terms of depth loss/year from the PD test, it is important to convert it to an equivalent volume loss per time for correct calculation of S.
Representative Results
Following the testing protocol described above, the tribocorrosion rate (T) is measured at various potentials. Figure 8 represents the material loss obtained for the Al thin film sample after tribocorrosion at the cathodic (350 mV below OCP), open circuit, and anodic (200 mV above OCP) potential. The test was performed in 3.5 wt.% NaCl aqueous solution for 5 min under 0.5 N normal load, at a 1 Hz sliding frequency and 5 mm stroke length. Prior to each test, the OCP was stabilized for 20 min. Figure 9 shows the summary of all components of eqn. 1, including the tribocorrosion rate (T), wear rate (W0), corrosion rate (C0), and wear-corrosion synergy (S) of Al thin film.
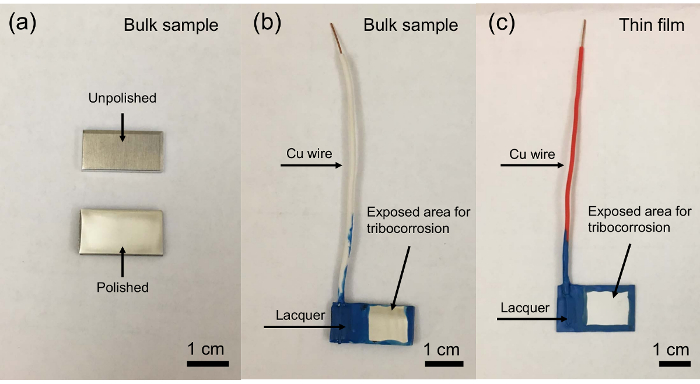
Figure 1. Photo of (a) unpolished and polished Al bulk sample, (b) wired and painted bulk, and (c) thin film Al sample for tribocorrosion testing. Please click here to view a larger version of this figure.
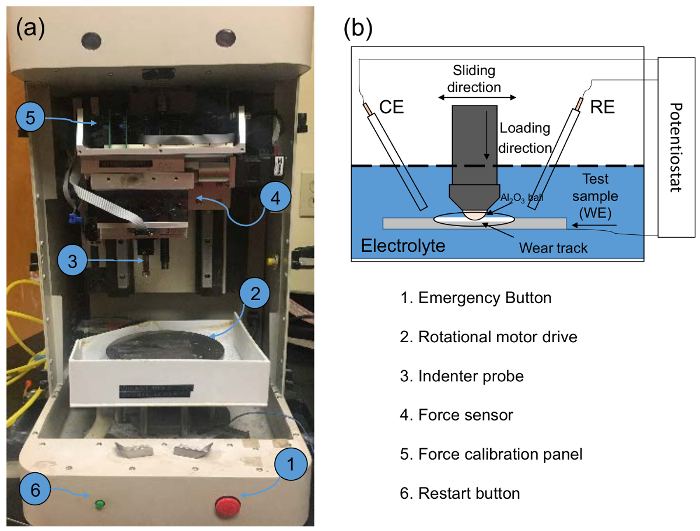
Figure 2. (a) Photo of the front of the Bruker UMT machine without custom-made tribocorrosion cell. (b) schematic of tribocorrosion testing setup. Please click here to view a larger version of this figure.
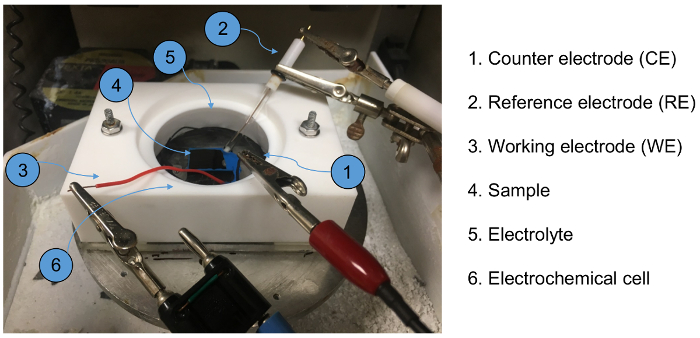
Figure 3. Photo of custom-made tribocorrosion cell installed on the UMT rotary stage. The cell is made from Teflon with an O-ring at the bottom surface to prevent liquid leakage during tribocorrosion test. Please click here to view a larger version of this figure.
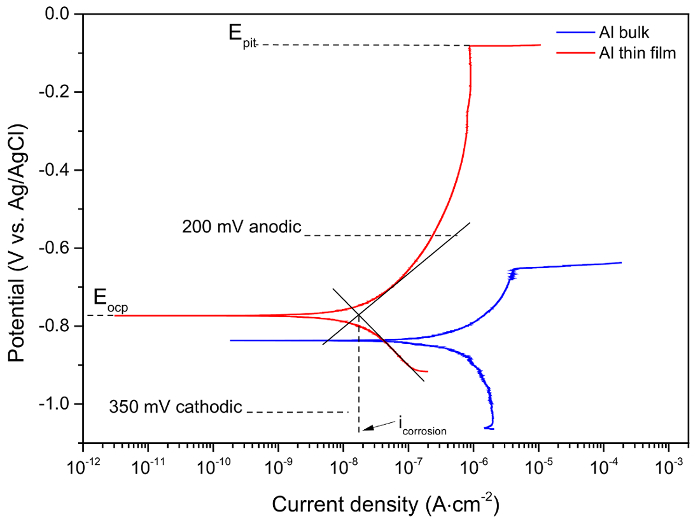
Figure 4. Representative potentiodynamic polarization curves of Al bulk and thin film after 1 hour immersion in 0.6 M NaCl solution. Please click here to view a larger version of this figure.
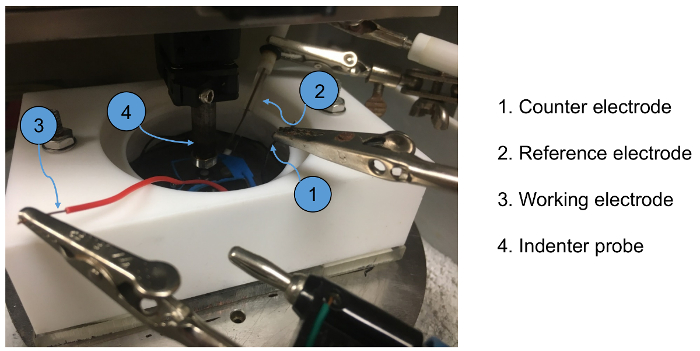
Figure 5. Photo of tribocorrosion machine during testing where the indentor probe is moving on the sample surface in reciprocal motion. Please click here to view a larger version of this figure.
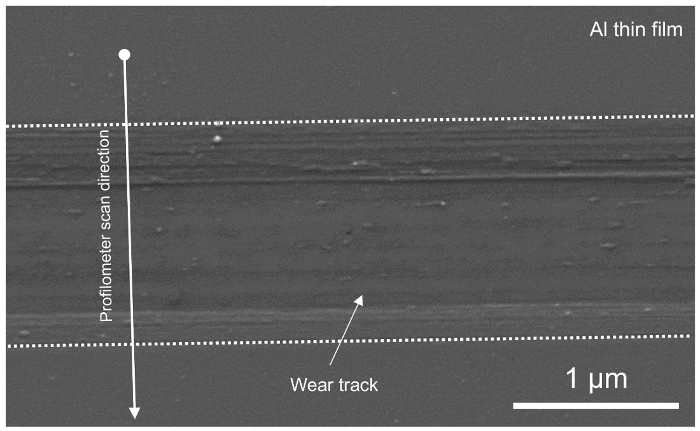
Figure 6. Scanning electron microscopy image of the wear track after tribocorrosion test. The dashed lines represent the boundaries of the wear track. Please click here to view a larger version of this figure.
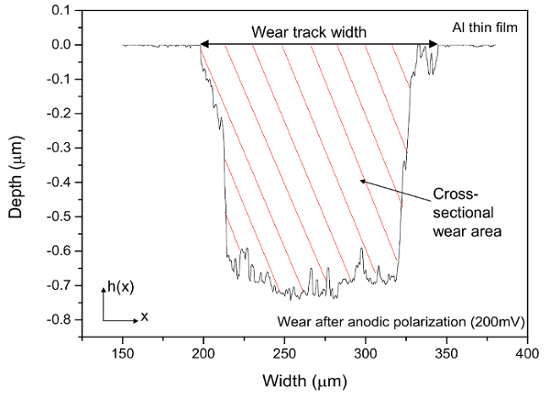
Figure 7. Typical wear track profile of Al thin film after tribocorrosion test obtained by profilometer. Please click here to view a larger version of this figure.
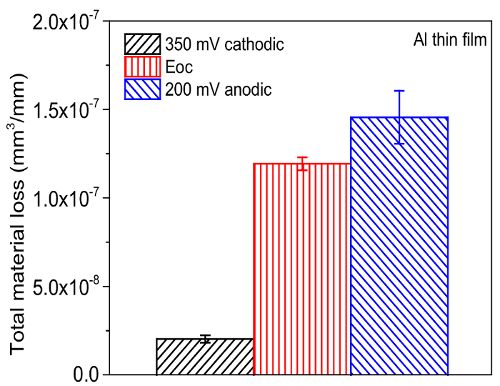
Figure 8. Summary of tribocorrosion rate (T) of Al thin films at different applied potential. The arrow bar represents one standard deviation from all repeated test results. Please click here to view a larger version of this figure.
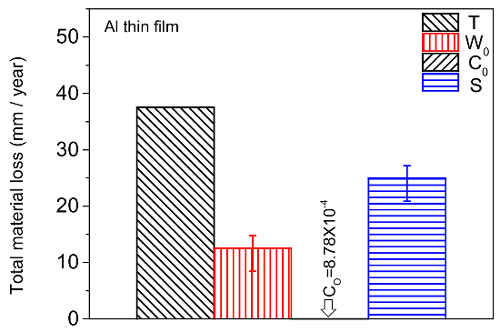
Figure 9. Summary of tribocorrosion rate (T), wear rate (W0), corrosion rate (C0), and wear-corrosion synergy (S) of Al thin films. The arrow bar represents one standard deviation from all repeated test results. Please click here to view a larger version of this figure.
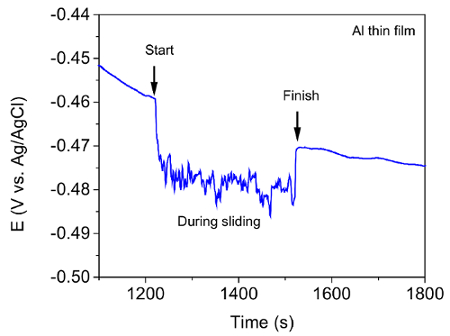
Figure 10. Evolution of corrosion potential during tribocorrosion test of Al thin film at OCP. Please click here to view a larger version of this figure.
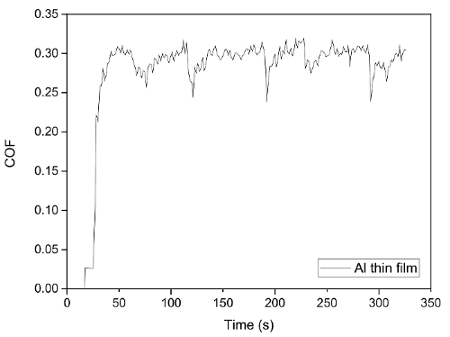
Figure 11. Evolution of coefficient of friction (COF) during tribocorrosion test of Al thin film at OCP. Please click here to view a larger version of this figure.
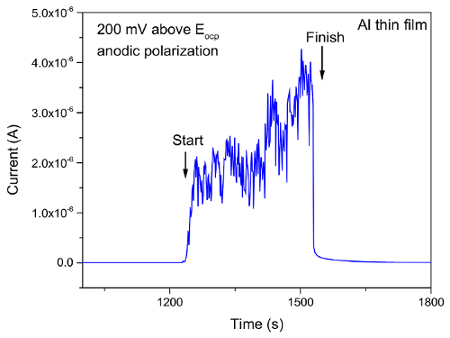
Figure 12. Evolution of corrosion current during tribocorrosion test of Al thin film at 200 mV above OCP. Please click here to view a larger version of this figure.
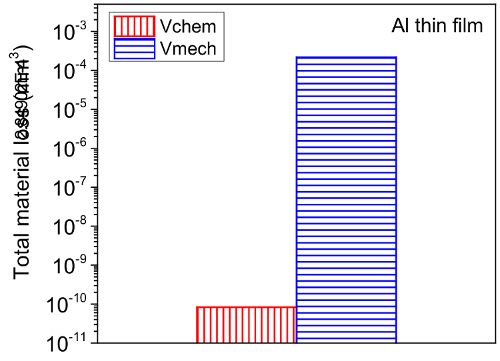
Figure 13. Summary of mechanical and chemical wear of Al thin film during tribocorrosion test at 200 mV above OCP. Please click here to view a larger version of this figure.
Discussion
There are several critical steps within this protocol. First, proper surface preparation of the samples prior to the tribocorrosion tests is critical to ensure good reliability of the performed test and enhance test repeatability. Different bulk alloys are to be prepared following different procedures to ensure a controlled surface roughness, and removal of any surface contaminants or scales. The procedure described here consists of solely mechanical grinding and polishing. This method generally applies to alloys with medium to high hardness such as Al, Ti, Ni, Cu alloys and steel. For softer alloys such as Mg alloys, electrochemical polishing or ion milling should be coupled with mechanical polishing to achieve the desired surface roughness. Secondly, for thin film sample sputtering, maintaining an ultra-low (< 10-6 Torr) vacuum in the sputtering chamber is critical to ensure low defect concentration in the deposited film, which would otherwise affect the corrosion resistance significantly. Thirdly, when preparing either bulk or thin film samples into the working electrode, it is important to ensure a good electrical connection between the sample and the connecting (Cu) wire. In this protocol, conductive tape or conductive epoxy is used. Alternatively, soldering, spot welding or similar techniques may be used. However, the effect of heating during welding on the microstructure and eventually the tribocorrosion resistance of samples have to be evaluated carefully. This is especially important for metals and alloys with low melting point. Finally, since tribocorrosion involves a three-body interaction (including the two bodies in contact, and the third body in between), it is important to ensure that a new ball tip (or a new area of the ball tip) is used when performing repeated tribocorrosion test.
The current protocol evaluates tribocorrosion rate by measuring material loss. Modifications of this protocol can be easily made to evaluate the depassivation and repassivation kinetics of tribocorrosion. This is achieved by tracking the current, potential, and coefficient of friction (COF) evolution during the test. As an example, Figure 10 and 11 show representative results of the evolution of corrosion potential and COF respectively, of Al thin film after tribocorrosion test at OCP. The arrows in Figure 10 represent the start and finish of scratching. It can be seen that for passive alloys such as Al, the mechanical disruption during tribocorrosion leads to local breakdown/removal of the passive film on the wear track and exposing a depassivated area which leads to a decrease in the corrosion potential by ~ 20 mV. Our earlier work16 showed that the magnitude of corrosion potential reduction is strongly related to the microstructure of the metal given the testing parameters (e.g., applied load, sliding speed, temperature) are the same. For Al with higher hardness and finer microstructure, the same applied load may lead to a smaller depassivated area, hence smaller change in corrosion potential. It is also noted that during the open circuit mode, the current is too low to be detected as the circuit is 'open'. However, current evolution during tribocorrosion test at imposed cathodic or anodic potentials can be monitored. An example can be found in our previous work16. Figure 12 shows the current evolution of Al thin film during tribocorrosion at an imposed anodic potential of 200 mV more positive than OCP. This anodic potential was selected within the passive region yet well below the pitting potentials. This result can be used to quantify the wear accelerated corrosion. In this case, the total material loss can be evaluated as T = Vmech + Vchem, where Vmech and Vchem corresponds to the contribution of mechanical and electrochemical material loss, respectively. Specifically, Vchem can be regarded as resulting from metal oxidation under anodic applied potential. Thus it can be calculated by Faraday's law as 17,18,19  , where Q is the electrical charge (calculated by multiplying the difference between the average anodic current during and before sliding by the time), M is the molecular weight, n is the oxidation valence, F is Faraday's constant, and ρ is the density of Al. Figure 13 shows the typical result of both terms for Al thin films. From the above discussion, it can be seen that an evaluation of the electrochemical parameters change, in addition to the weight loss, will thus offer critical insight to the depassivation kinetics during tribocorrosion.
The protocol presented here also bears several limitations. First, the corrosion cell is made from Teflon (polytetrafluoroethylene) or similar material. Thus, all tests were performed near room temperature. For applications that require higher temperature (e.g., above 400 °C for nuclear reactor cores), a special corrosion cell and tip have to be manufactured that will withstand high temperature creep and corrosion. Additional safety is also needed for handling molten salt electrolyte and metallic samples at high temperatures. Secondly, the attachment of a reference electrode near the working electrode (sample) has limited the wear motion to be linear reciprocal. In applications where a rotational motion of the sample is required, a special tribocorrosion setup has to be designed. Thirdly, in the present setup, the wear scratch rate is much faster than the corrosion rate. Hence the contribution of C0 is negligible compared to all other terms. While corrosion itself did not lead to significant material loss during the limited testing time, its effect on S is significant. In real world applications where mechanical scratch occurs at much lower frequencies, this trend might change where C0 may become dominant. Finally, special care has to be paid to errors generated during testing. This is especially important for evaluating the wear-corrosion synergy (S), which is derived from tribocorrosion rate (T), wear rate (W0), and corrosion rate (C0). Thus errors can be accumulated. To minimize errors generated in T and W0, a non-contact 3D optical profilometer (instead of the contact 2D profilometer) can used to determine the total material loss volume. To minimize error in C0, PD tests can be coupled with non-destructive EIS (electrochemical impedance spectroscopy) test to evaluate corrosion rate20.
As a final note, tribocorrosion rate is not a material property, but rather a system's response that depends on the testing parameters (applied load, sliding speed, etc.), the environment (temperature, pH, salt concentration, etc.), and material properties (hardness, surface roughness, etc.). The protocol presented here is demonstrated using only one set of condition. The readers should consider the differences and adopt appropriate changes in sample preparation, testing setup, and data analysis when dealing with different systems. Alternative testing setup including pin on plate (reciprocating), microabrasion, cylinder on bar, et al. can be found in 21. Tribocorrosion is an emerging interdisciplinary subject. It is hoped that this protocol will facilitate both the evaluation of existing engineering materials as well as the design of new materials resistant to both wear damage and corrosion degradation. Such materials become increasingly demanded in future applications such as advanced implantable medical devices, next generation nuclear power plants, and high capacity fast charging batteries, etc., which all require not only a strong and tough material, but one that is robust and reliable when interacting with some very extreme environment.
Divulgaciones
The authors have nothing to disclose.
Acknowledgements
This work was supported by the US National Science Foundation Grant DMR-1455108 and CMMI-1663098.
Materials
| UMT (universal mechanical testing) machine | Bruker | UMT-2 | |
| Potentiostat | Gamry | Reference 600 | |
| Surface profilometer | Veeco | Dektak150 | |
| Al3003 | Metal supermarkets | 3003 | |
| Sodium choloride | Fisher Scientific | S640-3 | |
| DI water | USF NREC | ||
| Alcohol | Fisher Chemical | A405P-4 | |
| Grinding paper | LECO Corporation | 810-221-300 (#180) 810-223-300 (#240) 810-227-300 (#400) 810-229-300 (#600) 810-036-100 (#1200) |
|
| Polishing Pad | Pace Technologies | NP. 7008 | |
| Polishing suspension | Pace Technologies | NANO2-1010-06 (1 um) NANO2-1003-06 (0.3 um) NANO2-1005-06 (0.05 um) |
|
| Stop-off lacquer | Romanoff | 210-1250 | |
| Ag/AgCl Reference electrode | SYC Technologies, Inc. | CHI111 | |
| Compressed air | Office depot | 911-245 | |
| Ultrasonic cleaner | Cole Parmer | 8890 | |
| Sputtering coater | Torr International | CRC-100 |
Referencias
- Landolt, D., Mischler, S. Tribocorrosion of passive metals and coatings. Woodhead Publishing Series in Metals and Surface Engineering: EPFL, Switzerland. 47, (2011).
- ASTM Standard. . G119-09, Standard Guide for Determining Synergism Between Wear and Corrosion. , (2016).
- Mischler, S., Blau, P. J., Celis, J. P., Drees, D. i. r. k. Sliding Tribo-Corrosion of Passive Metals: Mechanisms and Modeling. Tribo-Corrosion: Research, Testing, and Applications. , 1-18 (2013).
- Landolt, D., Mischler, S., Stemp, M. Electrochemical methods in tribocorrosion: a critical appraisal. Electrochim Acta. 46 (24-25), 3913-3929 (2001).
- Macdonald, D. D. Passivity – the key to our metals-based civilization. Pure and Applied Chemistry. 71 (6), 951-978 (1999).
- Obadele, B. A., Andrews, A., Olubambi, P. A., Mathew, M. T., Pityana, S. Tribocorrosion behaviour of laser cladded biomedical grade titanium alloy. Materials and Corrosion. 66 (10), 1133-1139 (2015).
- Wolf, D., Yamakov, V., Phillpot, S. R., Mukherjee, A., Gleiter, H. Deformation of nanocrystalline materials by molecular-dynamics simulation: relationship to experiments?. Acta Materialia. 53 (1), 1-40 (2005).
- Rupert, T. J., Schuh, C. A. Sliding wear of nanocrystalline Ni-W: Structural evolution and the apparent breakdown of Archard scaling. Acta Materialia. 58 (12), 4137-4148 (2010).
- Pokhmurs’kyi, V. I., Dovhunyk, V. M. Tribocorrosion of Stainless Steels (Review). Journal of Materials Science. 46 (1), 87-96 (2010).
- Davis, J. R. Surface Engineering for Corrosion and Wear Resistance. ASM International. , (2001).
- Song, D., Ma, A. B., Jiang, J. H., Lin, P. H., Yang, D. H., Fan, J. F. Corrosion behavior of equal-channel-angular-pressed pure magnesium in NaCl aqueous solution. Corrosion Science. 52 (2), 481-490 (2010).
- Johnson, K. L. . Contact mechanics. , (1987).
- Mischler, S. Triboelectrochemical techniques and interpretation methods in tribocorrosion: A comparative evaluation. Tribology International 41. (7), 573-583 (2008).
- Watson, S. W., Friederdorf, F. J., Madsen, B. W., Cramer, S. D. Methods of measuring wear-corrosion synergism. Wear. 181, 476-484 (1995).
- Assi, F., Böhni, H. Study of wear-corrosion synergy with a new microelectrochemical technique1. Wear. (233-235), 505-514 (1999).
- Mraied, H., Cai, W. J. The effects of Mn concentration on the tribocorrosion resistance of Al-Mn alloys. Wear. (380-381), 191-202 (2017).
- Vieira, A. C., Rocha, L. A., Papageorgiou, N., Mischler, S. Mechanical and electrochemical deterioration mechanisms in the tribocorrosion of Al alloys in NaCl and in NaNO3 solutions. Corrosion Science. 54, 26-35 (2012).
- Mischler, S., Spiegel, A., Landolt, D. The role of passive oxide films on the degradation of steel in tribocorrosion systems. Wear 225-229, Part 2. , 1078-1087 (1999).
- Mischler, S., Muñoz, A. I. Wear of CoCrMo alloys used in metal-on-metal hip joints: A tribocorrosion appraisal. Wear. 297 (1-2), 1081-1094 (2013).
- Mraied, H., Cai, W. J., Sagues, A. A. Corrosion resistance of Al and Al-Mn thin films. Thin Solid Films. 615, 391-401 (2016).
- Mathew, M. T., Uth, T., Hallab, N. J., Pourzal, R., Fisher, A., Wimmer, M. A. Construction of a tribocorrosion test apparatus for the hip joint: Validation, test methodology and analysis. Wear. 271 (9-10), 2651-2659 (2011).

