Identification of Fatty Acids in Bacillus cereus
Summary
We propose a protocol to identify fatty acids without the need to purify them. It combines information on the retention times with the mass spectra of three types of fatty acid derivatives: fatty acid methyl esters (FAMEs), 4,4-dimethyl oxazoline derivatives (DMOX), and 3-pyridylcarbinyl esters (picolinyl).
Abstract
The Bacillus species contain branched chain and unsaturated fatty acids (FAs) with diverse positions of the methyl branch (iso or anteiso) and of the double bond. Changes in FA composition play a crucial role in the adaptation of bacteria to their environment. These modifications entail a change in the ratio of iso versus anteiso branched FAs, and in the proportion of unsaturated FAs relative to saturated FAs, with double bonds created at specific positions. Precise identification of the FA profile is necessary to understand the adaptation mechanisms of Bacillus species.
Many of the FAs from Bacillus are not commercially available. The strategy proposed herein identifies FAs by combining information on the retention time (by calculation of the equivalent chain length (ECL)) with the mass spectra of three types of FA derivatives: fatty acid methyl esters (FAMEs), 4,4-dimethyl oxazoline derivatives (DMOX), and 3-pyridylcarbinyl ester (picolinyl). This method can identify the FAs without the need to purify the unknown FAs.
Comparing chromatographic profiles of FAME prepared from Bacillus cereus with a commercial mixture of standards allows for the identification of straight-chain saturated FAs, the calculation of the ECL, and hypotheses on the identity of the other FAs. FAMEs of branched saturated FAs, iso or anteiso, display a constant negative shift in the ECL, compared to linear saturated FAs with the same number of carbons. FAMEs of unsaturated FAs can be detected by the mass of their molecular ions, and result in a positive shift in the ECL compared to the corresponding saturated FAs.
The branching position of FAs and the double bond position of unsaturated FAs can be identified by the electron ionization mass spectra of picolinyl and DMOX derivatives, respectively. This approach identifies all the unknown saturated branched FAs, unsaturated straight-chain FAs and unsaturated branched FAs from the B. cereus extract.
Introduction
Fatty acid methyl ester (FAME) gas chromatography (GC) is an essential method for lipid characterization. It rapidly separates and quantifies the various fatty acids (FAs) of a sample after a short extraction step. Derivatives of methyl esters are highly volatile, stable and inert toward the chromatographic column, thereby avoiding tailing peaks. Their identification is rather straightforward when the sample consists of well-known FAs because the chromatographic profiles are either published or compared to standards. In addition, the repeated injection of calibration standards for quantification of various FAs is not required, given their almost constant response to flame ionization detection (FID)1.
In addition to FID, mass spectrometry (MS) detection provides a complementary set of information to confirm FAMEs. However, when FAMEs are charged using electron ionization (EI), the resulting spectra do not always allow for the identification of FA fine structure. For instance, branching position (i.e., a branched methyl group) is difficult to predict because the diagnostic ions are difficult to detect1 and the characteristic change in target ion abundance is machine-dependent, preventing the use of mass spectra libraries2. Another challenge lies in identifying the double bond position because EI causes double bond migration. Thus, FA isomers with varying double bond positions cannot be differentiated by their mass spectra. Fortunately, other tools have been developed for FA identification. For instance, the presence and the position of branching or of double bonds in FAs can be conjectured by calculating the equivalent chain length (ECL)3.
Other derivatization methods result in different mass spectra, dependent on the location of a double bond or a branched methyl group. 4,4-Dimethyl oxazoline derivatives (DMOX)4 allow for easy identification of the position of monounsaturated fatty acid double bonds. 3-pyridylcarbinyl ester (picolinyl ester) derivatives allow for the unambiguous identification of the location of methyl branched FAs5. Combining chromatographic retention (ECL) and mass spectra (DMOX and picolinyl) information allows for the identification of most FAs without the need to use complex methods of purification, as required for nuclear magnetic resonance (NMR) spectrum, the uncontestable method for structural characterization1.
Bacteria of the genus Bacillus, which include some human and animal pathogens, are able to colonize highly diverse niches and are therefore widely distributed in the environment6. Among the Bacillus genus, FA composition is influenced by the ecological niche of the species with modulations in FA patterns to adapt to a wide range of environmental changes (e.g., growth medium, temperature, pH, etc.)7-9. Because of the relative homogeneity of the FA pattern across species of the genus Bacillus during growth in standardized conditions, determination of FA composition is one of the essential criteria used to define the Bacillus species. A unique attribute of the Bacillus genus is the abundance of branched-chain FAs containing 12-17 carbons10-12 with the ratio between iso and anteiso isomers being a key determinant of adaptation to environmental conditions. Bacillus species also adapt to environmental fluctuations by altering the proportion of unsaturated fatty acids. In some species, such as Bacillus cereus, two fatty acid desaturases create double bonds in different positions of the alkyl chain13 with different roles in adaptation9. The example of the Bacillus genus illustrates the importance of precisely identifying the double bond position and FA branching. Collectively, identification of Bacillus FA patterns has several useful applications. Herein, we propose a novel GC-MS approach for Bacillus FA pattern identification that overcomes the inherent limitations of a classical GC-MS analysis.
This innovative approach can be used directly on raw biological material, and consists of a combination of existing techniques: information on retention times (ECL) and mass spectra of different FAs derivatives (FAME, DMOX and picolinyl-ester).
We use the following FA nomenclature. i, a, and n indicate iso, anteiso methyl branched, and straight-chain fatty acid, respectively. Unsaturated FAs were named by C:d where C is the number of carbon atoms in the fatty acid and d is the number of double bonds. Δx indicates the position of the double bond, where the double bond is located on the xth carbon-carbon bond, counting from the carboxylic acid end.
Protocol
1. Bacterial Cultures
- Prepare a lawn of the bacteria (Bacillus cereus strain ATCC 14579) by spreading 100 µl of an overnight culture of the strain incubated at 30 °C in LB (Luria-Bertani medium), over the surface of a plate of LB agar medium. Incubate the plate overnight at 30 °C.
2. ECL: Equivalent Chain Length
- Calculate ECL as follows:
 with:
with:
i, the solute of interest;
n, the carbon number of the straight chain saturated fatty acid methyl ester eluting before solute I;
n+1, the carbon number of the straight chain saturated fatty acid methyl ester eluting after solute I;
Rti, Rtn, Rt(n+1) the retention times of the FAME peaks described above.
NOTE: Obtain the retention times of straight chain saturated fatty acids methyl esters by injection of a mixture of standards (BAME).
3. FAME Preparation and Analysis
- In order to obtain lipid fatty acids, harvest bacterial cells by scraping colonies from the agar plate and transfer 40 mg (fresh weight, equivalent to 109 viable cells) of bacteria into a 10 ml glass tube with screw caps and PTFE seals.
- Perform transesterification via the ester link method14,15 detailed below.
- Add 5 ml of 0.2 M KOH in methanol to the fresh bacterial cells and incubate at 37 °C for 1 hr. This reaction consists of alkaline methanolysis, breaking the ester link in the lipid and producing fatty acid methyl esters.
- Add 1 ml of 1 M acetic acid to lower the pH to 7.0. Check the pH with pH test strips.
- Add 3 ml of hexane to extract FAMEs.
- Transfer supernatant (organic phase) into clean tubes and concentrate by evaporation at room temperature under a continuous flow of nitrogen to obtain approximately 200 µl of extract. Transfer the sample into a GC vial with insert.
- Inject extracts into a gas chromatography-mass spectrometry (GC-MS) system.
4. GC/MS Conditions
- Inject FAME samples into a GC-MS instrument equipped with a capillary column ZB-WAX (length, 30 m; diameter, 0.25 mm; film thickness, 0.25 µm).
- Set the injection port (in splitless mode) temperature to 250 °C. Use helium as a carrier gas, with a linear velocity of 37 cm/sec. Hold the oven temperature at 50 °C for 1 min, increase to 190 °C at a rate of 20 °C/min, and increase further to a final temperature of 230 °C at a rate of 2 °C/min.
- For the MS, record the mass spectra by electron ionization (EI) at 70 eV, and set the acquisition of the total ion current between 50 and 400 atomic mass units (amu) (2 scans/sec).
- When required, inject DMOX and picolinyl derivatives under the same condition except the temperature program oven as follows:
DMOX: 50 °C (1 min), 20 °C/min until 210 °C and 2 °C/min until 240 °C (5 min);
Picolinyl: 6 °C (1 min), 20 °C/min until 220 °C and 2 °C/min until 250 °C (20 min).
5. Picolinyl Ester Preparation from FAME16
- Evaporate the FAME extract from Section 3 with a flow of nitrogen (at least 10 mg dry material) and dissolve in 1 ml of dry dichloromethane.
- Prepare a 1.0 M solution of potassium tert-butoxide in tetrahydrofuran.
- Add the FAME extract and 0.2 ml 3-pyridinemethanol to 0.1 ml of solution made in step 5.2.
- Heat the solution at 40 °C for 30 min in a closed vial.
- After cooling to room temperature, add purified deionized water (2 ml, see Materials Table) and hexane (4 ml). Mix with a vortex, allow phase to separate, and collect the organic phase.
- Dry it by adding anhydrous sodium sulfate until the organic phase is perfectly clear. Transfer it into a clean tube. Then evaporate to 200 µl. Transfer the sample into a GC vial with insert.
6. DMOX Preparation from FAME17
- Evaporate the FAME extract from Section 3 with a flow of nitrogen (at least 10 mg dry material).
- To the FAME dry extract, add 250 mg of 2-amino-2-methyl-1-propanol. Flush the vessel with nitrogen, add a stopper, and place it in a heating block overnight at 190 °C.
- After cooling to room temperature, add 3 ml dichloromethane to the tube, and 5 ml purified deionized water (See Materials Table).
- Shake for phase separation and then remove the aqueous phase.
- Wash the organic phase with 5 ml water. Shake for phase separation and then remove the aqueous phase.
- Dry by adding anhydrous sodium sulfate until the organic phase is perfectly clear and transfer it into a clean tube. Evaporate under a stream of nitrogen until reaching a volume of 200 µl. Transfer the sample into a GC vial with insert.
Representative Results
The strategy of FA identification from bacterial cells is presented in Figure 1. Each step provides complementary spectral information or information about chromatographic retention. Step 1 consists of preliminary FA identification using a standard solution. Step 2 allows for the interpretation of FAME EI spectra and their ECL, in order to tentatively identify the products. Step 3 identifies the exact branching location in branched chain-FAs. Finally, step 4 identifies the precise position of double bonds in unsaturated FAs.
FAME and ECL
The BAME mixture allowed us to identify a series of straight-chain saturated fatty acids (n12 at n17) and some methyl branched fatty acid (i15, a15, i16, i17). However, very few FAs specific to B. cereus were detected in our sample, justifying the development of the identification method described below.
Regardless of chain length, branched saturated FAs (iso or anteiso) of a homologous series (i.e., a series of compounds with the same general formula) display a constant shift in ECL compared to the straight saturated FA having the same number of carbon in their carbon-chain. This shift, called fractional chain length (FCL), allows for the identification of FAs in a homologous series. For instance, iso-FAs (denoted with the prefix "i") have an FCL value of -0.48, while anteiso FAs (denoted with the prefix "a") have a FCL of -0.33. It is then easy to identify an i14 and i13 with an ECL of 13.52 and 12.52, respectively, and an a13 and a15 with an ECL of 12.67 and 14.66, respectively.
Table 1 displays the ECLs for each of the FAs detected in our sample. Retention times predicted for iso and anteiso series, together with MS spectra obtained with FAMEs, allowed us to identify all of the branched chain-FA from our sample. Such identification at this step was tentative, but later confirmed by EI spectra obtained from picolinyl FAs derivatives.
FAMEs with ECLs not corresponding to the iso or anteiso shifts are unsaturated, straight or branched chain FAs, as indicated by the mass of their molecular ion. Unsaturated FAs show a positive shift in ECL as compared to the corresponding saturated FA. Spectra from DMOX derivatives, combined with spectra from picolinyl derivative for branched FAs, allow for the identification of double bond position.
Such derivatization methods are appropriate for FA identification only when elution order is retained, as shown for the three derivative mixtures (i.e., FAME, DMOX and picolinyl) in Figure 2 for several 16:1 FAs. This approach permits the collection of complementary spectral information of one peak using 3 derivatization methods which can be combined to identify FA structure. No differences in elution order were observed between the 3 derivatives, although retention times and oven temperatures were different.
Picolinyl esters of iso and anteiso methyl branched-chain saturated fatty acid
The spectra obtained by EI confirm the presence of methyl branched-chain FAs. Indeed, the molecular ions have the m/z corresponding to saturated FAs. We observed an ion series with a gap of 14 mass units (amu) corresponding to a loss of a methylene group except in the region of the branch point where the ion corresponding to the substituted carbon atom is missing. We then observe a gap of 28 amu between the two ions corresponding to fragments created before and after the branched carbon. Figure 3 shows the spectrum of i16 with the diagnostic ions (304 and 332) showing the branching location.
DMOX of straight-chain unsaturated fatty acids
Figure 2 presents five different peaks associated with the 16:1 fatty acid. The first two peaks have ECL values <16. We conclude that their structure is certainly branched. The identification of these compounds requires the interpretation of mass spectra produced by DMOX and picolinyl ester derivatives. Three peaks possessing ECL >16 match monounsaturated straight-chain fatty acids. DMOX derivative mass spectra show diagnostic ions identifying the position of the double bond of these compounds. In Figure 4 we can see a gap of 12 amu ion between 196 and 208 indicating the presence of the double bond with carbon 8 of the n16:1 Δ8 fatty acid, according to the empirical rule for location of a double bond in the fatty chain as defined by Zhang18. When the double bond location is before carbon 7, the diagnostic ions differ. For example, Zhang18 and Fay17 observed that for a FA with an unsaturated double bond at carbon 5, the daughter ion derived from cleavage at the double bond, m/z 152, is accompanied by an intense odd-numbered daughter at m/z 153. In Figure 5, the presence of the intense m/z 153 fragment and of the m/z 307 molecular ion, identifies this compound as n16: 1 Δ5.
DMOX and picolinyl mass spectra of methyl branched-chain monounsatured fatty acids
Figure 6 presents spectra of DMOX and picolinyl ester derivatives, used to determine the structure of i16:1 Δ9 FA. The position of the branching is indicated by a gap of 28 amu for both derivatives. A gap of 12 amu for DMOX and 26 for picolinyl ester identifies the double bond position, as shown in Figure 6.
Identification of the fatty acids and diagnostic ions
Table 1 shows the various fatty acids identified, with the corresponding diagnostic ions, in Bacillus cereus ATCC 14579 grown at 30 °C. These diagnostic ions identify the positions of the methyl branching and double bonds on the carbon chain for the DMOX and picolinyl ester derivatives, which provide complementary structural information. The two approaches are truly complementary, as diagnostic ions are sometimes easier to observe with DMOX derivatives, and at other times easier to observe with picolinyl derivatives.

Figure 1: Strategy for the identification of fatty acids in Bacillus cereus.
The successive steps generating information on retention times (ECL), on mass spectra of FAME, of DMOX, and of picolinyl-ester are shown. Please click here to view a larger version of this figure.
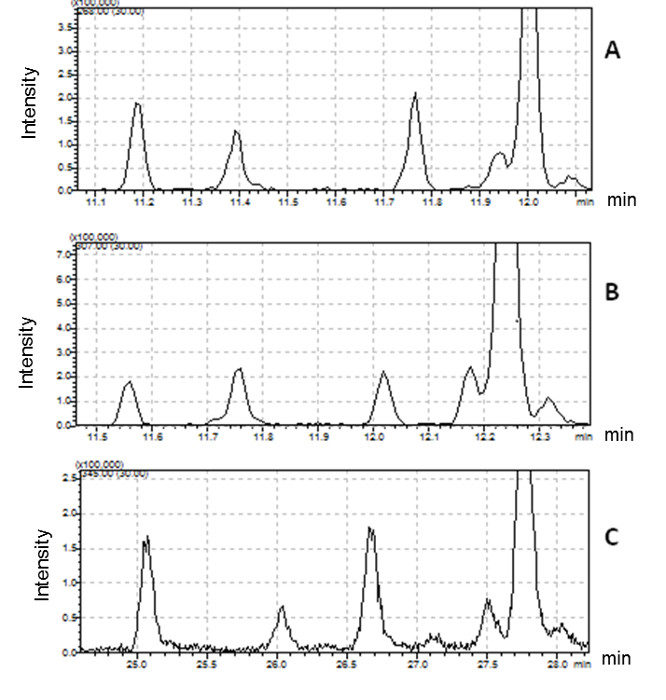
Figure 2: Comparison of chromatographic profiles for different 16:1 fatty acids detected in Bacillus cereus.
(A) FAME derivatives (molecular ion extracted at m/z 268); (B) DMOX derivatives (molecular ion extracted at m/z 307); (C) picolinyl derivatives (molecular ion extracted at m/z 345). Please click here to view a larger version of this figure.
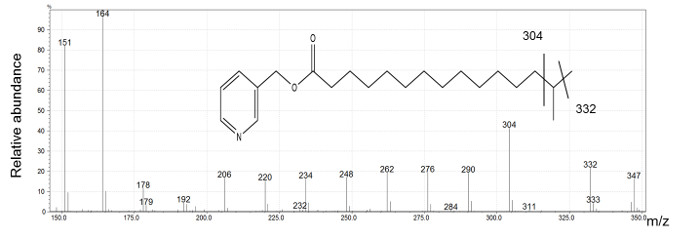
Figure 3: i16 picolinyl derivative mass spectrum generated by electron ionization.
Ions at m/z 151 and m/z 164 indicate the presence a picolinyl derivative of fatty acid. The molecular ion at m/z 347 is identified as an isomer of palmitic acid. The presence of a gap of 28 amu between the ion at m/z 304 and m/z 332 is indicative of i16. Please click here to view a larger version of this figure.
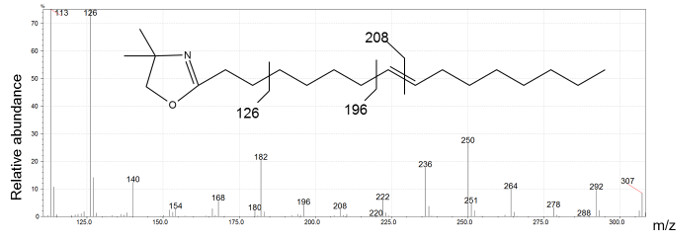
Figure 4: n16:1 Δ8 DMOX derivative mass spectrum generated by electron ionization.
The ion at m/z 126 indicates a DMOX derivative, m/z 307 is the molecular ion of 16:1 DMOX and the presence of a gap of 12 amu between the ions at m/z 196 and m/z 208 identifies the location of double bond on carbon 8. Please click here to view a larger version of this figure.
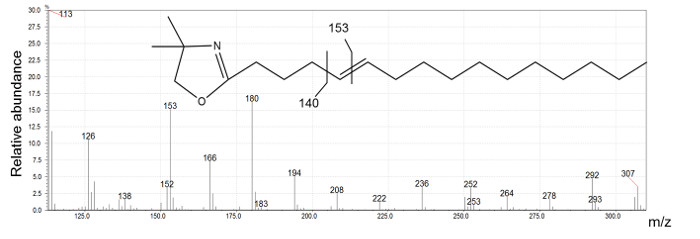
Figure 5: n16:1 Δ 5 DMOX derivative mass spectrum generated by electron ionization.
Ion at m/z 126 is indicative of a DMOX derivative and m/z 307 is the molecular ion of 16:1 DMOX. The intense m/z 153 ion is characteristic of a double bond located on carbon 5. Please click here to view a larger version of this figure.
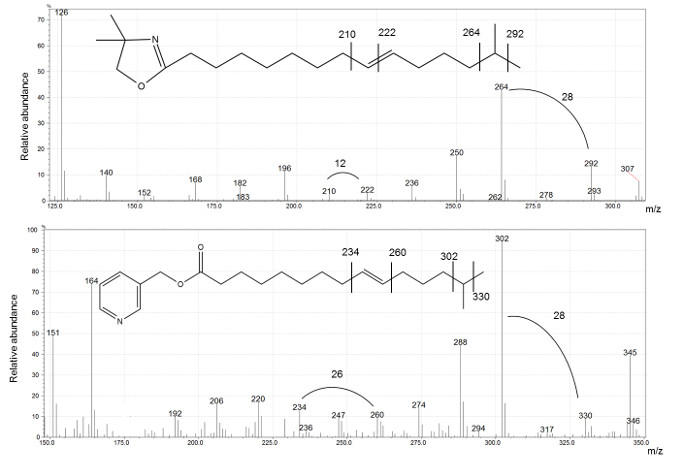
Figure 6: DMOX (top) and picolinyl (bottom) comparison of i16: 1Δ9 spectra.
In both cases the gap of 28 amu indicate the position of the methyl branching. The double bond location can be derived by a gap of 12 amu and 26 amu for DMOX and picolinyl derivatives, respectively. Please click here to view a larger version of this figure.
| Putative compounds | Molecular ion (m/z) FAME ; DMOX; picolinyl | RT | ECL | Confirmed identification | Diagnostic ions DMOX | Diagnostic ions picolinyl |
| i12 | 214;253;291 | 7.93 | no reference | i12 | [276(15);262(0); 248(15)] mb |
|
| n12 | 214;253;291 | 8.21 | 12.00 | n12 | [276(10);262(20); 248(20)] mb |
|
| i13 | 228;267;305 | 8.53 | 12.5 | i13 | [290(15);276(0); 262(48)]mb | |
| a13 | 228;267;305 | 8.64 | 12.67 | a13 | [276(48);262(0); 248(65)]mb |
|
| i14 | 242;281;319 | 9.24 | 13.52 | i14 | [304(20); 276(45) 290(0)]mb | |
| n14 | 242;281;319 | 9.60 | 14.00 | n14 | [304(7);290(17); 276(17)]mb |
|
| i15 | 256;295;333 | 10.06 | 14.51 | i15 | [318(20);314(0); 290(50)]mb |
|
| a15 | 256;295;333 | 10.19 | 14.66 | a15 | [304(30);290(tr); 276(62)]mb |
|
| n15 | 256;295;333 | 10.49 | 15.00 | n15 | [318(5);304(13); 290(18)]mb |
|
| i16 | 270; 309;347 | 11.04 | 15.5 | i16 | [332(18);318(tr); 304(42)]mb |
|
| methyl branched 16:1 | 268; 307;345 | 11.19 | 15.64 | i16:1Δ5 | [152(2);153(10)]db [292(3);278(tr); 264(2)]mb |
|
| methyl branched 16:1 | 268; 307;345 | 11.40 | 15.83 | i16:1 Δ9 | [210(3);222(3)]db [292(12);278(tr); 264(40)]mb |
|
| n16 | 270; 309;347 | 11.59 | 16.00 | n16 | [332(5);318(15); 304(15)]mb |
|
| 16:1 | 268; 307;345 | 11.78 | 16.14 | n16:1 Δ5 | [152(2);153(10)]db | |
| 16:1 | 268; 307;345 | 11.94 | 16.24 | n16:1 Δ8 | [196(5);208(3)]db | |
| 16:1 | 268; 307;345 | 12.00 | 16.31 | n16:1Δ9 | [210(3);222(3)]db | |
| 16:2 | 266; 305;343 | 12.18 | 16.44 | n16:2 Δ5, Δ9 | [152(2);153(12)]db [208(1);220(2)]db | |
| i17 | 284;323;361 | 12.25 | 16.5 | i17 | [346(20);332(tr); 318(35)]mb |
|
| methyl branched 17:1 | 282;321;359 | 12.43 | 16.64 | i17:1Δ5 | [152(2);153(10)]db | [344(10);316(5)]mb |
| a17 | 284;323;361 | 12.47 | 16.66 | a17 | [332(30);318(0); 304(52)]mb |
|
| methyl branched 17:1 | 282;321;359 | 12.57 | 16.74 | i17:1Δ8 | [196(2);208(2)]db | [344(10);316(5)]mb |
| methyl branched 17:1 | 282;321;359 | 12.64 | 16.79 | i17:1Δ9 | [210(3);222(3)] db | |
| methyl branched 17:1 | 282;321;359 | 12.70 | 16.84 | i17:1Δ10 | [224(1);236(1)]db | |
| methyl branched 17:1 | 282;321;359 | 12.84 | 16.94 | a17:1Δ9 | [210(3);222(4)]db | [330(10);316(0); 302(90)]mb |
Table 1: Identification of fatty acids from Bacillus cereus ATCC 14579.
Retention times, equivalent chain length (ECL) values, and molecular ions for fatty acid methyl esters (FAMEs) are shown, together with molecular ions and diagnostic ions for DMOX and picolinyl derivatives.
[]mb diagnostic ion pair indicating a loss of 28 amu corresponding to fragment before and after carbon branching.
[]db diagnostic ion pair indicating a loss of 12 amu corresponding to the cleavage of a double bond.
Discussion
The FAs chromatogram profiles shown in Table 1 correspond to B. cereus ATCC 14579 grown on an agar plate surface. Similar profiles were obtained when the bacterium was grown in aerated liquid media at the same temperature8. In the case of bacteria grown in liquid media, the bacterial biomass is collected by centrifugation of the growth medium and can be washed according to previously described protocols depending on the growth conditions8,19. The identification of the various FAs produced by B. cereus permitted fine changes in the proportion of the FAs to be detected in strains mutated on some genes necessary for growth at low temperature7,9.
Usually, ECL is calculated using log values of the adjusted retention time determined at a fixed temperature (using an oven with isothermal temperature control)20. Here, because of the use of a non-isothermal oven to permit an optimized separation of the FAME of interest, the calculation method used was that previously described for linear retention indices3,21.
The aim of this work was not to compare the calculated ECL values with those described in the literature, but to predict the FA structure, within the same chromatogram profile, based on these retention data and spectra information. Indeed, for saturated FAs, a given branching (iso or anteiso) always causes the same shift in ECL, as compared to the equivalent straight-chain FA. In addition, the ECL calculated in the present study matched with values measured by Stransky22 on a column of equivalent polarity. This concurrence with previously reported values indicates that ECL values are thus very useful for a rapid identification of the peaks from FAs chromatogram profiles of B. cereus grown in other conditions, or of other strains (e.g., mutants) of B. cereus.
Picolinyl derivatives displayed longer retention times but a lower signal/noise ratio as compared to the other derivatives tested. Previous reports suggest that their elution is more difficult4. It is likely that the use of a column with a low film-thickness, and the fact that the Bacillus species contains FAs with less than 18 carbons, make it possible to use the same polar chromatographic column to generate high-quality GC-MS chromatograms of the 3 derivatives.
Picolinyl derivatives provide more characteristic ions indicative of the branching location than ions generated by DMOX derivatives, while the position of the double bond is more easily assigned with the DMOX derivatives. The present study shows the usefulness of combining information from both derivatives to identify the methyl branched-chain unsaturated FAs from B. cereus, which until now have been poorly described in the literature.
The proposed approach can be completed within 2 days. As a comparison, for NMR spectroscopy, each FA should be purified, representing several weeks of work and a large amount of biological material. However, the approach does not differentiate the geometry (cis, trans) of double bounds. Once each FA is identified, they can be routinely quantified by their FAME derivatives, e.g., to compare bacterial strains and mutants or to study the impact of growth conditions. In our hands, as little as 8 mg of fresh bacterial cells were sufficient for the quantification of FAs, which makes the method applicable to difficult to grow bacteria. The quantification limit for each of the identified FAs is 1 ng/µl of solution injected in the GC/MS.
Divulgaciones
The authors have nothing to disclose.
Acknowledgements
Authors are grateful to Thomas Mison for his technical support, and to Rachel Kopec for revising the manuscript.
Materials
| GC/MS | Shimadzu | QP2010 | |
| capillary column ZB WAX | Phenomenex | 7HG-G007-11 | 30m x 0.25mm x 0.25µm |
| Methanol Lichrosolv | VWR | 1.06018.2500 | |
| potassium hydroxide | Aldrich | P1767 | |
| THF | Hipersolv Chromanorm | 28559.320 | |
| Dichloromethane | Hipersolv Chromanorm | 23373.320 | |
| Hexane | Hipersolv Chromanorm | 24575.320 | |
| 3-pyridinemethanol | Aldrich | P6-680-7 | |
| potassium tertiobutoxide | Aldrich | 156671 | |
| 2-amino-2-methyl-1-propanol | A-9879 | ||
| MilliQ Academic | Millipore | ZMQS50001 | |
| Bacterial Acid Methyl Ester (BAME) Mix | Sigma-Aldrich | 47080-U Supelco |
Referencias
- Christie, W. W., Han, X. . Lipid Analysis 4th Edition. , (2010).
- HÜbschmann, H. -. J. . Handbook of GC-MS: fundamental and application. Third edition. , (2015).
- Sasser, M. Identification of Bacteria by Gas Chromatography of Cellular Fatty Acids. MIDI Technical note. 101, 1-6 (1990).
- Spitzer, V. Structure analysis of fatty acids by gas chromatography – Low resolution electron impact mass spectrometry of their 4,4-dimethyloxazoline derivatives – A review. Prog Lipid Res. 35 (4), 387-408 (1996).
- Harvey, D. J., Christie, W. W. . Advances in lipid methodology. Volume 1. , 19-80 (1992).
- Diomande, S. E., Nguyen-The, C., Guinebretière, M. -. H., Broussolle, V., Brillard, J. Role of fatty acids in Bacillus environmental adaptation. Front Microbiol. 6, (2015).
- Brillard, J., et al. Identification of Bacillus cereus Genes Specifically Expressed during Growth at Low Temperatures. Appl Environ Microbiol. 76 (8), 2562-2573 (2010).
- de Sarrau, B., et al. Influence of Anaerobiosis and Low Temperature on Bacillus cereus Growth, Metabolism, and Membrane Properties. Appl Environ Microbiol. 78 (6), 1715-1723 (2012).
- Diomandé, S. E., et al. Involvement of the CasK/R two-component system in optimal unsaturation of the Bacillus cereus fatty acids during low-temperature growth. Int J Food Microbiol. 213, 110-117 (2015).
- Berkeley, R. C. W., Heyndrickx, M., Logan, N., De Vos, P., Berkeley, R. C. W. . Applications and Systematics of Bacillus and Relatives. , 1-7 (2002).
- Kämpfer, P. Limits and Possibilities of Total Fatty Acid Analysis for Classification and Identification of Bacillus Species. System. Appl. Microbiol. 17 (1), 86-98 (1994).
- Kaneda, T. Fatty-acids of genus bacillus – example of branched-chain preference. Bacteriol Rev. 41 (2), 391-418 (1977).
- Chazarreta Cifre, L., Alemany, M., de Mendoza, D., Altabe, S. Exploring the Biosynthesis of Unsaturated Fatty Acids in Bacillus cereus ATCC 14579 and Functional Characterization of Novel Acyl-Lipid Desaturases. Appl Environ Microbiol. 79 (20), 6271-6279 (2013).
- Sasser, M., et al. Identification of Bacillus anthracis from culture using gas chromatographic analysis of fatty acid methyl esters. J AOAC Int. 88 (1), 178-181 (2005).
- Schutter, M. E., Dick, R. P. Comparison of fatty acid methyl ester (FAME) methods for characterizing microbial communities. Soil Sci Soc Am J. 64 (5), 1659-1668 (2000).
- Destaillats, F., Angers, P. One-step methodology for the synthesis of FA picolinyl esters from intact lipids. J Am Oil Chem Soc. 79 (3), 253-256 (2002).
- Fay, L., Richli, U. Location of double-bonds in polyunsaturated fatty-acids by gas-chromatography mass-spectrometry after 4,4-dimethyloxazoline derivatization. J Chromatogr. 541 (1-2), 89-98 (1991).
- Zhang, J. Y., Yu, Q. T., Liu, B. N., Huang, Z. H. Chemical modification in mass spectrometry IV-2-alkenyl-4,4-dimethyloxazolines as derivatives for the double bond location of long-chain olefinic acids. Biol Mass Spect. 15 (1), 33-44 (1988).
- de Sarrau, B., et al. Unsaturated fatty acids from food and in the growth medium improve growth of Bacillus cereus under cold and anaerobic conditions. Food Microbiol. 36 (2), 113-122 (2013).
- Miwa, T. K., Mikolajczak, K. L., Earle, F. R., Wolff, I. A. Gas chromatographic characterization of fatty acids.Identification constants for mono- and dicarboxylic methyl esters. Anal Chem. 32 (13), 1739-1742 (1960).
- van Den Dool, H., Kratz, P. A generalization of the retention index system including linear temperature programmed gas-liquid partition chromatography. J Chromatogr A. 11, 463-471 (1963).
- Stransky, K., Jursik, T., Vitek, A. Standard equivalent chain length values of monoenic and polyenic (methylene interrupted) fatty acids. J High Res Chromatogr. 20 (3), 143-158 (1997).

