Assessing Specificity of Anticancer Drugs In Vitro
Summary
The goal of this protocol is to assess specificity of anticancer drugs in vitro using mixed cultures containing both tumor and non-tumor cells.
Abstract
A procedure for assessing specificity of anticancer drugs in vitro using cultures containing both tumor and non-tumor cells is demonstrated. The key element is the quantitative determination of a tumor-specific genetic alteration in relation to a universal sequence using a dual-probe digital PCR assay and the subsequent calculation of the proportion of tumor cells. The assay is carried out on a culture containing tumor cells of an established line and spiked-in non-tumor cells. The mixed culture is treated with a test drug at various concentrations. After the treatment, DNA is prepared directly from the survived adhesive cells in wells of 96-well plates using a simple and inexpensive method, and subjected to a dual-probe digital PCR assay for measuring a tumor-specific genetic alteration and a reference universal sequence. In the present demonstration, a heterozygous deletion of the NF1 gene is used as the tumor-specific genetic alteration and a RPP30 gene as the reference gene. Using the ratio NF1/RPP30, the proportion of tumor cells was calculated. Since the dose-dependent change of the proportion of tumor cells provides an in vitro indication for specificity of the drug, this genetic and cell-based in vitro assay will likely have application potential in drug discovery. Furthermore, for personalized cancer-care, this genetic- and cell-based tool may contribute to optimizing adjuvant chemotherapy by means of testing efficacy and specificity of candidate drugs using primary cultures of individual tumors.
Introduction
Therapeutic effects of anticancer drugs on tumor cells are associated with various unwished toxic effects on non-tumor cells. Toxic effects are difficult to assess in the laboratory, largely due to the lack of suitable tools1. Cell cultures containing both tumor and non-tumor cells would provide a potential in vitro resource for assessing specificity or selectivity of a drug which may shed light on clinical toxicity. However, conventional in vitro assays such as proliferation or viability assays measure effect of a drug on total cells, but cannot divide the effect into the part on tumor cells and the part on non-tumor cells. For example, a 50% reduction of total cell number in a culture composed of 50% tumor cells and 50% non-tumor cells can imply death of all tumor cells, death of all non-tumor cells or, more likely, death of parts of both at various ratios.
Also because of this technical problem, primary cultures which contain tumor and non-tumor stromal cells are frequently unsuitable for testing drugs. On the other side, because of this cellular heterogeneity, primary cultures resemble their original tumors far better than clonal cells in established cell lines2. More importantly, primary cultures are patient-specific and may enable individualized drug testing2-4.
An essential issue is therefore the development of a method for determination of the proportion of tumor cells in mixed cultures including primary cultures. Toward this challenge, a genetic solution was conceived which is based on determination of the quantitative ratio of a tumor-specific genetic feature to a universal reference sequence. From this ratio, the proportion of tumor cells in a mixed culture can be calculated.
This study illustrates the procedure of the genetic and cell-based tool for assessing specificity of anticancer drugs including (1) preparing a mixed culture from tumor cells of an established line and non-tumor fibroblasts, (2) treating the mixed culture with a test drug, (3) preparing DNA for digital PCR, (4) determining the ratio of an tumor-specific heterozygous deletion to a reference sequence using a dual-probe droplet digital PCR assay, (5) calculating proportions of tumor cells at each drug concentration and (6) drawing up dose-dependent change of proportion of tumor cells.
Protocol
1. Preparing Mix Culture Containing Both Tumor Cells and Non-tumor Cells
- Use tumor cells from an established cell line MPNST S4625. Use fibroblasts as the non-tumor cells6,7
- Culture both tumor cells and fibroblasts in standard DMEM medium with 10% fetal bovine serum (BSA), 3 mM glutamine, 0.1 mM 2-mercaptoethanol, 500 U/ml penicillin, 500 g/ml streptomycin and 1 mM sodium pyruvate at 37 °C and 5% CO25-7. At sub-confluence, harvest the cells with 0.05% trypsin and count them using a hemocytometer.
- Mix 400 tumor cells and 1,600 non-tumor cells together in each well of a 96-well culture plate in 0.2 ml medium. Considering faster growth of tumor cells over the treatment period of 5 days, the initial proportion of tumor cells was set at 25%. Set up 4 replicates for each drug concentration. Incubate the cells at 37 °C and 5% CO2 O/N.
2. Drug Treatment
- Use nilotinib as the test drug. Prepare stock solutions of 0, 2, 4 and 20 mM nilotinib in DMSO. Dilute each of them by 200-fold in 5 ml DMEM medium, giving 2-fold concentrated drug-solutions of 0, 10, 20 and 100 µM6.7.
- Remove 0.1 ml medium from each well and add 0.1 ml of medium containing drug. The final concentrations are 0, 5, 10 and 50 µM. Continue incubating the cells in medium containing drug for 5 days.
- At the end of the treatment, inspect the attached cells using a phase-contrast microscope and take photos. Aspirate the medium away, wash the survived adhesive cells once with 0.2 ml PBS.
3. Preparing DNA for Digital PCR
- Lyse cells using HotShot8.
- Add 50 µl alkaline lysis solution (25 mM NaOH, 0.2 mM EDTA) to each well. Seal the wells with foil. Incubate the plate at 95 °C in an oven or on a heating plate for 30 min. Check under a microscope to make sure that no more intact cells remained at the surface of the wells. In case the cells did not lyse completely, increase the heating time or add detergent. Freeze them once at -20 °C also enhances breaking cells.
- Add 50 µl neutralizing solution (40 mM Tris-HC, pH 4.0) to each well. Transfer all lysates into U-form wells of a PCR plate and dry in a PCR cycler at 95 °C for 10 to 30 min. Reconstitute the lysates with 20 µl distilled water.
- Desalt using Drop-Dialysis9
- use membrane filters with mean pore size 0.025 µm.
- Float the filter on distilled water with shiny side up in wells of a 12-well plate. Wet the filter for 5 min. Pay attention to avoid air bubbles between the filter and water.
- Pipet the reconstituted lysates of each sample from step 3.1.4 carefully onto on each of the 4 areas of the filter. Cover the plate and dialyze for 30 to 60 min.
- Suck away the water under the filter without flipping over the filter nor disturbing the drops.
- Transfer the lysate-drops into wells of a new PCR-plate. Dry the DNA-drops by heating at 95 °C for 10 to 30 min in a PCR cycler. Reconstitute the lysates in 10 µl water.
4. Digital PCR
- Thaw frozen components such as DNA, buffer and the assay mix at RT, spin down for 10 sec at maximum force of any available centrifuge (for example, VWR mini centrifuge) and then keep them on ice.
- Prepare master mixture containing all components except DNA (Table 1). Consider dead volume and calculate master mixture approximately 10% more than the required amount.
NOTE: Use the primers and probes used in the commercial kit. - Vortex the master mixture, spin down for 10 sec at maximum force of any available centrifuge (for example, VWR mini centrifuge) and dispense 15 µl to each well of a 96-PCR plate. Add all lysate (which contains DNA) of each sample to the wells containing the master mixture. Transfer 20 µl of each reaction mixture into a well on the sample side of a cartridge at RT.
- Dispense 70 µl of droplet generator oil into each well on the oil side of a cartridge. Close the cartridge with the gasket and place the whole setting into a droplet generator. Start droplet generation.
- Transfer 40 µl droplet-solution into wells of a 96-well PCR plate. Seal the plate with a foil and place the plate into a PCR cycler. Set the lid-temperature at 105 °C and ramp rate at 2 °C/sec. Carry out PCR using the settings in Table 2. After the PCR, transfer the plate into a droplet reader and start reading. Alternatively, store the plate at 4 °C for up to 24 hr.
5. Calculating Proportion of Tumor Cells
- Load the digital PCR data and perform automatic analysis.
- Control the results of each assay manually by inspecting the one-dimensional and 2-dimensional distribution of the positive and negative droplets, and sure that they are well separated and the threshold lines were in the right positions. Exclude results not meeting the criteria, for example, no clear separation of positive and negative droplets, from further analysis. Copy the resulting ratio NF1/RPP30 into an excel sheet.
- Calculate the proportion of tumor cells as: 2 x (1- NF1/RPP30).
6. Dose-dependent Change of Proportion of Tumor Cells
- For each drug-concentration, calculate the mean and standard deviation from the 4 replicates. Plot the means and the standard deviations against drug-concentrations.
Representative Results
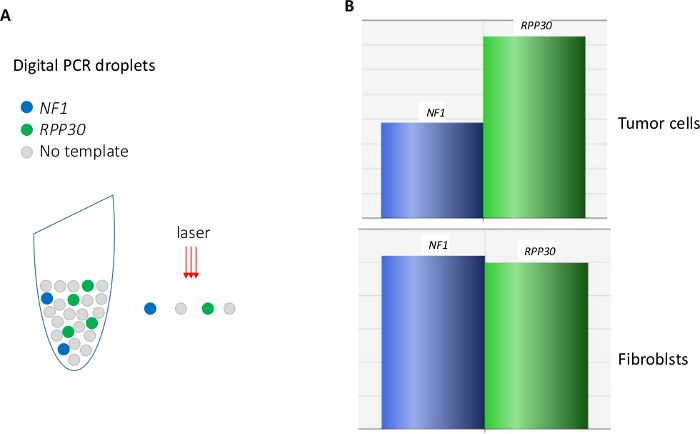
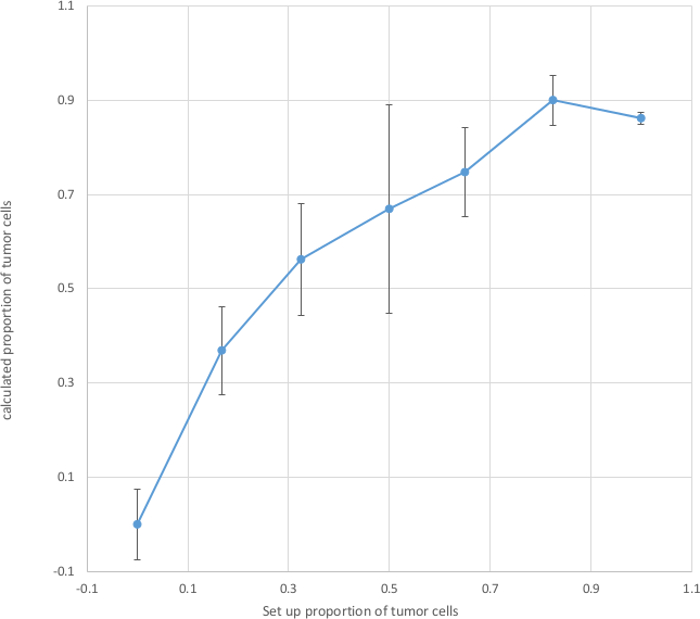
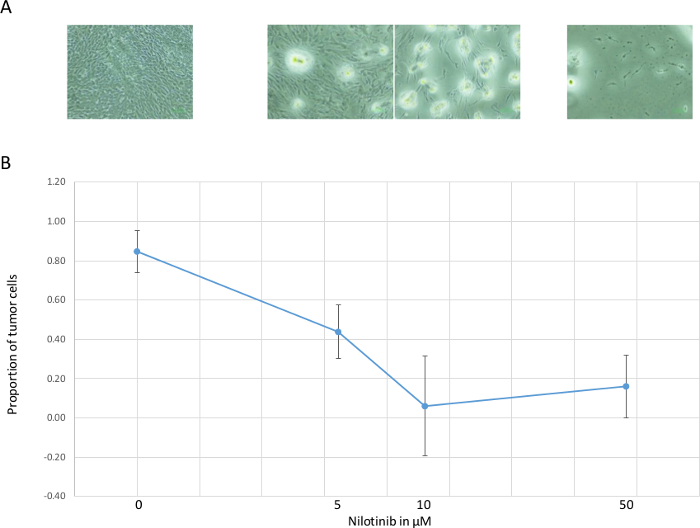
Quality of DNA prepared using the combined HotShot/Drop-Dialysis is sufficient for satisfactory digital PCR (Figure 1B). For 2,000 fibroblasts, approximately 3,000 ± 500 positive droplets were obtained, corresponding to 75% of the expected 4,000 copies (two copies in one cell). In this study, the tumor cells were from an established line MPNST S462 which are known to have a heterozygotic deletion of the NF1 gene5. This 50% gene dosage reduction was clearly detected by the dual digital PCR assay (Figure 1B). By contrast, two copies of this gene were measured in fibroblasts. This genetic difference between tumor and non-tumor cells enables calculation of the proportion of tumor cells in mixed cultures (Figure 2). By measuring the relative gene dosage of NF1 a RPP30, proportion of tumor cells in a mixed culture can be determined at each drug-concentration (Figure 3).

Figure 1. Digital PCR. (A) illustration of the principle. (B) a dual-probe assay reveals reduced amount of a target (NF1) gene in the tumor cells MPNST S462 in relation to a reference (RPP30) gene. Please click here to view a larger version of this figure.

Figure 2. Calculated Proportion of Tumor Cells. Tumor cells and non-tumor cells were mixed at various ratios and seeded into each well of a 96-plate. After attachment O/N, the cells were lysed with HotShot/Drop-dialysis and the desalted lysates were subjected to digital PCR which gave the ratio of NF1/RPP30. Base on this ratio, proportion of tumor cells in each well was calculated. Mean and standard deviation of proportion of tumor cells were calculated from 4 replicates at each set-up proportion. The calculated proportions of tumor cells (Y-axis) were plotted against the set-up proportions (X-axis). Please click here to view a larger version of this figure.

Figure 3. Dose-dependent Change of Proportion of Tumor Cells. (A) dose-dependent reduction of visible vital cells. (B) proportion of tumor cells (mean and standard deviation of 4 replicates) calculated from the ratio of NF1: RPP30, decreased in the range of 0 – 10 µM. At the highest dose 50 µM, few vital cells were left, likely due to toxic effect to all cells. Please click here to view a larger version of this figure.

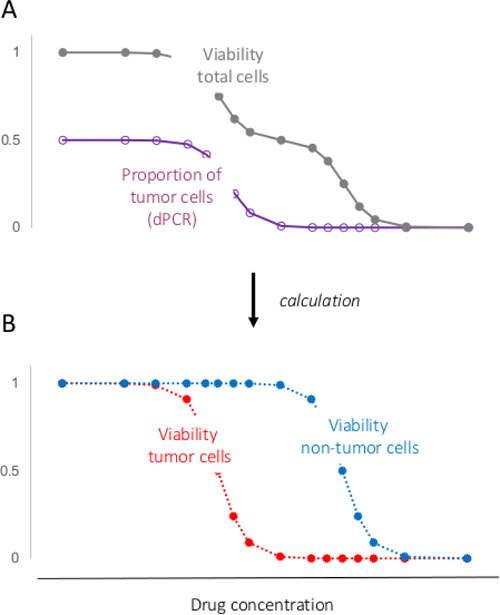
Figure 4. Separating Response of Tumor Cells from That of Non-tumor Cells. (A) viability or/and proliferation of total cells can be measured using conventional assays; Proportion of tumor cells can be determined using the procedure demonstrated in the present study. (B) using the two parameters, response of total cells in a mixed culture to a drug can be divided into response of the tumor cells and response of the non-tumor cells. Please click here to view a larger version of this figure.
| 1 Reaction | ||
| 2 x ddPCR supermix | 12 | |
| Assay mix for NF1 | 1.2 | |
| Assay mix for RPP30 | 1.2 | |
| HaeIII | 0.6 | |
| Subtotal | 15 | Master mixture |
| DNA | 9 | |
| Total | 24 | Final PCR Mixture |
Table 1 Setting Up Dual ddPCR Reaction
| Step | Action | Temperature | Time | Cycles |
| 1 | Polymerase activation | 95 °C | 10 min | 1 |
| 2 | DNA denaturation | 94 °C | 30 sec | 40 |
| 3 | Annealing/exetension | 60 °C | 1 min | |
| 4 | Polymerase deactivation | 98 °C | 10 min | 1 |
| 5 | Hold (optional) | 4 °C |
Table 2 PCR Cycler Settings
Discussion
The key step in this genetic- and cell-based tool for assessing drug specificity in vitro is the determination of proportion of tumor cells using one or more tumor-specific genetic features. In contrast to conventional phenotypic features7, genetic features are specific, stable and easy to quantify. For example, a tumor-specific mutation or copy number variation is present exclusively in the tumor cells but not in non-tumor cells. Such a genetic stigma can be reliably and precisely quantified, for example, using digital PCR as demonstrated in this study.
For digital PCR, high purity of DNA is not essential. However, desalting and removing inhibitory molecules are necessary which can be achieved by a drop-dialysis using a suitable filter. The combined lysis and drop-dialysis is simple and quick, requires no special instruments and therefore can be carried out in any standard laboratory. If the cells do not break well, additional treatment can be considered such as freezing the cells at -20 °C, adding detergent or/and using protease.
In the present study, the heterozygous deletion of the NF1 gene was used as the tumor-specific feature for the quantification. Similarly, deletions of other genes or loci can also be used. Furthermore, mutations can also be used for quantifying tumor cells. In such case, digital PCR assays for the mutant and the normal alleles need to be extensively validated to ensure their specificity for each of them.
Dose-dependent proportion of tumor cells provides an indication for drug-specificity or selectivity. Furthermore, it also enables extracting response of tumor cells from the response of total cells of a mixed culture to a drug (Figure 4). This extraction strategy provides a solution for the technical problem in using primary cultures (which contains both tumor and non-tumor cells) for drug-testing.
The genetic- and cell-based in vitro tool demonstrated in the present study may therefore have application potential (1) in drug-discovery where it provides a platform for assessing drug specificity or selectivity in vitro and (2) in personalized cancer care where it enables testing drugs in primary cultures and consequently may contribute to drug-selection in adjuvant chemotherapy4. Furthermore, pharmacological mechanism of a drug can be studied using this tool, since certain genetic alteration or multiple genetic alterations can be followed during the drug-treatment.
A difficulty in using individualized primary cultures is the lack a universal genetic feature for the quantification of the tumor cells. However, with today's advance in whole-genome sequencing, the most frequently altered genes and regions are known for common tumors. For example, among head and neck tumors, 71%, 23% and 22% have mutations in the TP53, FAT1 and CDKN2A genes, and 60%, 34% and 26% have deletions in the gene regions of CDKN2A, STK11 and PTEN, respectively10. Screening 5 to 10 such genes or/and regions by means of targeted-sequencing or/and digital PCR will therefore likely identify one or more genetic alterations which can be used for the quantification of tumor cells in the derived primary culture. Another limitation is the often insufficient amount of resected tumors for setting up primary cultures.
Despite the advantageous features and promising application potential of the genetic- and cell-based in vitro tool, its limitations should be kept in mind and its in vitro nature should be emphasized. For example, the differential effects or cytotoxicity of a drug on tumor cells may rather due to difference in cell types (fibroblasts vs. Schwann cells) or their different origins (from different individuals). The stronger effect of a drug on tumor cells than on non-tumor cells may also be explained by the fact that the former grow faster than the latter. Most importantly, cells in vitro behavior differs than cells in the human body and consequently, results of in vitro assessment often do not or only partially reflect the real clinical situation. Therefore, efficacy, cytotoxicity and specificity of drugs obtained for cultured cells are rather of biomarker nature but do not have the reliability of preclinically measured efficacy of antibiotics. Nevertheless, moving from cell lines to mixed cultures and/or primary cultures is a step forward in assessing drug-effect and specificity/selectivity in vitro. With extensive efforts, in vitro conditions may be found which enables reasonable correlation of in vitro data with real responses of patients, at least for some drugs.
Divulgaciones
The authors have nothing to disclose.
Acknowledgements
Mrs. Alster, Mr. Honrath and Dr. Jiang are appreciated for their outstanding technical assistance. Also appreciated is Dr. Volz and the research group of Dr. Dandri for providing the access to their digital PCR device.
Materials
| membrane filter of 25 mm diameter | Merk-Millipore | VSWP 02500 | for drop-dialysis |
| ddPCR assay for NF1 | BioRad | dHsaCP1000177 | FAM-labelled |
| ddPCR assay for RPP30 | BioRad | dHsaCP2500350 | HEX-labelled |
| QX200 | BioRad | 186-4001 | the previous version QX was used in the study, which is not available any more. The replacement is QX200 |
| Droplet oil | BioRad | 186-3005 | |
| Cartriges | BioRad | 186-3004 | |
| Gaskets | BioRad | 186-3009 | |
| Cartrige holder | BioRad | 186-3051 | |
| pierceble foil | BioRad | 181-4040 |
Referencias
- Caponigro, G., Sellers, W. R. Advances in the preclinical testing of cancer therapeutic hypotheses. Nat Rev Drug Discov. 10 (3), 179-187 (2011).
- McMillin, D. W., Negri, J. M., Mitsiades, C. S. The role of tumour-stromal interactions in modifying drug response: challenges and opportunities. Nat Rev Drug Discov. 12 (3), 217-228 (2013).
- Wilding, J. L., Bodmer, W. F. Cancer cell lines for drug discovery and development. Cancer Res. 74 (9), 2377-2384 (2014).
- Edwards, A. M., et al. Preclinical target validation using patient-derived cells. Nat Rev Drug Discov. 14 (3), 149-150 (2015).
- Frahm, S., et al. Genetic and phenotypic characterization of tumor cells derived from malignant peripheral nerve sheath tumors of neurofibromatosis type 1 patients. Neurobiol Dis. 16 (1), 85-91 (2004).
- Jiang, W., et al. Efficacy and selectivity of nilotinib on NF1-associated tumors in vitro. J Neurooncol. 116 (2), 231-236 (2014).
- Jiang, W., Mautner, V. F., Friedrich, R. E., Kluwe, L. Preclinical assessment of the anticancer drug response of plexiform neurofibroma tissue using primary cultures. J Clin Neurol. 11 (2), 172-177 (2015).
- Montero-Pau, J., Gomez, A., Munoz, J. Application of an inexpensive and high-throughput genomic DNA extraction method for the molecular ecology of zooplanktonic diapausing eggs. Limnology and Oceanography-Methods. 6, 218-222 (2008).
- Saraswat, M., Grand, R. S., Patrick, W. M. Desalting DNA by drop dialysis increases library size upon transformation. Biosci Biotechnol Biochem. 77 (2), 402-404 (2013).
- Iglesias-Bartolome, R., Martin, D., Gutkind, J. S. Exploiting the head and neck cancer oncogenome: widespread PI3K-mTOR pathway alterations and novel molecular targets. Cancer Discov. 3, 722-725 (2013).

