Quantitative Locomotion Study of Freely Swimming Micro-organisms Using Laser Diffraction
Summary
Microscopic organisms like the free-swimming nematode C. elegans, live and behave in a complex three-dimensional environment. We report on a novel approach that provides analysis of C. elegans using diffraction patterns. This approach consists of tracking the temporal periodicity of diffraction patterns generated by directing laser light through a cuvette.
Abstract
Soil and aquatic microscopic organisms live and behave in a complex three-dimensional environment. Most studies of microscopic organism behavior, in contrast, have been conducted using microscope-based approaches, which limit the movement and behavior to a narrow, nearly two-dimensional focal field.1 We present a novel analytical approach that provides real-time analysis of freely swimming C. elegans in a cuvette without dependence on microscope-based equipment. This approach consists of tracking the temporal periodicity of diffraction patterns generated by directing laser light through the cuvette. We measure oscillation frequencies for freely swimming nematodes.
Analysis of the far-field diffraction patterns reveals clues about the waveforms of the nematodes. Diffraction is the process of light bending around an object. In this case light is diffracted by the organisms. The light waves interfere and can form a diffraction pattern. A far-field, or Fraunhofer, diffraction pattern is formed if the screen-to-object distance is much larger than the diffracting object. In this case, the diffraction pattern can be calculated (modeled) using a Fourier transform.2
C. elegans are free-living soil-dwelling nematodes that navigate in three dimensions. They move both on a solid matrix like soil or agar in a sinusoidal locomotory pattern called crawling and in liquid in a different pattern called swimming.3 The roles played by sensory information provided by mechanosensory, chemosensory, and thermosensory cells that govern plastic changes in locomotory patterns and switches in patterns are only beginning to be elucidated.4 We describe an optical approach to measuring nematode locomotion in three dimensions that does not require a microscope and will enable us to begin to explore the complexities of nematode locomotion under different conditions.
Protocol
1. C. elegans Preparation for Video Analysis
- Move 10-20 gravid adult nematodes to fresh NGM agar-filled Petri plates using a thin, flattened platinum wire pick. The Petri dishes filled with the NGM agar contain a small circular spot of E. coli (a growth limited strain, OP50, gives the best results) for the nematodes to eat. Allow the nematodes to lay eggs for 3-5 hr and then remove the adults, thus establishing a small, developmentally-synchronized culture of 50-150 nematodes. Allow the nematodes to grow to early adulthood by incubating the Petri plates at 20 °C for 4-5 days. These culture methods are based on established procedures (Stiernagle 2006).5
- On the day of the video analysis, flush a plate of young adult nematodes with 1 ml of deionized, distilled water, thus collecting 50-150 worms from the synchronized culture. A buffer solution like M9 or PBS can also be used. Use a microcentrifuge to spin the worms to the bottom of the tube, or allow them to settle by gravity for about 15 min. Remove the majority of the water from the tube and replace it with 1 ml of deionized, distilled water in order to wash any adhering bacteria from the nematodes.
- Transfer nematodes in water or buffer to a quartz cuvette using a micropipette. It is important to work with a small number, about 5-10 nematodes in total at one time or even fewer so that one nematode at a time is likely to be illuminated by the laser. If the number of nematodes on the culture plates is too large, dilute the worms in water or buffer until a desired density is reached. It is also possible to pick individual nematodes to a drop of water or buffer on a fresh agar plate to wash them and transfer individual worms to the cuvette. In our study, we used 1 mm, 2 mm and 5 mm cuvette sizes to examine the effects of physical constraints on swimming behavior.
2. Optical Setup for the Video Analysis
- Perform setup as shown in Figure 1 using a 543 nm (green) Helium-Neon (HeNe) laser, two front-surface aluminum mirrors, a cuvette holder, a projection screen, and a high-speed camera (Casio High Speed Exilim) capable of filming at ~240 fps. The two mirrors are used to steer the laser beam through the cuvette. Different sizes of cuvettes can be used depending on the nature of the study. As an example, we used cuvettes that are 5 mm thick to show the effects of spatial constraints on swimming frequencies. The laser beam must fulfill the requirements for oversampling; i.e., the organism should obstruct no more than one third of the laser beam. For C. elegans, the laser beam should be about 2 mm in diameter when it interacts with a nematode. The laser beam should not be larger than 5 mm in diameter since the diffraction pattern will be difficult to locate. The distance from the diffracting organism to the screen should be much larger than the organism itself.
- Place parafilm over the top of the cuvette and invert it to mix the nematodes into the water column. Place the cuvette in a cuvette holder so that worms are initially near the top of the cuvette. Using the mirrors, steer the laser beam through the center of the cuvette. Because the nematodes are denser than water, they will slowly fall to the bottom of the cuvette, while at the same time swimming within the water column.
- On the projection screen, color the spot corresponding to the transmitted laser beam black to reduce scattering as the transmitted beam meets the projection screen (Figure 2). Alternatively put an opening in the projection screen to allow the transmitted beam to pass through the screen. Eliminating or reducing scattering from the transmitted beam will keep the CCD array of the camera from saturating due to the transmitted beam.
- To capture a measure of the size of the diffraction pattern, draw a line of about 5 cm on the projection screen next to the transmitted laser beam spot without interfering with the diffracted light image.
- Start recording with the camera while the room light is on so that the 5 cm line is on the same footage as the diffraction images. Turn the room light off. Record diffraction images on the screen with the camera as worms pass through the laser beam.
3. Video Data Preparation
- Install video analysis program (Logger Pro: http://www.vernier.com/products/software/lp/) on the computer. Import the video into video analysis program
- Set the origin to coincide with the transmitted laser spot. Set the scale using the 5 cm line on the projection screen.
- Track the angular displacement of the diffraction image formed by each nematode using the video analysis software (Figure 3)
- To find the angular displacement by taking the arctan (y/x), copy and paste data into a spreadsheet (Excel) and add 180 deg or π for all negative angles to produce a continuous graph (Figure. 4).
4. Real Time Data Acquisition for Instant Observation of Swimming Frequencies
- Using the same setup as for the video analysis, place a photodiode (DET10A from ThorLabs) with a small area (~1 mm2) off center in the diffraction pattern right in front of the projection screen.
- Connect the photodiode to the digital oscilloscope (PicoScope made by Pico Technology) that connects to the computer via USB port. Observe the thrashing patterns on the computer screen.
- Save acquired data sets in ASCII or text format.
5. Data Analysis
- Import the data acquired using video or the photodiode into a data analysis program capable of fitting waveforms using chi-square minimization. The program used here is Origin (http://www.originlab.com/). Fit a sinusoidal curve to determine thrashing frequency (Figures 4 and 5).
- Average swimming frequencies from various samples and determine variance. For this study, data were analyzed statistically using a single-factor ANOVA followed by the Bonferroni multiple comparisons test. A p-value of < 0.05 was considered statistically significant.
6. Model Diffraction Patterns using Mathematica as an Example
Note: Diffraction patterns can be modeled using many different computational tools. This procedure will differ for different computational tools such as MatLab, Excel, Origin etc.
- Create Image: Take images of nematodes on a microscope slide using a traditional microscope.
- Binarize image: Import the worm image ‘Worm’ into Mathematica by dragging the image into Mathematica. Convert the image into a black and white image (binarize). This can be achieved with the ‘Binarize’ command in Mathematica: BlackandWhiteImage=Binarize[Worm]. The image can then be viewed as a black and white image.
Alternatively, use the ‘EdgeDetect’ command to create a BlackandWhiteImage: EdgeDetect[Worm,6.0,0.035], where the two trailing numbers control the coarseness of the resulting edges. - Convert image into a matrix of zeroes and ones: This can be achieved with the ‘ImageData’ command in Mathematica: Matrix=ImageData[BlackandWhiteImage].
- Fourier transform matrix: Use the ‘Fourier’ command in Mathematica to Fourier transform the matrix using the indicated FourierParameters: FTransform = Fourier[Matrix, FourierParameters -> {0, -2}].
- Square modulus of matrix to obtain the diffraction matrix and improve image contrast: Square the absolute value of the matrix and view the resultant image, which is the diffraction pattern corresponding to the original image. Also, use the ‘Log’ function to scale the contrast of the image: ImageContrast = Image[Log[1 + (Abs[FTransform])^2]/0.5].
- Resize image for easy viewing: Crop the central diffraction pattern and resize as desired: ImageResize[ImageContrast [y, 100], 500].
- Compare the modeled diffraction patterns with diffraction patterns obtained from freely swimming worms. (Figure 6)
Representative Results
As an example, we studied C. elegans in a quartz cuvette 1 cm wide, 5 mm thick and 4 cm tall cuvette. Sampling a single worm using video analysis, the average swimming frequency obtained from video analysis in a 5 mm thick cuvette is about 2.5 Hz (Figure 4). Similarly, sampling a single worm using the real time data acquisition method, we obtain a swimming frequency of about 2.7 Hz (Figure 5), using the digital oscilloscope (PicoScope).This procedure can be repeated for many worms. A detailed study of freely swimming worms revealed an average swimming frequency of 2.37 Hz in a 5 mm cuvette.6 As expected, the swimming frequency is higher than that for a crawling worm (~.8 Hz).3 Using this diffraction method, the average swimming frequencies of a C. elegans, which is confined to a microscope slide, has been found to match the previously published value of 2 Hz.1,7
Following procedures 3.) and then 6.) allows for the modeling of swimming diffraction patterns with the help of worm images obtained with a conventional microscope. The modeled diffraction patterns are used to simulate a swim cycle of the C. elegans (Figure 6). A successful model consists of physically feasible successive swim patterns matching the swimming frequencies. The worm should be in the same shape at the end of a swim cycle as it was in the beginning of a swim cycle.
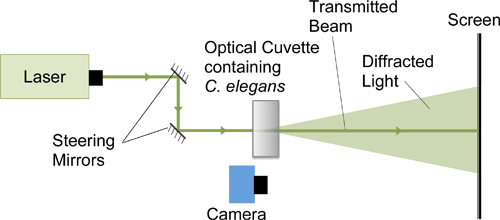
Figure 1. A green HeNe laser was used to create a dynamic diffraction pattern using live C. elegans. This diffraction pattern was filmed at 240 fps.
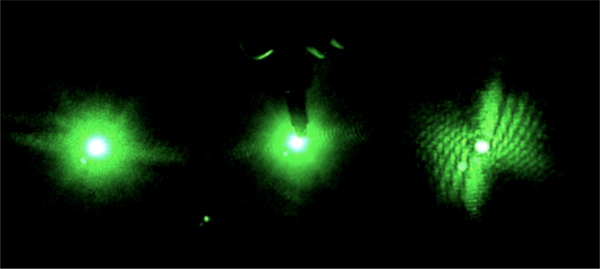
Figure 2. Drawing a black dot increases absorption of the transmitted beam. Saturation of the camera due to scattered light is reduced and the diffraction pattern becomes visible.
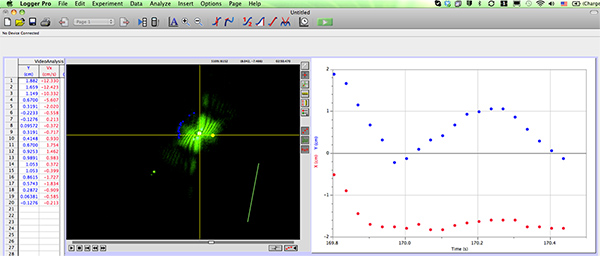
Figure 3. Screen shot of the video analysis software (Logger Pro) with a worm diffraction pattern that is being tracked. Click here to view larger figure.
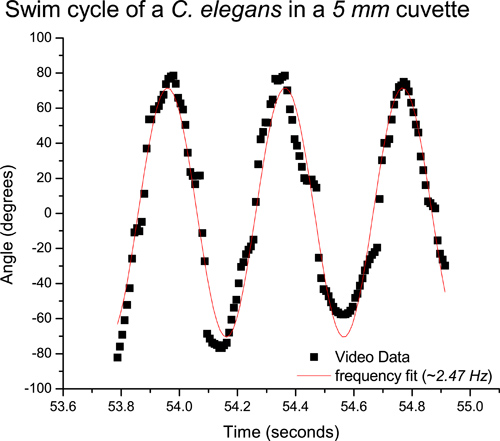
Figure 4. Video data corresponding to the swim cycle of a nematode in a 5 mm cuvette. The curve fit reveals a swimming frequency of ~ 2.5 Hz.
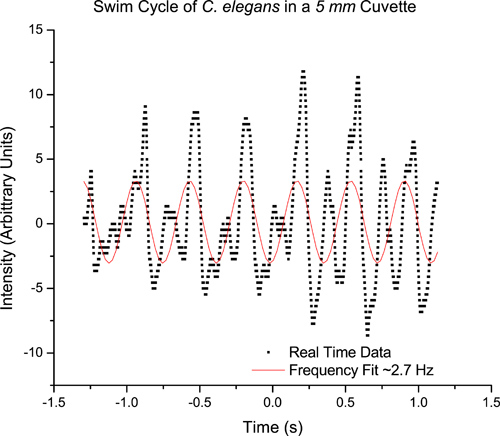
Figure 5. Real time data corresponding to the swim cycle of a nematode in a 5 mm cuvette. The curve fit reveals a swimming frequency of ~ 2.7 Hz.
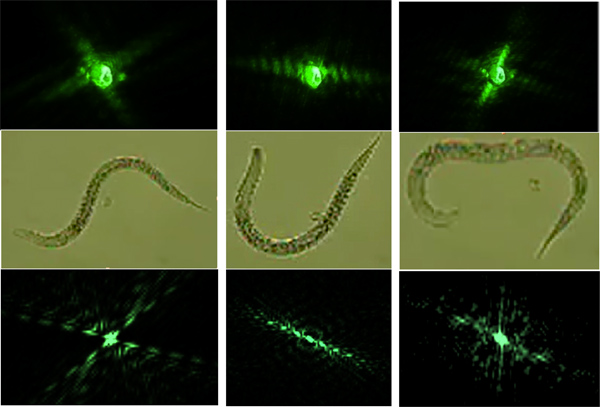
Figure 6. The top row represents the actual diffraction patterns and is matched to the modeled diffraction patterns in the bottom row. The modeled diffraction patterns were produced using worms on a microscope slide (middle row).
Discussion
We have developed a novel approach to the real-time measurement of movement and simple locomotory behaviors in microscopic organisms like nematodes that does not require the use of microscopes.8 This methodological approach could also be utilized for studying numerous microscopic organisms like protists. This method is only limited by the wavelength of light used. The organism should not be smaller than the wavelength of the light. In addition to the cost-savings and portability of the equipment needed, one key advantage of this approach is the ability to measure behavior in real-time and in three dimensions, without the narrow constraints of image planes under a microscope. It is also possible with this technique to examine influences of gravitational forces or numerous other conditions on behavior that cannot be studied using microscope-based approaches.9 Thus, we can achieve a better understanding of microorganism natural locomotory behaviors freed from the confines of microscope slide droplets or specialized microfluidic chambers (Park et al, 2008).10
The lack of phase information in a diffraction pattern does not allow for the direct retrieval of the image corresponding to the diffracting object since the far-field diffraction pattern is proportional to the square of the absolute value of the Fourier transform. We are therefore calculating diffraction patterns from worm images so that they can be matched with the diffraction patterns of freely swimming nematodes (Figure 6).
This method has yielded results for truly freely swimming C. elegans and can be applied to any microscopic species that maneuvers in an optically transparent environment like water or many different ionic solutions. Conventional microscopes only allow studies with a focal depth on the order of micrometers.11 This is due to the limited depth of field when focusing light:

where the f-number N has a reciprocal relationship with the circle of confusion (c) so that a short focal length is associated with a large c.12,13 While this diffraction method is certainly not a replacement for conventional microscopy, it is able to deliver quantitative results quickly so that species can even be manipulated in real time at low cost. The diffraction patterns can be obtained with any laser pointer. The diffraction patterns can be filmed at a reduced temporal resolution using a regular digital camera. While the user may not have a microscope or a photodiode readily available, key parts of this experiment such as measuring thrashing frequencies and evaluating diffraction patterns can be completed at extremely low cost.
Divulgaciones
The authors have nothing to disclose.
Acknowledgements
We thank Tzlil Rozenblat, Alexandra Bello and Karl Spuhler for technical assistance. This work was supported by the Vassar College Undergraduate Research Summer Institute (URSI), Lucy Maynard Salmon Research Fund and the NASA award # NX09AU90A, National Science Foundation Center for Research Excellence in Science and Technology (NSF-CREST) award # 0630388 and the NSF award # 1058385.
Materials
| Name | Company | Catalogue number | Comments (optional) |
| 543 nm HeNe Laser | Melles Griot | LGX1 | Any laser in the visible range with less than 5 mW can be used. |
| 2 Front Surface Aluminum Mirrors | Thorlabs | PF10-03-F01 | |
| High Speed Exilim Camera | Casio | ||
| Quartz Cuvette | Starna Cells | 21/G/5 | |
| LoggerPro (Software) | Vernier | http://www.vernier.com/products/software/lp/ | |
| Mathematica 8 | Wolfram | http://www.wolfram.com/ |
Referencias
- Korta, J., Clark, D. A., Gabel, C. V., Mahadevan, L., Samuel, A. D. T. Mechanosensation and mechanical load modulate the locomotory gait of swimming C. elegans. J. Exp. Biol. 210, (2007).
- James, J. F. . A student’s guide to Fourier transforms with applications in physics and engineering. , (1995).
- Pierce-Shimomura, J. T., Chen, B. L., Mun, J. J., Ho, R., Sarkis, R., McIntire, S. L. Genetic analysis of crawling and swimming locomotory patterns in C. elegans. Proc. Natl. Acad. Sci. USA. 105, 20982-20987 (2008).
- Li, W., Feng, Z., Sternbert, P. W., Xu, X. Z. S. A C. elegans stretch receptor neuron revealed by a mechanosensitive TRP channel homologue. Nature. 440, 684-687 (2006).
- Stiernagle, T., ed, W. o. r. m. B. o. o. k. ,. Maintenance of C. elegans. WormBook. , (2006).
- Eells, R., Lueckheide, M., Magnes, J., Susman, K., Rozenblat, T., Kakhurel, R. Dynamic Diffraction Analysis and the Transformation of C. elegans. , (2011).
- Magnes, J., Raley-Susman, K. M., Melikechi, N., Sampson, A., Eells, R., Bello, A., Lueckheide, M. Analysis of Freely Swimming C. elegans using Laser Diffraction. O. J. Biphys. , (2012).
- Magnes, J., Raley-Susman, K. M., Sampson, A., Eells, R. Locomotive Analysis of C. Elegans through Diffraction, Control number: 348 Session: JTuA – Joint FiO/LS Poster Session I Pres. number: JTuA39. , (2010).
- Kim, N., Dempsey, C. M., Kuan, C. J., Zoval, J., O’Rourke, E., Ruvkun, G., Madou, M. J., Sze, J. Y. Gravity fource transduced by the MEC-4/MEC-10 DEG/EnaC channel modulates DAF-16/FoxO activity in Caenorhabditis elegans. Genética. 177, 835-845 (2007).
- Park, S., Hwang, H., Nam, S. -. W., Martinez, F., Austin, R. H., Ryu, W. S. Enhanced Caenorhabditis elegans locomotion in a structured microfluidic environment. PLOS One. 3, e2550 (2008).
- Keller, H. E., Pawley, J. B. Objective Lenses for Confocal Microscopy. Handbook of Biological Confocal Microscopy. , 145-161 (2006).
- Martin, L. C. . TECHNICAL OPTICS. II, (1950).

