Ultrasound Velocity Measurement in a Liquid Metal Electrode
Summary
Ultrasound velocimetry is used to study mixing by fluid flow in liquid metal electrodes. The focus of this manuscript is to illustrate the methods used for making precise, spatially-resolved ultrasound measurements while limiting oxidation and controlling and monitoring temperature, applied current, and the heater power being supplied.
Abstract
A growing number of electrochemical technologies depend on fluid flow, and often that fluid is opaque. Measuring the flow of an opaque fluid is inherently more difficult than measuring the flow of a transparent fluid, since optical methods are not applicable. Ultrasound can be used to measure the velocity of an opaque fluid, not only at isolated points, but at hundreds or thousands of points arrayed along lines, with good temporal resolution. When applied to a liquid metal electrode, ultrasound velocimetry involves additional challenges: high temperature, chemical activity, and electrical conductivity. Here we describe the experimental apparatus and methods that overcome these challenges and allow the measurement of flow in a liquid metal electrode, as it conducts current, at operating temperature. Temperature is regulated within ±2 °C using a Proportional-Integral-Derivative (PID) controller that powers a custom-built furnace. Chemical activity is managed by choosing vessel materials carefully and enclosing the experimental setup in an argon-filled glovebox. Finally, unintended electrical paths are carefully prevented. An automated system logs control settings and experimental measurements, using hardware trigger signals to synchronize devices. This apparatus and these methods can produce measurements that are impossible with other techniques, and allow optimization and control of electrochemical technologies like liquid metal batteries.
Introduction
Liquid metal batteries are a promising technology for providing large-scale energy storage on worldwide electrical grids1. These batteries offer high energy density, high power density, long cycle life, and low cost, making them ideal for grid-scale energy storage3. Introducing liquid metal batteries to the energy grid would allow peak shaving, improve grid stability, and enable much more widespread use of intermittent renewable sources like solar, wind, and tidal power. Liquid metal batteries are composed of two liquid metal electrodes separated by a molten salt electrolyte, as described in greater detail in prior work1. Though many different combinations of metals and electrolyte can result in a working liquid metal battery, the principles of operation remain the same. The metals are chosen such that it is energetically favorable for them to form an alloy; thus alloying discharges the battery, and de-alloying charges it. The salt layer is chosen so that it allows metal ions to pass between the two electrodes, but blocks transport of neutral species, thereby affording electrochemical control of the system.
This work will advance liquid metal battery technology by quantifying and controlling mass transport effects. The methods described here are informed by electrochemical methods developed for liquid metal batteries by Sadoway et al.1–4 as well as earlier liquid metal battery work at Argonne National Laboratory5,6, and the work of the broader electrochemical community (Bard and Faulkner7 provide many relevant references). The methods described here also build upon prior fluid dynamics studies. Ultrasound velocimetry was developed and first used in water8,9 and has since been applied to liquid metals including gallium10,11, sodium12,13, mercury14, lead-bismuth15, copper-tin15, and lead-lithium16, among others. Eckert et al. provide a useful review of velocimetry in liquid metals17.
Recent work using methods similar to the ones described here18 has shown that battery currents can enhance mass transport in liquid metal electrodes. Because mass transport in the positive electrode is the rate-limiting step in charge and discharge of liquid metal batteries, mixing therefore allows faster charge and discharge than would otherwise be possible. Moreover mixing prevents local inhomogeneities in the electrode, which can form solids that limit the cycle life of a battery. In ongoing work, we continue to study the role of fluid flow in the positive electrode of the liquid metal battery, which arises because of thermal and electromagnetic forces. Thermal gradients drive convective flow through buoyancy, and battery currents drive flow by interacting with the magnetic fields induced by the battery currents themselves. In experiments using the methods described below, we have observed flows with Reynolds number 50 < Re < 200, calculated from the electrode depth and root-mean-square velocity. A thorough experimental characterization is being undertaken and will use the resulting data set to build predictive battery models. The focus of this manuscript is on the experimental design and procedures required to produce such data. Ultrasound velocimetry provides the bulk of the measurements, and experimental conditions must be carefully controlled in order to use ultrasound successfully in liquid metal. High temperature, chemical activity, and electrical conductivity must all be managed carefully.
First, liquid metal batteries necessarily operate at high temperature, because both metals and the salt that separates them must be molten. One promising choice of materials, which uses lithium as the negative electrode, lead-antimony as the positive electrode, and a eutectic mix of lithium salts as the electrolyte, requires temperatures around 550 °C. Measuring the flow of an opaque fluid at such high temperatures is quite difficult. High-temperature ultrasound transducers, which separate the delicate electro-acoustic components from the test fluid with an acoustic waveguide, have been demonstrated15 and commercialized. However, because the transducers have insertion loss near 40 dB, and because of the general difficulty of working at such temperatures, a surrogate system has been chosen for initial study: a liquid metal battery may also be made using sodium as the negative electrode, eutectic 44% lead 56% bismuth (hereafter, ePbBi) as the positive electrode, and a triple eutectic mix of sodium salts (10% sodium iodide, 38% sodium hydroxide, 52% sodium amide) as the electrolyte. Such a battery is entirely molten above 127 °C, making it much more amenable to laboratory study. Because it is composed of three liquid layers separated by density, it is subject to the same physics as other liquid metal batteries. And it is compatible with readily available ultrasound transducers, which are rated to 230 °C, involve no waveguide losses, and cost much less than high-temperature transducers. These experiments typically take place at 150 °C. At that temperature, ePbBi has viscosity ν = 2.79 x 10⁻⁷ m2/sec, thermal diffusivity κ = 6.15 x 10⁻⁶ m2/sec, and magnetic diffusivity η = 0.8591 m2/sec, such that its Prandtl number is Pr = ν/κ = 4.53 x 10⁻² and its magnetic Prandtl number is Pm = ν/η = 3.24 x 10⁻⁷.
Though this low-temperature liquid metal battery chemistry makes flow studies much easier than they would be in hotter batteries, temperature must nonetheless be managed carefully. Being delicate electro-acoustic devices, ultrasound transducers are susceptible to damage by thermal shock, and therefore must be heated gradually. High-quality ultrasound measurements also require careful temperature regulation. Ultrasound velocimetry works like sonar, as shown in Figure 1: the transducer emits a beep (here, the frequency is 8 MHz), then listens for echoes. By measuring the time of flight of the echo, the distance to the echoing body can be calculated, and by measuring the Doppler shift of the echo, one component of the body’s velocity can also be calculated. In water, tracer particles must be added to produce echoes, but no tracer particles are required in liquid metals, a fact that is not understood in detail but is typically attributed to the presence of small metal oxide particles. Each measurement is an average over all tracer particles in an interrogation volume; in this work, its minimum diameter is 2 mm, at a distance 30 mm from the probe. Though oxidation may eventually limit the duration of experiments, using the methods described below, we have made measurements continuously for as long as 8 hr.
Calculating either distance or velocity requires knowing the speed of sound in the test fluid, and that speed varies with temperature. The work described here focuses on flow in the ePbBi negative electrode, where the speed of sound is 1,766 m/sec at 150 °C, 1,765 m/sec at 160 °C, and 1,767 m/sec at 140 °C 19. Thus inadequate temperature control would introduce systematic errors in the ultrasound measurements. A device was constructed to measure the speed of sound in ePbBi, finding values consistent with those published and accepted by the Nuclear Energy Agency19 (see below). Finally, since thermal convection is a primary driver of flow in liquid metal batteries, both the mean temperature and the temperature difference between the top and bottom of the ePbBi electrode directly affect observations. For consistent results, precise thermal control is essential.
Accordingly, temperature is measured continually with at least three K-type thermocouples, logging their measurements electronically with a computer-based acquisition device and a custom-written LabView program. The program also controls the power supply that provides battery current, via a USB connection; logs the battery current and voltage; and sends trigger pulses to the ultrasound instrument, so that its data can be synchronized with the other measurements. A system diagram is shown in Figure 2. Heat is provided by a custom-built furnace (also shown in Figure 2), which contains two 500-W industrial heating elements powered by a relay switched by a proportional-integral-differential (PID) controller. The base plate that supports battery cells is made of solid aluminum; because its thermal conductivity is an order of magnitude higher than the thermal conductivity of the stainless steel battery cell vessel and the ePbBi it contains19, the temperature of the furnace floor is approximately uniform. Moreover the aluminum base doubles as a path for the electrical currents passing through the electrode. Its electrical conductivity is also an order of magnitude higher than that of stainless steel or ePbBi, so the voltage of the furnace floor is also approximately uniform. Insulating legs separate the base from the bench top below, preventing burns and shorts. The sides of the battery vessel are insulated with silica ceramic insulation, cut to fit the vessel closely but leave room for accessing the cell’s ultrasound port. Finally, a polytetrafluoroethylene (PTFE) lid insulates the cell from above and holds the negative current collector and thermocouples in place. Though commercially-available hot plates can achieve the temperatures required for these experiments, our custom-built furnace maintains temperature with an order of magnitude less variation, and also allows us to measure heat power directly.
In addition to challenges associated with temperature, there are challenges associated with chemical activity. At 150 °C, an ePbBi positive electrode is chemically compatible with many common materials. A sodium negative electrode, however, corrodes many materials, oxidizes readily, and reacts vigorously with moisture. A lithium negative electrode is also aggressive, especially because lithium-based liquid metal batteries typically run at much higher temperatures. Though those higher-temperature systems are outside the scope of this work, many of the same measures for managing chemical activity are used here as in those systems. All experiments described here take place in an argon-filled glovebox containing only trace amounts of oxygen or moisture. The battery vessel is made from alloy 304 stainless steel, which corrodes minimally even with lithium at 550 °C. The thermocouples and negative current collector are also made from stainless steel. The vessel geometry is chosen to match vessels used for electrochemical testing of liquid metal batteries, to model as closely as possible the systems that are being commercialized. The vessel, shown in Figure 2, is cylindrical, with an 88.9 mm inner diameter and a 67 mm depth. All vessel walls are 6.4 mm thick. The vessel differs from those used for earlier experiments, however, in that it has an ultrasound port. The port passes through the side wall along a horizontal diameter of the cylinder, and the center of the port is 6.6 mm above the vessel floor. The port is 8 mm in diameter to accommodate an 8 mm ultrasound transducer, and seals around the transducer with a swage. In these experiments, the liquid metal electrode is just deep enough to cover the ultrasound transducer, typically 13 mm.
In order to achieve strong ultrasound signals, one requires good acoustic transmission between the ultrasound transducer and the fluid it probes (ePbBi). Maximum acoustic power is transmitted when the acoustic impedance of the transducer material and the test fluid are identical; when the impedances differ, signals suffer. Placing an ultrasound transducer in direct contact with clean ePbBi (as made possible by the port described above) provides ample signal, often for hours at a time. Metal oxides, however, have very different impedance, and may also interfere with wetting by altering the surface tension. If the ePbBi is substantially oxidized, ultrasound signals degrade and soon disappear. Again, an inert atmosphere is essential. If trace amounts of oxygen cause some oxidation nonetheless, the surface of the metal oxide is skimmed before transferring ePbBi into the battery vessel.
Finally, these experiments present challenges because of the presence of electrical currents. Though the currents are our central scientific and technological interest, they are large enough (30 A) to cause damage if incorrectly routed. Ungrounded thermocouples ensure that harmful electrical currents do not pass through the data acquisition device or the computer that supports it, because ungrounded thermocouples have no internal electrical connection from the protective sheath to either signal wire. Likewise it is essential to use ungrounded ultrasound transducers (Signal-Processing SA, TR0805LTH) to prevent stray current from damaging the valuable ultrasound instrument (Signal-Processing SA, DOP 3010). As mentioned previously, the base of the furnace serves to conduct electrical current, and must also be electrically isolated from its surroundings.
In the ePbBi electrode, current causes ohmic heating, potentially disrupting the temperature. Thus the automated thermal control system must be able to adjust to changes in heat input. Figure 3 shows how the temperature of the ePbBi electrode varies as current flows through it, and how the PID controller adjusts to compensate. Maintaining steady temperature with large currents (50 A = 800 mA/cm) would require additional cooling, but at the lower currents more realistic for liquid metal batteries in industrial applications (typically 17 A = 275 mA/cm 1), the controller is able to compensate for ohmic heating and hold temperature variation to 2 °C.
Protocol
1. System Setup and Assembly
- Clean the ultrasound transducer with isopropanol.
- Load the glovebox.
- Load required equipment and materials (including ultrasound transducer, ePbBi, stir stick, and thermocouples) into the glovebox, following the instructions of the glovebox manufacturer to minimize ingress of oxygen and moisture.
- Keep porous materials under vacuum in the glovebox antechamber for 12 hr before entering the glovebox.
- Tune the PID controller (first time only).
- Place the same quantity of solid ePbBi into the battery vessel that will be used in experiments (840 g).
- Place the furnace insulation around the battery vessel if it is not already there, and place the lid atop the battery vessel, along with the negative current collector and thermocouples.
- Make all electrical connections for thermocouples and furnace power, as shown in Figure 2B.
- Initiate automatic tuning of the PID controller, using 150 °C as the set point. Note: the details of this step will differ, depending on the PID controller manufacturer and model. The controller used here auto-tunes by controlling four full thermal cycles, from RT to operating temperature, over a course of hours.
- Use the arrow keys to adjust the set point (shown by default after tuning the controller) to 150 °C.
- Press and hold the loop button for 3 sec to enter the hidden loop. Then press the loop button repeatedly until the controller screen shows “tUnE”. Use the arrow keys to change it to YES.
- Insert a thermocouple and use the workstation to monitor and log temperature.
- Once auto-tune is complete, record the Proportional, Integral, and Derivative parameters that the PID controller has automatically selected by using the controller interface, according to the manufacturer’s instructions.
2. Sound Speed Measurement
- Use the furnace to melt enough ePbBi for the experiment, at least 400 g. Note: required amount will vary for different equipment, and ePbBi melts at 125 °C.
- If necessary, remove excess oxide by skimming it from the top surface of the ePbBi using a stir stick.
- Insert an ultrasound transducer into the sound speed measurement device and tighten the swage connection to prevent leaks, then insert a thermocouple and use the workstation to monitor and log temperature.
- Transfer molten metal to the sound speed measurement device.
- Place the sound speed measurement device on the furnace base and leave it there for 2 min to gradually increase the temperature and avoid thermal shock.
- Prepare for a safe transfer by removing heat-sensitive equipment or materials from the area.
- Add small amounts of molten metal at a time, because thermal shock can damage the ultrasound transducer. Add ePbBi until the transducer face and micrometer head are both completely submerged.
- Wait until the temperature remains stable within 1 °C for at least 5 min before beginning measurements, since sound speed depends on temperature.
- Measure ultrasound echoes at two locations.
- Set the micrometer tip to an arbitrary but known location. Record ultrasound echo measurements, following the instructions provided by the instrument manufacturer.
- Using the micrometer dial, move the micrometer tip by a known distance. Record ultrasound echo measurements.
- Remove the molten metal from the sound speed measurement device and store it in a heat-tolerant container.
- To determine sound speed, plot echo amplitude as a function of echo time for each of the two measurements. Locate the echoes by fitting a Gaussian curve to each echo peak, as in Figure 4. Calculate sound speed by dividing displacement distance by the difference in echo peak times.
3. Ultrasound Velocity Measurement
- Melt enough ePbBi for the experiment (840 g), removing excess oxide if necessary. Note: For best results, use the same quantity of ePbBi that was used to tune the PID controller.
- Insert an ultrasound transducer into the battery vessel and tighten the swage connection to prevent leaks, ensuring that the furnace base is level.
- Transfer molten metal to the battery vessel.
- Place battery vessel on furnace base and leave it there for 5 min to gradually increase the temperature and avoid thermal shock. Prepare for a safe transfer by removing heat-sensitive equipment or materials from the area.
- Add small amounts of molten metal at a time, because thermal shock can damage the ultrasound transducer.
- Wait until the temperature reaches 150 °C before beginning measurements, since sound speed depends on temperature.
- Finish assembling the apparatus.
- Place the furnace insulation around the battery vessel if it is not already there. Place the lid atop the battery vessel, along with the negative current collector and thermocouples. Be sure that all are positioned precisely and repeatably; shaft collars work well for this.
- Make all electrical connections for both power and signals, as shown in Figure 2B. Use an ohmmeter to verify that no unintended electrical paths are present, i.e., check that the electrical resistance between the negative current collector and all signal leads is at least 1 MΩ.
- Begin making measurements.
- Begin logging and monitoring temperature, heater power, battery voltage, and battery current. Note: Here, a workstation running custom LabView code was used to log all measurements, with corresponding timestamps.
- Adjust the ultrasound instrument settings as necessary.
- Be sure to set the sound speed, using the appropriate temperature, according to an accepted model19. For ePbBi at 150 °C as used below, set the speed to 1,760 m/sec.
- Adjust the pulse repetition frequency such that echo depths are closely spaced (typically 0.25 mm).
- Adjust the gate count such that the strong echo from the far wall of the vessel appears in the last few gates; it provides a useful sanity check for troubleshooting signal strength issues.
- Using instructions provided by the manufacturer, set the instrument for hardware triggering.
- Begin logging and monitoring velocity with the ultrasound instrument by initiating triggering from the workstation. Record four velocity profiles per second for 30 min.
- Set the battery current to 5 A, wait 5 min for the flow to stabilize, and then record four velocity profiles per second for 30 min.
- Repeat step 3.5 for 10 A, 15 A, 20 A, 25 A, and 30 A.
Note: Many other experimental plans are also possible, including temperature variations and smooth changes in current. An atmosphere low in oxygen and moisture allows experiments with good signal quality for hours or more. - Once the experiments are complete, stop logging data and turn off the furnace. Disconnect electrical connections and remove the furnace lid. Remove the molten metal from the battery vessel, using the same procedures for safe transfer that were used when filling the vessel. Store the molten ePbBi in a heat-tolerant container. Add extra argon to the glovebox; its pressure will drop as its atmosphere cools.
Representative Results
The procedure for measuring sound speed (described in detail above) was adapted from methods used by Signal-Processing SA. In principle, sound speed can easily be obtained by measuring the time of flight of an echo from a wall at known range. But precisely measuring the effective location of the transducer face is difficult, so instead one can measure time of flight twice, using a micrometer to displace the wall by a known distance between measurements. That displacement distance, and the difference in the measured time of flight, together yield sound speed. The apparatus used for measuring sound speed in these experiments is shown in Figure 4A. A measurement of sound speed in ePbBi is shown in Figure 4B. Each curve showing measured echo is an average over 98 profiles spanning 7.4 sec. Each echo peak is fit to a Gaussian curve (shown), which makes use of many data points and therefore locates the echoing wall much more precisely than finding a single maximum. Knowing the echo times, and knowing that the echoing wall was displaced 2.54 mm between measurements, the calculated sound speed is 1,793 m/sec at 138 °C, in reasonable agreement with the value accepted by the Nuclear Energy Agency19, which is 1,768 m/sec. In the measurements below, NEA sound speed was used.
One ultrasound velocity trace, recorded without current in the electrode, is shown in Figure 5A. Here the spatial coordinate system has its origin at the center of the battery vessel, and the transducer on the negative side of the origin, such that positive velocities signify flow away from the transducer, and negative velocities signify flow toward the transducer. Though ultrasound measurements along one diameter do not give us knowledge of the flow everywhere, the measurements are consistent with a collection of convection rolls, as sketched in Figure 5C.
By representing positive velocities in shades of red and negative velocities in shades of blue, time can be plotted on the vertical axis, to make space-time plots of the sort shown in Figure 6A, which convey temporal variation of the flow. Here again, the current is zero. As is evident from the various shapes of red and blue regions, this flow is disordered and aperiodic, consistent with what is expected from turbulent convection. The mean flow is plotted in Figure 6B, and one standard deviation is also indicated.
Finally, Figure 7 shows ultrasound velocity measurements with current running through the electrode (in this case, 125 mA/cm). As described in more detail elsewhere18, convection cells tend to align with the magnetic field lines produced by electrical current, organizing the flow. Increased organization is apparent when Figure 7A is compared to Figure 6A, and the fact that the flow is steadier can be quantified by the standard deviation over time, which is smaller with current than without it. Increased organization in the presence of a magnetic field is consistent with prior observations in liquid metal convection experiments20–22 and theoretical predictions23.
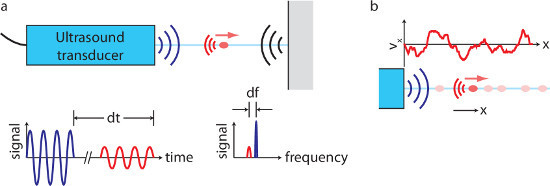
Figure 1. Ultrasound velocimetry overview. (A) An ultrasound transducer produces a beep and listens for echoes. If a moving particle (red) makes an echo, the echo time of flight dt reveals the particle's position, and the Doppler shift df reveals one component of its velocity. (B), When many particles are present, one transducer can measure one component of velocity at many locations along a line. (Not to scale.) Please click here to view a larger version of this figure.
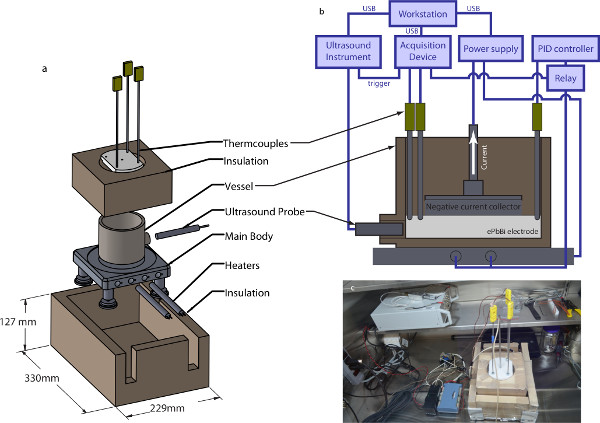
Figure 2. Experimental setup. (A) The furnace assembly. An aluminum plate supports the stainless steel battery vessel and maintains a uniform temperature (aluminum is a much better conductor than stainless steel). The battery vessel is surrounded by silica ceramic insulation for thermal stability; additional silica ceramic insulation encases the entire furnace assembly. The vessel top is covered by a PTFE lid which supports thermocouples as well as the negative current collector (not shown), without making an electrical connection to the vessel, which is also the positive current collector. For the experiments described here, the furnace is powered with two resistive heaters, each 500 W. The design allows for two additional heaters to be included if desired. (B) Vessel cross-section. The vessel contains a thin layer of molten ePbBi, which contacts the negative current collector. Thermocouples also make contact with the ePbBi. A PID controller maintains system temperature, and a workstation controls battery current, ultrasound measurements, and data acquisition. (C) Glovebox setup. Experiments take place in an Argon-filled glovebox. The assembled furnace is visible just right of center, along with the computer-based acquisition device and heater controller. The ultrasound instrument rests on the shelf above. (Here no transducer is connected.) Please click here to view a larger version of this figure.
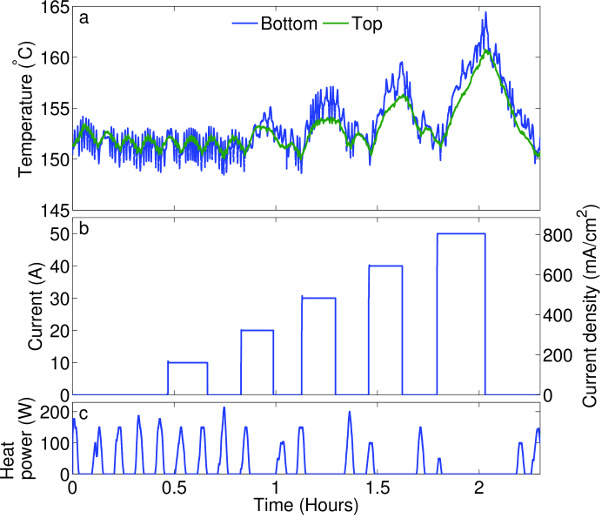
Figure 3. Temperature regulation. (A) Temperature at the top and bottom of the ePbBi electrode during an experiment. Temperature regulation is demonstrated by heating the electrode, then applying a series of current pulses (B). The furnace controller responded by modulating heat power (C). At current densities typical of battery operation (up to 400 mA/cm2), temperature is stable within about 3 °C. Please click here to view a larger version of this figure.
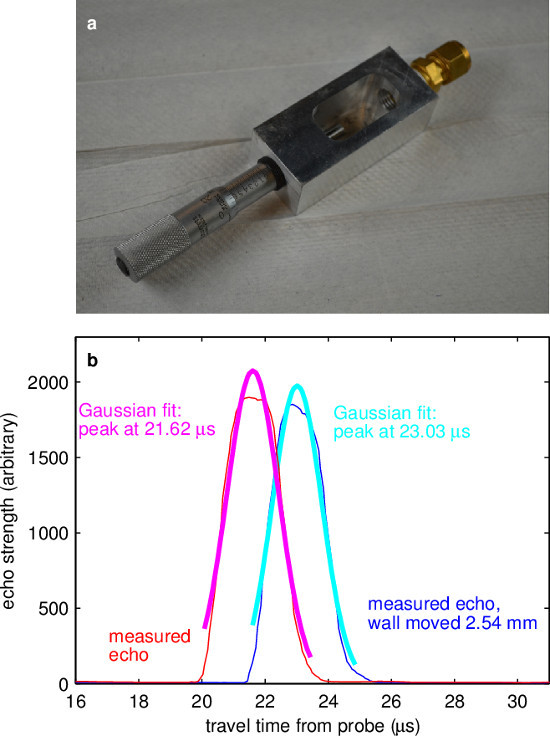
Figure 4. Sound speed measurement. (A) The vessel for measuring sound speed was built with an ultrasound port (right) facing a micrometer head (left) which causes high-amplitude echoes and can be positioned with high precision. (B) Two measured echo profiles, each with a least-squares best fit to a Gaussian curve. Using the centers of the Gaussian fits as the travel times, and knowing that the wall was moved 2.54 cm between measurements, it is found that the speed of sound is 1,793 m/sec at 138 °C. Please click here to view a larger version of this figure.
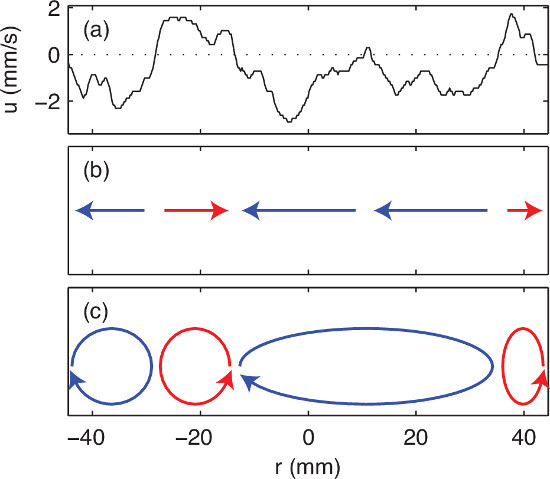
Figure 5. An ultrasound velocity trace and its interpretation. (A) In a single trace, the ultrasound instrument measures velocity at many locations (in this case, 440) along the line of sight of the transducer. Here the location r is measured from the center of the cup, the transducer is located at left, and velocity u<0 signifies flow toward the transducer, whereas u>0 signifies flow away from the transducer. (B) A sketch of regions of flow toward and away from the transducer. (C) A sketch of one flow pattern consistent with these measurements. The transducer is located in the bottom half of the electrode. Please click here to view a larger version of this figure.
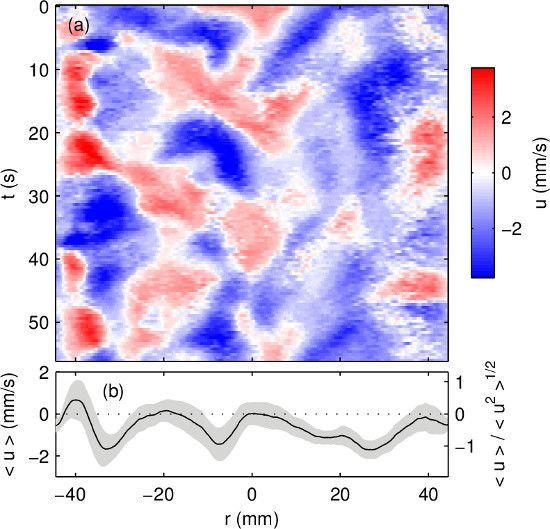
Figure 6. Ultrasound velocity measurements of a liquid metal electrode driven by thermal convection, without electrical current. (A) Radial speed u varies in both space and time, with speed indicated in color. Here r is the radial coordinate and t is time. (B) The mean flow (plotted in black) and one standard deviation around it (gray) shows similar features to Figure 5.
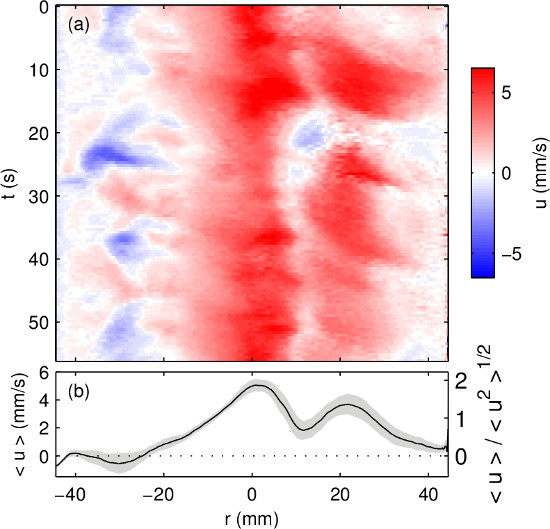
Figure 7. Ultrasound velocity measurements of a liquid metal electrode driven by thermal convection, and electrical current density 125 mA/cm. (A) Radial speed u varies in both space and time, with speed indicated in color. Here r is the radial coordinate and t is time. (B) The mean flow (plotted in black) and one standard deviation around it (gray) shows a faster flow with less variation in time than in the absence of current (Figure 6). Please click here to view a larger version of this figure.
Discussion
Ultrasound techniques can produce velocity measurements at hundreds or thousands of locations in a transparent or opaque fluid, many times per second. Applied to a liquid metal electrode, ultrasound techniques encounter challenges of high temperature, chemical activity, and electrical conductivity. The methods for overcoming those challenges and measuring flow in active liquid metal electrodes have been described. First, an electrode material subject to the same physics as high-temperature liquid metal battery electrodes (550 °C) but operational at much lower temperatures (150 °C), eases challenges related to temperature. A custom-built furnace and tuned control system was used to hold the electrode temperature steady within 2 °C. To mitigate undesired chemical activity, all experiments take place in an argon-filled glovebox and choose chemically inert materials for system components (often stainless steel). For optimum ultrasound response, transducers are placed in direct contact with the liquid metal test fluid. And electrical currents are routed carefully to avoid ground loops that could damage valuable instruments.
Ultrasound velocimetry has limitations in liquid metals. Standard probes are not rated for temperatures above 250 °C, excluding their use in many metal melts. Ultrasound velocimetry does not produce data sets as rich as those available using optical techniques like particle tracking24,25, and single-transducer ultrasound techniques of the sort described here measure only one component of the velocity, and only along one line. Features smaller than the ultrasound wavelength (209 µm in ePbBi at 150 °C with 8 MHz emissions) cannot be resolved. For ultrasound measurements in large systems, signal attenuation is a challenge; in ePbBi with 8 MHz emissions, difficulties are expected for distances greater than 300 mm. Reducing the frequency reduces attenuation, but at the cost of a corresponding reduction in resolution. Large systems also require lower sampling rates, since the time of flight across the system is greater. And the apparatus described here is unable to maintain 150 °C with currents of 40 A or more.
The present methods can be expanded substantially in the future. Incorporating additional ultrasound transducers into the battery cell would allow for measuring velocity at more locations and/or measuring more than one component of the velocity. Additional thermocouples could give more detailed information about spatial variations of temperature. Though direct contact between the ultrasound transducer and the test fluid yields strong signals, careful acoustic design might allow passing ultrasound through the vessel wall, reducing the opportunity for thermal or chemical damage to the transducer. A wall between the transducer and test fluid might also be treated or conditioned to reduce the adverse effects of oxide in the test fluid. The present methods can also be applied broadly to applications like casting and industrial metals processing. Finally, we intend to expand our work into velocity measurements of active three-layer liquid metal batteries as they charge and discharge.
Offenlegungen
The authors have nothing to disclose.
Acknowledgements
We are grateful for the design and fabrication assistance of D. De La Cruz, for equipment borrowed from M. Zahn, and for insightful discussions with D. R. Sadoway and the talented electrochemists of his group.
Materials
| K Type Thermocouple Probe | McMaster-Carr | 3856K83 | http://www.mcmaster.com/ |
| Red Lion PID Controller | Red Lion | P1610000 | http://store.redlion.net/store/p16.html |
| Measurement Computing Data Acquisition Device | Measurement Computing Corporation | USB-2408 | http://www.mccdaq.com/index.aspx |
| Power Supply | TDK-Lambda | GEN 8-90-USB-U | http://us.tdk-lambda.com/hp/ |
| Ultrasound Instrument | Signal Processing SA | DOP3010 | http://www.signal-processing.com/index.html |
| Ultrasound Transducer | Signal Processing SA | TR0805LTH | http://www.signal-processing.com/index.html |
| Bismuth-Lead Eutectic | VWR | AA40949-P2 | https://us.vwr.com/ |
Referenzen
- Kim, H., et al. Liquid metal batteries: Past, present, and future. Chem. Rev. 113 (3), 2075-2099 (2013).
- Bradwell, D. J., Kim, H., Sirk, A. H. C., Sadoway, D. R. Magnesium-antimony liquid metal battery for stationary energy storage. J. Am. Chem. Soc. 134, 1895-1897 (2012).
- Kim, H., et al. Thermodynamic properties of calcium–bismuth alloys determined by emf measurements. Electrochim. Acta. 60, 154-162 (2012).
- Kim, H., Boysen, D. A., Ouchi, T., Sadoway, D. R. Calcium–bismuth electrodes for large-scale energy storage (liquid metal batteries). J. Power Sources. 241, 239-248 (2013).
- Cairns, E. J., Crouthamel, C. E., Foster, A. K., Foster, M. S., Hesson, J. C. Galvanic cells with fused salts. Technical Report ANL-7316. , (1967).
- Cairns, E. J., Shimotake, H. High-temperature batteries. Science. 164 (3886), 1347-1355 (1969).
- Bard, A., Faulkner, L. . Electrochemical methods: Fundamentals and applications. , (2001).
- Takeda, Y. Development of an ultrasound velocity profile monitor. Nucl. Eng. Des. 126 (2), 277-284 (1991).
- Takeda, Y. Velocity profile measurement by ultrasonic Doppler method. Exp. Therm. Fluid Sci. 10 (4), 444-453 (1995).
- Brito, D., Nataf, H. -. C., Cardin, P., Aubert, J., Masson, J. -. P. Ultrasonic Doppler velocimetry in liquid gallium. Exp. Fluids. 31, 653-663 (2001).
- Yanagisawa, T., Yamagishi, Y., Takeda, Y. Structure of large-scale flows and their oscillation in the thermal convection of liquid gallium. Phys. Rev. E. 82, 016320 (2010).
- Eckert, S., Gerbeth, G. Velocity measurements in liquid sodium by means of ultrasound Doppler velocimetry. Exp. Fluids. 32 (5), 542-546 (2002).
- Brawn, B. E., Joshi, K., Lathrop, D. P., Mujica, N., Sisan, D. R. Visualizing the invisible: Ultrasound velocimetry in liquid sodium. Chaos. 15, 041104 (2005).
- Takeda, Y., Kikura, H. Flow mapping of the mercury flow. Exp. Fluids. 32 (2), 161-169 (2002).
- Eckert, S., Gerbeth, G., Melnikov, V. I. Velocity measurements at high temperatures by ultrasound Doppler velocimetry using an acoustic wave guide. Exp. Fluids. 35, 381-388 (2003).
- Ueki, Y., Yao, T., et al. High-temperature ultrasonic Doppler velocimetry for lead-lithium flows. Zero-Carbon Energy Kyoto 2011, Green Energy and Technology. , 267-272 (2012).
- Eckert, S., Cramer, A., Gerbeth, G. Velocity measurement techniques for liquid metal flows. Magnetohydrodynamics. , 275-294 (2007).
- Kelley, D. H., Sadoway, D. R. Mixing in a liquid metal electrode. Phys. Fluids. 26 (5), (2005).
- NEA. . Handbook on lead-bismuth eutectic alloy and lead properties, materials compatibility, thermal-hydraulics, and technologies. , (2007).
- Fauve, S., Laroche, C., Libchaber, A. Effect of a horizontal magnetic field on convective instabilities in mercury. J. Physique Lett. 42 (21), 455-457 (1981).
- Cioni, S., Ciliberto, S., Sommeria, J. Strongly turbulent Rayleigh-Bénard convection in mercury: Comparison with results at moderate Prandtl number. J. Fluid Mech. 335, 111-140 (1997).
- Burr, U., Müller, U. Rayleigh-Bénard convection in liquid metal layers under the influence of a horizontal magnetic field. J. Fluid Mech. 453, 345-369 (1997).
- Bojarevičs, V., Freibergs, Y., Shilova, E. I., Shcherbinin, E. V. . Electrically induced vortical flows. , (1989).
- Ouellette, N. T., Xu, H., Bodenschatz, E. A quantitative study of three-dimensional Lagrangian particle tracking algorithms. Am. Exp. Fluids. 40, 301-313 (2006).
- Kelley, D. H., & Ouellette, N. T. Using particle tracking to measure flow instabilities in an undergraduate laboratory experiment. Am. J. Phys. 79, 267-273 (2011).

