Culture of Small Colony Variant of Pseudomonas aeruginosa and Quantitation of its Alginate
Summary
Here, we describe a growth condition to culture the small colony variant of Pseudomonas aeruginosa. We also describe two separate methods for the detection and quantitation of the exopolysaccharide alginate produced by P. aeruginosa using a traditional uronic acid carbazole assay and an alginate-specific monoclonal antibody (mAb) based ELISA.
Abstract
Pseudomonas aeruginosa, an opportunistic Gram-negative bacterial pathogen, can overproduce an exopolysaccharide alginate resulting in a unique phenotype called mucoidy. Alginate is linked to chronic lung infections resulting in poor prognosis in patients with cystic fibrosis (CF). Understanding the pathways that regulate the production of alginate can aid in the development of novel therapeutic strategies targeting the alginate formation. Another disease-related phenotype is the small colony variant (SCV). SCV is due to the slow growth of bacteria and often associated with increased resistance to antimicrobials. In this paper, we first show a method of culturing a genetically defined form of P. aeruginosa SCV due to pyrimidine biosynthesis mutations. Supplementation of nitrogenous bases, uracil or cytosine, returns the normal growth to these mutants, demonstrating the presence of a salvage pathway that scavenges free bases from the environment. Next, we discuss two methods for the measurement of bacterial alginate. The first method relies on the hydrolysis of the polysaccharide to its uronic acid monomer followed by derivatization with a chromogenic reagent, carbazole, while the second method uses an ELISA based on a commercially available, alginate-specific mAb. Both methods require a standard curve for quantitation. We also show that the immunological method is specific for alginate quantification and may be used for the measurement of alginate in the clinical specimens.
Introduction
Chronic lung infections with Pseudomonas aeruginosa are a major cause of morbidity and mortality in patients with cystic fibrosis (CF). During early childhood, patients are colonized by multiple bacterial pathogens including nonmucoid isolates of P. aeruginosa1,2. Emergence of the small colony variant (SCV) isolates as well as mucoid isolates is a marker for the onset to chronic infections. SCV isolates are highly drug resistant3 due to their slow growth rates4, which renders them a severe deterrent in the treatment regiments and other chronic infections5 by P. aeruginosa. Work by Al Ahmar et al.6 showed a link between SCV and mucoidy linked by de novo pyrimidine biosynthesis. Pyrimidine starvation, due to mutations in genes involved with pyrimidine production, resulted in SCV phenotype in the nonmucoid reference strain PAO1 and the mucoid derivative, PAO581 (PAO1mucA25).
Even though alginate overproduction is an important disease marker for chronic lung infections in CF, it is not clear whether there is a direct correlation between the amount of alginate and lung pathology, and it is unclear if alginate can be used as a prognosis marker for treatment7. Alginate production is mainly regulated by two operons, a regulatory operon (algUmucABCD)8,9 and the biosynthetic operon (algD operon)10,11. Alginate production is tightly regulated by the sigma factor AlgU9,12 (also known as AlgT) and the degradation of the anti-sigma factor MucA13. The ability to monitor the production of alginate in situ from the patients' sputum specimens can aid in the development of novel therapeutic options.
Here, we describe a growth condition that detects the presence of SCV caused by mutants that cannot synthesize the pyrimidine de novo. Supplementation of uracil and/or cytosine, the nitrogenous base of pyrimidine nucleotide, to the medium activates the salvage pathway, thus restoring the normal growth in mutants. This growth method for these specific SCV mutants may be used as a screening method to identify pyrimidine mutations in patient samples. In addition, we discuss two methods for detection and measurement of alginate produced and secreted by P. aeruginosa. The first is the traditional method14,15,16 of degrading the polysaccharide using a high concentration of acid and then adding a colorimetric indicator to quantitate the concentration in the sample. The second method, developed in our laboratory, utilizes the Enzyme-Linked Immunosorbent Assay (ELISA) using an anti-alginate monoclonal antibody (mAb) developed by QED Biosciences. The ELISA method proves to be more specific and sensitive than the uronic acid assay and allows for safer use due to the avoidance of the highly concentrated sulfuric acid. With the ability of the ELISA to be used directly on patient sputum samples to measure alginate, it can be developed as a monitoring diagnostic tool to follow the amount of alginate present in the lungs at different periods of the infection.
Protocol
1. SCV Growth Conditions and Physiological Activation of the Salvage Pathway
- Detection of SCV.
- Streak the P. aeruginosa strains PAO1, PAO1ΔpyrD, PAO581, and PAO581ΔpyrD on prewarmed Pseudomonas isolation agar (PIA) plates and grow at 37 °C for 48 h. On the growth plate identify a single colony isolate that has the SCV phenotype (colony size of 1−3 mm as opposed to the normal 3−5 mm colony size).
- Repeat step 1.1.1 to obtain a pure isolate of the SCV.
NOTE: Growth may require up to 72 h due to the slow growth rate of the SCV colonies.
- Physiological activation of the salvage pathway.
- Using a sterile inoculation loop, pick the SCV colony from the PIA plate and streak on a prewarmed PIA supplemented with 0.1 mM of uracil. Grow plate at 37 °C for 24−48 h.
NOTE: All PIA plates used in this protocol contain 20 mL/L of glycerol added to the mixture before autoclaving. After autoclaving and after mixture temperature is below 55 °C add 11.21 mg/L of uracil (0.1 mM) to the liquid media before pouring plates. This method would help identify pyrimidine mutations that cause SCV phenotype in P. aeruginosa. If the SCV phenotype is a result of said mutation, then normal colony growth and size (3−5 mm) would be observed on the uracil supplemented PIA plates. If strains had the ability to produce alginate, then the mucoid phenotype will also return upon uracil supplementation.
- Using a sterile inoculation loop, pick the SCV colony from the PIA plate and streak on a prewarmed PIA supplemented with 0.1 mM of uracil. Grow plate at 37 °C for 24−48 h.
2. Uronic Acid Carbazole Assay
- From a pure culture of desired strain to be tested, identify a single colony. Using a sterile toothpick, pick the colony, and place the toothpick in a culture test tube containing 5 mL of Pseudomonas isolation broth (PIB). Grow in a shaker incubator at 37 °C for 24 h.
NOTE: The following strains PAO581 (PAO1mucA25), PAO581carA, PAO581carB, and PAO581pyrD were grown on PIA plates or PIA plates supplemented with 0.1 mM uracil to harvest alginate for measurement. - Onto a prewarmed PIA plate add 150 µL of cultured PIB broth (for 15 mm x 100 mm plates) or 450 µL of broth (for 15 mm x 150 mm plates). Using a sterile cell spreader, spread the broth over the plate. Grow the plate at 37 °C for 24 h.
NOTE: Aspirate any excess fluid, if any, from the plate using a pipet by tipping the plate to one side. Both PIB and PIA plates used in the protocol contain 20 mL/L of glycerol to be used by cells as a carbon source to aid in alginate production. - Using a pipette controller and a sterile 50 mL pipette, add 0.85% NaCl to the lawn grown and collect sample by scrapping the plate using a cell spreader. Aspirate the sample using a fresh 50 mL pipet into a 50 mL collection tube. Vortex the sample on high to mix and place the samples on ice.
NOTE: The volume of added 0.85% NaCl varies depending on the size of the plate. For 15 mm x 100 mm plates, use 10−30 mL, and for 15 mm x 150 mm plates, use 20−50 mL. - Measure the optical density at 600 nm (OD600) of the samples by adding 1 mL of the sample to a disposable cuvette and reading the OD using a spectrophotometer. Repeat this step 2x to obtain a triplicate of reads for each sample.
- Add 3 mL of the sulfuric acid/borate solution into culture tubes and let sit on ice. Add 350 µL of the collected sample SLOWLY to the acid mix in the test tubes and vortex on low briefly.
- Prepare borate stock by adding 10.099 g of potassium hydroxide (KOH) powder to 45 mL of water. Add 24.74 g of boric acid (H3BO3) to the mixture and bring volume to 100 mL.
- Place 1 L bottle in a sink with ice and fill bottle with 500 mL of concentrated sulfuric acid. SLOWLY add 15 mL of the prepared borate stock. Allow bottle to cool.
- Add another 10 mL of borate stock for a total of 25 mL. Once bottle is cooled, bring the volume to 1 L.
CAUTION: This method relies on the use of highly concentrated sulfuric acid. Proper personal protective equipment should be used to ensure safety and proper disposal protocol of the sample should be followed.
NOTE: For a positive control a known concentration of D-mannuronic acid and/or a known bacterial alginate samples harvested and purified through alginate producing strains of P. aeruginosa (e.g.: PAO581-PAO1mucA25). For a negative control use 0.85% NaCl solution and/or PAO1ΔalgD (In-frame deletion of algD gene that renders the bacteria completely unable to produce alginate). Multiple tubes can be made from each sample to increase the number of technical repeats to aid in statistical analysis. Prepare 3−5 tubes of each sample.
- Add 100 µL of 0.1% carbazole in ethanol solution to the acid/sample mix. Cap the tube and vortex on medium setting for 5 s. Place in a dry bath at 55 °C for 30 min.
- After incubation, remove the tubes and vortex briefly on high and allow to cool for 5 min.
NOTE: Color to be seen would be a shade of purple. Color will remain stable for measurement for 1−2 h. - Read the OD530 of each tube by adding 1 mL of the mixture to a clean cuvette and reading the OD of the samples at 530 nm on a spectrophotometer. Use the tube with 0.85% NaCl as a blank to the spectrophotometer.
- Prepare a standard curve by measuring the OD530 of serial dilutions of known concentrations of D-Mannuronic acid (1,024 µg/mL, 512 µg/mL, 256 µg/mL, 128 µg/mL, 64 µg/mL, 32 µg/mL, 16 µg/mL, and 8 µg/mL). Repeat 2x. Extract a linear equation from these readings.
NOTE: Standard curve only needs to be done once. The linear equation extracted from it can be used for later testing.- Calculate the concentration of the alginate in each sample using the standard curve and divide the alginate concentration from linear equation by OD600 to obtain the total amount of alginate per OD600.
3. ELISA for Alginate Quantitation
- Repeat steps 2.1−2.4 to obtain samples for alginate measurement.
NOTE: Strains used were PAO1, PAO1ΔalgD, and PAO1 carrying pHERD20T-algU. - Using a micropipette add 50 µL of the collected sample to an untreated 96-well plate. Add 50 µL of coating buffer (carbonate/bicarbonate buffer pH 9.6) to the wells. Incubate the plate at 37 °C for 2 h.
NOTE: For a positive control, a known concentration of D-Mannuronic acid and/or a known stable alginate producing strain (e.g.: PAO581-PAO1mucA25) can be used. For a negative control use 0.85% NaCl solution and/or PAO1ΔalgD (in-frame deletion of algD gene renders the bacteria completely unable to produce any alginate). Multiple wells can be made from each sample to increase the number of technical repeats to aid in statistical analysis. Prepare 3−5 wells of each sample. - Using a squirt bottle, wash the plate wells 2x with 1x phosphate buffer saline (PBS) with 0.05% Tween 20 (PBS-T) by filling the wells, and then draining them by flipping the plate over.
- Using a micropipette add 200 µL of blocking buffer (10% skim milk in PBS-T) to the wells. Incubate at 4 °C overnight.
NOTE: Wrap plate in paraffin film or shrink wrap to help avoid any evaporation in the refrigerator. - Using a squirt bottle wash the plate wells 2x with PBS-T by filling the wells, and then draining them by flipping plate over.
- Using a micropipette add 100 µL of diluted primary antibody (mouse anti-alginate monoclonal antibody) to the wells and incubate at 37 °C for 1−2 h.
NOTE: Primary antibody (mouse anti-alginate monoclonal antibody) was provided at a concentration of 0.5 µg/mL (dilution of 1:2,000 of 1 mg/mL stock) in antibody diluent solution (1% skim milk in 1x PBS). - Using a squirt bottle wash the plate wells 3x with PBS-T by filling the wells, and then draining them by flipping plate over.
- Using a micropipette add 100 µL of diluted secondary antibody to the wells and incubate at 37 °C for 1−2 h.
NOTE: Secondary antibody used was pierce goat anti-mouse poly-HRP antibody to a concentration of 0.25 µg/mL (dilution of 1:2,000 of 0.5 mg/mL stock) in antibody diluent solution. - Using a squirt bottle wash the plate wells 3x with PBS-T by filling the wells, and then draining them by flipping plate over.
- Using a micropipette, add 100 µL of TMB-ELISA solution (Table of Materials) and incubate at room temperature for 30 min in the dark.
NOTE: The color of a positive reaction would be a shade of blue. - Using a micropipette, add 100 µL of stop solution (2 N sulfuric acid).
NOTE: The color will turn from blue to yellow when the stop solution is added. Color is stable for up to 30 min after the reaction is stopped. - Using a plate reader, read the OD at 450 nm.
- Produce a standard curve by measuring the OD450 of serial dilutions of known concentrations of D-Mannuronic acid (1,024 µg/mL, 512 µg/mL, 256 µg/mL, 128 µg/mL, 64 µg/mL, 32 µg/mL, 16 µg/mL, and 8 µg/mL). Repeat 2x. From these readings extract a linear equation.
NOTE: The standard curve needs to be only done once. The linear equation extracted from it can be used for later testing.- Calculate the concentration of the alginate in each sample using the standard curve and divide the alginate concentration from linear equation by OD600 to obtain the total amount of alginate per OD600.
4. Statistical Analysis of Alginate Measurement
- In a graphical software sheet, set a column with the linear equation derived from the standard curve. Set the y-axis results as the alginate concentration and the x-axis results as the OD530 for uronic acid assay and OD450 for ELISA to obtain the alginate concentrations in each sample.
- To normalize the amount of alginate in each sample to the amount per 5.5 x10⁸ CFU/mL (1 OD600), divide the concentration of each sample obtained above by its respective OD600 value. If multiple OD600 were measured for each sample, divide by the mean OD600.
- Perform statistical analysis using preferred statistical software (e.g., GraphPad Prism 7.02).
- Open the software. Choose Column under New Table & Graph and choose the one-way ANOVA data set.
- Name each column with the strain tested and add the alginate concentrations underneath.
- After inputting all the data click on Analyze in the top menu. This will open an analysis settings window. Choose the appropriate parameters for testing and indicate whether any multiple comparisons need to be run.
NOTE: After analysis the data set will contain a p-value that would help determine the statistical significance of the data. Data would be considered statistically significant if the p-value is less than the set α value (normally α value is set for p < 0.01). - Under the graph tab choose the Bar Graph type. This will automatically chart the data with the indicated title from the input data sheet. Indicate statistical significance of the data as needed by showing the * symbol above connective lines between the bars of interest.
Representative Results
Figure 1 shows plates of PAO1 and PAO581 with or without in-frame deletion in the pyrD gene (a gene in the pyrimidine biosynthesis pathway) that results in SCV6. The PAO1 SCV mutant was restored to normal growth in response to uracil supplementation (Figure 1A,B). Furthermore, the PAO581ΔpyrDSCV mutant was returned to mucoidy with the same uracil treatment, because the parent strain PAO581 has an additional mucA25 mutation (Figure 1C,D). The results for the uronic acid carbazole assay are shown in Figure 26. The data represents samples of PAO581 and PAO581 with mutations in genes regulating pyrimidine de novo biosynthesis grown on PIA and PIA supplemented with 0.1 mM of uracil (Figure 2A). The data shows that the presence of uracil in the media results in the conversion of the mutant strain back to mucoidy (as seen by the increase/restored alginate production) (Figure 2B). The results for the anti-alginate monoclonal antibody based ELISA are represented in Figure 3. The data shows PAO1, PAO1 with an in-frame deletion of the algD gene encoding the key alginate biosynthetic enzyme GDP-mannose dehydrogenase, and PAO1 carrying an expression plasmid pHERD20T with the main alginate-specific sigma factor algU when grown on PIA plates with arabinose for the induction the pBAD promoter in pHERD20T. This data shows the non-mucoid levels of alginate measured for PAO1, and PAO1ΔalgD versus the mucoid levels of alginate measured for PAO1+pHERD20T-algU. Figure 4 compares the two methods of alginate measurements together. The results were not statistically significant when compared to each other using a two-way ANOVA with p < 0.01. Figure 5A compares the cross reactivity of the anti-alginate mAb against other polysaccharides including amylopectin, amylose, collagen, and glycogen. Figure 5B shows the comparison in specificity and sensitivity of the uronic acid carbazole assay to the newly developed anti-alginate monoclonal antibody-based ELISA with the control utilizing the highly purified seaweed alginate (Table of Materials). Figure 6 shows direct testing of the ELISA on patient sputum samples that were positive for mucoid P. aeruginosa and patients that did not contain mucoid P. aeruginosa.
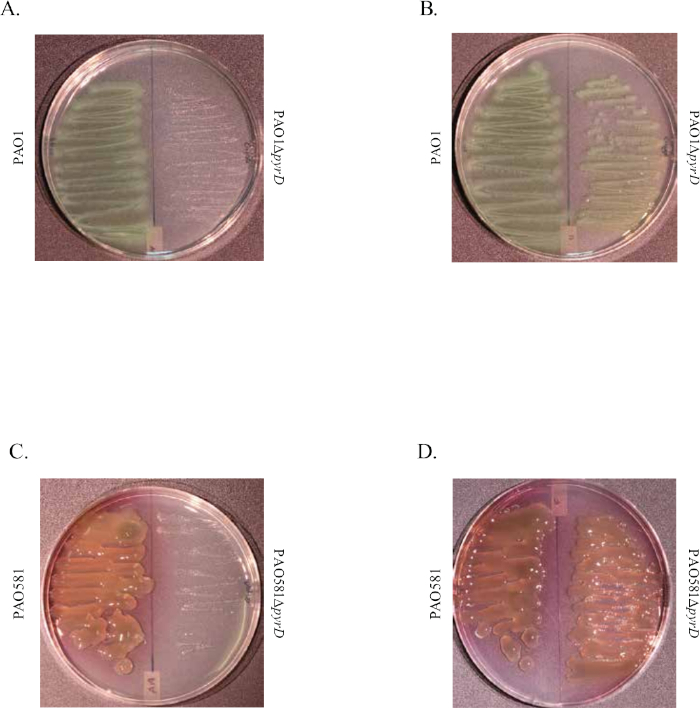
Figure 1: Representative images of the de novo pyrimidine biosynthesis mutations that result in SCV phenotype in PAO1 and PAO581. Image shows PAO1 (left) and PAO1ΔpyrD (right) on PIA plates (A) and PIA plates supplemented with uracil (B) grown at 37 °C for 48 h. Image shows PAO581 (left) and PAO581ΔpyrD (right) on PIA plates (C) and PIA plates supplemented with uracil (D) grown at 37 °C for 48 h. This figure has been modified from work done by Al Ahmar et al.6. Please click here to view a larger version of this figure.
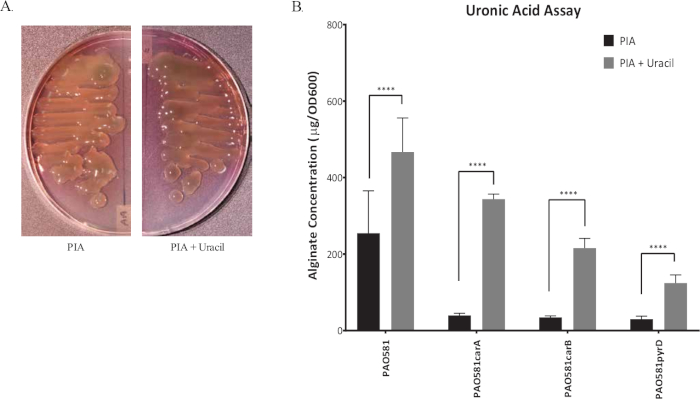
Figure 2: Representative graph of uronic acid carbazole assay. (A) The image of mucoid P. aeruginosa strain PAO581(PAO1mucA25) grown at 37 °C for 24 h on PIA plates (left) and PIA plates with uracil (right). (B) Alginate production for PAO581, PAO581carA, PAO581carB, and PAO581pyrD when grown on PIA plates with and without uracil at 37 °C for 24 h. Alginate was collected and measured using the standard carbazole assay. Values shown are mean alginate ± standard deviation of triplicate reads. (**** = p < 0.0001). This figure has been modified from work done by Al Ahmar et al.6. Please click here to view a larger version of this figure.
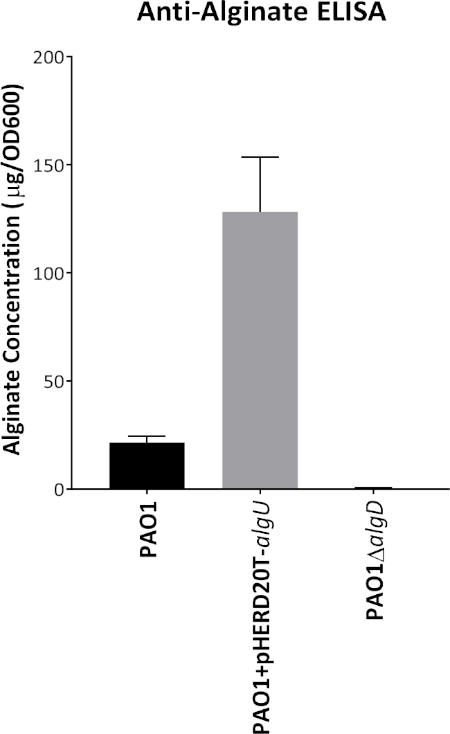
Figure 3: Representative graph of anti-alginate mAb-based ELISA. Alginate production for PAO1, PAO1ΔalgD and PAO1 carrying the expression vector pHERD20T-algU grown on PIA with 0.1% arabinose at 37 °C for 24 h. Alginate was collected and measured using the anti-alginate ELISA with the mouse anti-alginate monoclonal antibody. Values shown are mean alginate ± standard deviation of triplicate reads. ****p < 0.0001. Please click here to view a larger version of this figure.
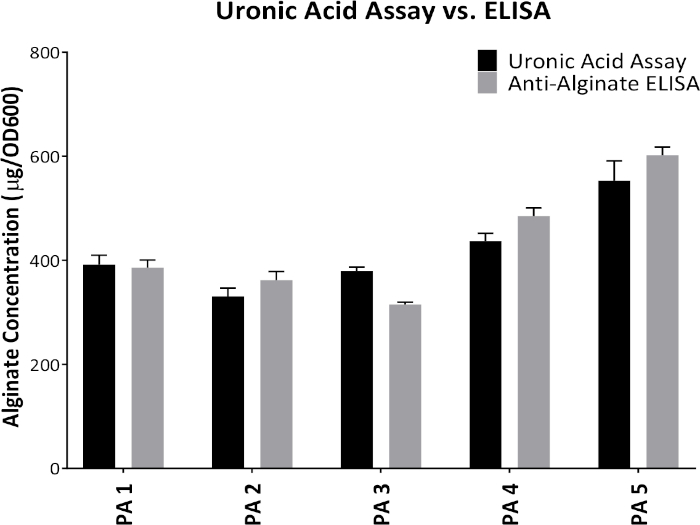
Figure 4: Comparison between the results obtained from uronic acid assay and anti-alginate mAb-based ELISA. Alginate production from five different mucoid P. aeruginosa proprietary strains grown on PIA plates at 37 °C for 24 h. Alginate was collected and measured by the uronic acid assay and anti-alginate ELISA. Values shown are mean alginate ± standard deviation of triplicate reads. Please click here to view a larger version of this figure.
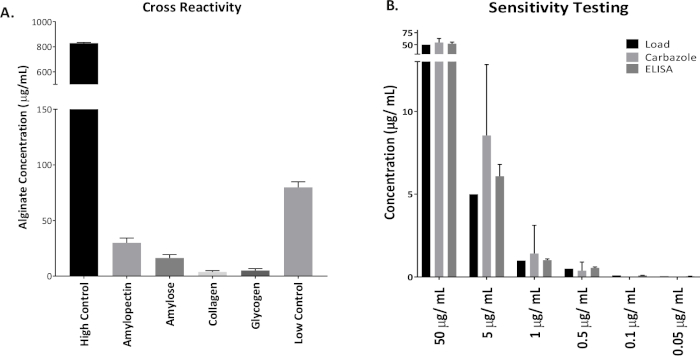
Figure 5: Specificity and sensitivity of the anti-alginate mAb based ELISA in comparison to the uronic acid carbazole assay. (A) ELISA was run with high (800 µg/mL) and low (100 µg/mL) internal assay controls of the seaweed alginate. This alginate was also used as a standard for the ELISA. Other polysaccharides tested that may cross react with anti-alginate mAb were amylopectin, amylose, collagen, and glycogen (500 µg/mL each). (B) Uronic acid carbazole assay and ELISA were run using the same range of standard concentrations with seaweed alginate: 50 µg/mL, 5 µg/mL, 1 µg/mL, 0.5 µg/mL, 0.1 µg/mL, and 0.05 µg/mL. Values shown are mean alginate ± standard deviation of triplicate reads. Please click here to view a larger version of this figure.
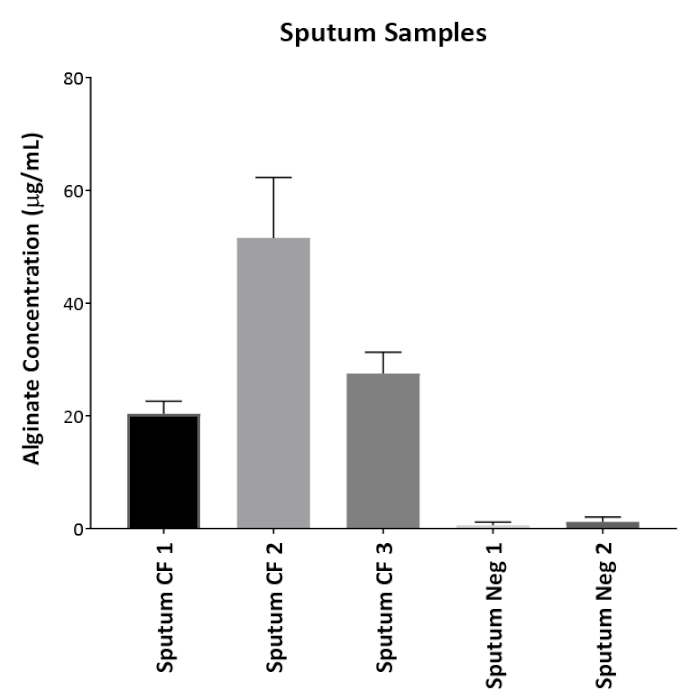
Figure 6: Direct patient sample testing. Anti-alginate ELISA was tested on patients' sputum samples without prior growth on plates. Three CF sputum samples that had growth of mucoid P. aeruginosa were used as well as two patient sputum samples that contained either non-mucoid P. aeruginosa (Neg 1) or no P. aeruginosa growth (Neg 2). Values shown are mean alginate ± standard deviation of triplicate reads. Please click here to view a larger version of this figure.
Discussion
Both SCV and alginate are important disease markers implicated in several chronic infections. Therefore, the ability to grow SCV as well as study the regulation and production of alginate by P. aeruginosa is integral to the discovery of novel treatments for these chronic illnesses.
SCV strains are notoriously difficult to grow due to their slow growth rate4 as compared to other P. aeruginosa strains, which aids in their antimicrobial resistance3. Our work identifies a specific form of P. aeruginosa SCV that are a result of mutations in the de novo pyrimidine biosynthesis. Here, we discuss a growth condition for such SCV to revert to a normal growth phenotype when nucleoside uracil is supplied. However, when UMP/UTP was added to the medium, the defective growth was not restored (data not shown). The porin(s) responsible for this selectivity needs to be further studied. Supplementation of the growth media with uracil aided in relieving the stress induced from pyrimidine starvation (Figure 1). Similarly, addition of free cytosine to the media in the same method of addition of uracil, aided in the relief of pyrimidine starvation (data not shown). Both free uracil and free cytosine in the media enter the cells and help return the normal levels of uridine monophosphate (UMP) and uridine tri-phosphate (UTP)6 in the cell, which is how the SCV isolates reverted back to normal growth.
Several critical steps for the alginate measurements exist that might aid in reproducibility of the results. Initially the samples, after being scrapped from the plates, must remain on ice to help block the degradation of alginate in the sample and result in lower measured concentrations. In addition, prior to OD600 measurements, it is important to thoroughly mix the sample to obtain a homogeneous solution as clumps do form in samples that have been sitting for a while and that might interfere with the OD measurement and thereby with the final concentration calculations. When using the ELISA method, samples from growth plates may need to be diluted especially when using strains that produce a large amount of alginate since results might be outside of the standard curve range. When using the uronic acid, thoroughly vortex the culture tubes after addition of the carbazole and after the incubation to ensure a homogeneous sample. When working with the uronic acid assay, it is important to be cautious when handling the acid mixture and to dispose of the samples properly.
The traditional method of measurement requiring acid hydrolysis of alginate described above has shown great potential and has been utilized by many researchers for several years. In this work, we show the procedure for the traditional assay along with an in-house developed ELISA using an anti-alginate monoclonal antibody. These antibodies were developed in mice and can recognize alginate at a yet to be identified epitope. The specificity of the ELISA method was thoroughly tested against alginate from P. aeruginosa as well as from seaweeds. Moreover, the ELISA was comparable to the uronic acid assay in quantifying alginate in bacterial samples tested (Figure 3). In addition, it was tested against other polysaccharides that might result in false positive results. Our work showed a high specificity of the antibody to alginate and its ability to distinguish between alginate and the other tested polysaccharides (Figure 5A). The ELISA protocol has higher sensitivity as compared to the uronic acid assay (Figure 5B) since we were able to detect trace levels of alginate using ELISA that were not detected using the uronic acid assay when testing patient sputum samples (Figure 6). The ELISA method can be adapted for in vivo measurement of alginate from the patients' sputum (Figure 6). Both the growth conditions using uracil supplementation as well as the newly developed ELISA would be powerful tools in better understanding P. aeruginosa pathogenesis in CF.
Declarações
The authors have nothing to disclose.
Acknowledgements
This work was supported by the National Institutes of Health (NIH) grants R44GM113545 and P20GM103434.
Materials
| 1-Step Ultra TMB-ELISA | Thermo Scientific | 34028 | via Fisher Scientific |
| Absolute Ethanol (200 Proof) | Fisher Scientific | BP2818-4 | Molecular Bio-grade |
| Accu Block Digital Dry Bath | Labnet | NC0205808 | via Fisher Scientific |
| Assay Plates 96-well | CoStar | 2021-12-20 | |
| Bench Top Vortex-Genie 2 | Scientific Industries | G560 | |
| Boric Acid | Research Products International Corp. | 10043-35-3 | |
| Cabinet Incubator | VWR | 1540 | |
| Carbazole | Sigma | C-5132 | |
| Carbonate-Bicarbonate Buffer | Sigma | C3041 | |
| Centrifuge Tubes (50 ml) | Fisher Scientific | 05-539-13 | via Fisher Scientific |
| Culture Test Tubes | Fisher Scientific | 14-956-6D | via Fisher Scientific |
| Cuvette Polystyrene (1.5 ml) | Fisher Scientific | 14955127 | via Fisher Scientific |
| Cytosine | Acros Organics | 71-30-7 | |
| Diposable Inoculation Loops | Fisher Scientific | 22-363-597 | |
| D-Mannuronic Acid Sodium | Sigma Aldrich | SMB00280 | |
| FMC Alginate | FMC | 2133 | |
| Glycerol | Fisher Scientific | BP906-5 | For Molecular Biology |
| Mouse Anti-Alginate Monoclonal Antibody | QED Biosciences | N/A | Lot # :15725/15726 |
| Phosphate Buffered Saline Powder (PBS) | Sigma | P3813 | |
| Pierce Goat Anti-Mouse Poly-HRP Antibody | Thermo Scientific | 32230 | via Fisher Scientific |
| Potassium Hydroxide | Fisher Scientific | 1310-58-3 | via Fisher Scientific |
| Prism 7 | GraphPad | ||
| Pseudomonas Isolation Agar (PIA) | Difco | 292710 | via Fisher Scientific |
| Pseudomonas Isolation Broth (PIB) | Alpha Biosciences | P16-115 | via Fisher Scientific |
| Round Toothpicks | Diamond | Any brand | |
| Seaweed alginate (Protanal CR 8133) | FMC Corporation | ||
| Skim Milk | Difco | 232100 | via Fisher Scientific |
| SmartSpec Plus Spectrophotometer | BioRad | 170-2525 | or preferred vendor |
| Sodium Chloride (NaCl) | Sigma | S-5886 | |
| SpectraMax i3x Multi-mode MicroPlate Reader | Molecular Devices | i3x | or preferred vendor |
| Sterile Petri Dish 100mm x 15mm | Fisher Scientific | FB0875713 | via Fisher Scientific |
| Sulfuric Acid | Fisher Scientific | A298-212 | Technical Grade |
| Sulfuric Acid (2 Normal -Stop Solution) | R&D Systems | DY994 | |
| Tween 20 | Sigma | P2287 | |
| Uracil | Acros Organics | 66-22-8 |
Referências
- Govan, J. R., Deretic, V. Microbial pathogenesis in cystic fibrosis: mucoid Pseudomonas aeruginosa and Burkholderia cepacia. Microbiological Reviews. 60 (3), 539-574 (1996).
- Hogardt, M., Heesemann, J. Adaptation of Pseudomonas aeruginosa during persistence in the cystic fibrosis lung. International Journal of Medical Microbiology. 300 (8), 557-562 (2010).
- Evans, T. J. Small colony variants of Pseudomonas aeruginosa in chronic bacterial infection of the lung in cystic fibrosis. Future Microbiology. 10 (2), 231-239 (2015).
- Johns, B. E., Purdy, K. J., Tucker, N. P., Maddocks, S. E. Phenotypic and Genotypic Characteristics of Small Colony Variants and Their Role in Chronic Infection. Microbiology Insights. 8, 15-23 (2015).
- Pestrak, M. J., et al. Pseudomonas aeruginosa rugose small-colony variants evade host clearance, are hyper-inflammatory, and persist in multiple host environments. PLoS Pathogones. 14 (2), e1006842 (2018).
- Al Ahmar, R., Kirby, B. D., Yu, H. D. Pyrimidine Biosynthesis Regulates Small Colony Variant and Mucoidy in Pseudomonas aeruginosa Through Sigma Factor Competition. Journal of Bacteriology. 201 (1), e00575-e00618 (2019).
- Ramsey, D. M., Wozniak, D. J. Understanding the control of Pseudomonas aeruginosa alginate synthesis and the prospects for management of chronic infections in cystic fibrosis. Molecular Microbiology. 56 (2), 309-322 (2005).
- Mathee, K., McPherson, C. J., Ohman, D. E. Posttranslational control of the algT (algU)-encoded sigma22 for expression of the alginate regulon in Pseudomonas aeruginosa and localization of its antagonist proteins MucA and MucB (AlgN). Journal of Bacteriology. 179 (11), 3711-3720 (1997).
- Schurr, M. J., Yu, H., Martinez-Salazar, J. M., Boucher, J. C., Deretic, V. Control of AlgU, a member of the sigma E-like family of stress sigma factors, by the negative regulators MucA and MucB and Pseudomonas aeruginosa conversion to mucoidy in cystic fibrosis. Journal of Bacteriology. 178 (16), 4997-5004 (1996).
- Rehm, B. H. A., Rehm, B. H. A. Alginate Production: Precursor Biosynthesis, Polymerization and Secretion. Alginates: Biology and Applications. , 55-71 (2009).
- Remminghorst, U., Rehm, B. H. Bacterial alginates: from biosynthesis to applications. Biotechnology Letters. 28 (21), 1701-1712 (2006).
- Potvin, E., Sanschagrin, F., Levesque, R. C. Sigma factors in Pseudomonas aeruginosa. FEMS Microbiology Reviews. 32 (1), 38-55 (2008).
- Damron, F. H., Goldberg, J. B. Proteolytic regulation of alginate overproduction in Pseudomonas aeruginosa. Molecular Microbiology. 84 (4), 595-607 (2012).
- Bowness, J. M. Application of the carbazole reaction to the estimation of glucuronic acid and flucose in some acidic polysaccharides and in urine. The Biochemical Journal. 67 (2), 295-300 (1957).
- Fazio, S. A., Uhlinger, D. J., Parker, J. H., White, D. C. Estimations of uronic acids as quantitative measures of extracellular and cell wall polysaccharide polymers from environmental samples. Applied Environmental Microbiology. 43 (5), 1151-1159 (1982).
- Knutson, C. A., Jeanes, A. A new modification of the carbazole analysis: application to heteropolysaccharides. Analytical Biochemistry. 24 (3), 470-481 (1968).

