Simultaneous Brightfield, Fluorescence, and Optical Coherence Tomographic Imaging of Contracting Cardiac Trabeculae Ex Vivo
Summary
This protocol presents a collection of sarcomere, calcium, and macroscopic geometric data from an actively contracting cardiac trabecula ex vivo. These simultaneous measurements are made possible by the integration of three imaging modalities.
Abstract
In cardiac muscle, intracellular Ca2+ transients activate contractile myofilaments, causing contraction, macroscopic shortening, and geometric deformation. Our understanding of the internal relationships between these events has been limited because we can neither 'see' inside the muscle nor precisely track the spatio-temporal nature of excitation-contraction dynamics. To resolve these problems, we have constructed a device that combines a suite of imaging modalities. Specifically, it integrates a brightfield microscope to measure local changes of sarcomere length and tissue strain, a fluorescence microscope to visualize the Ca2+ transient, and an optical coherence tomograph to capture the tissue's geometric changes throughout the time-course of a cardiac cycle. We present here the imaging infrastructure and associated data collection framework. Data are collected from isolated rod-like tissue structures known as trabeculae carneae. In our instrument, a pair of position-controlled platinum hooks hold each end of an ex vivo muscle sample while it is continuously superfused with nutrient-rich saline solution. The hooks are under independent control, permitting real-time control of muscle length and force. Lengthwise translation enables the piecewise scanning of the sample, overcoming limitations associated with the relative size of the microscope imaging window (540 µm by 540 µm) and the length of a typical trabecula (>2000 µm). Platinum electrodes at either end of the muscle chamber stimulate the trabecula at a user-defined rate. We exploit the stimulation signal as a trigger for synchronizing the data from each imaging window to reconstruct the entire sample twitching under steady-state conditions. Applying image-processing techniques to these brightfield imaging data provides tissue displacement and sarcomere length maps. Such a collection of data, when incorporated into an experiment-modeling pipeline, will provide a deeper understanding of muscle contractile homogeneity and heterogeneity in physiology and pathophysiology.
Introduction
Superfusion of isolated cardiac muscle tissue preparations is a standard and widely used protocol for studying cardiac ionic activation and mechanics1. In particular, the isolation of trabeculae, rod-like structures from the ventricular walls, has enabled assessment of phenomena including the length-dependent activation of contraction2, stretch-dependent response of contraction3,4, and diastolic viscoelasticity5 of cardiac tissue. Ter Keurs, the initiator of this technique of superfusing isolated trabeculae, initially used a combination of fluorescence imaging for Ca2+ measurements and laser diffraction for determining sarcomere lengths2,5. Since these early studies, it has become increasingly common to extract sarcomere length information with a greater spatial resolution using 2D fast Fourier transform (FFT)-based techniques6 on brightfield microscopy images. The two imaging systems allow a partial assessment of the underlying relationship between Ca2+ release and sarcomere length-dependent force production.
Cardiac muscle is striated, with the visible banding associated with an underlying series of contractile units consisting of thick and thick filaments. The interaction of these constituent filaments that make up sarcomeres underlies force generation, which commences as follows: a depolarizing electrical signal, or action potential, causes voltage-dependent L-type Ca2+ channels in the cell membrane to open; the ensuing cellular influx of Ca2+ induces the release of Ca2+ from the sarcoplasmic reticulum (SR), an intracellular Ca2+ store, in a process known as Ca2+-induced Ca2+ release7; this sudden increase in intracellular Ca2+ concentration from nanomolar to micromolar range enables force production to occur; Ca2+ pumps continuously extrude Ca2+ out of the cytosol back into the SR and extracellular compartment; when the intracellular Ca2+ concentration returns to the nanomolar range, force production ceases, and the muscle relaxes. During force production, the constituent thick and thin filaments slide over one another. The sarcomere length dictates the relative extent of overlap and, therefore, the potential for force production of the muscle macroscopically.
In this paper, we extend these fluorescence-brightfield imaging techniques to include optical coherence tomography (OCT). OCT utilizes the physical principle of interference and is capable of garnering the geometric deformation of tissue to understand muscle contractile heterogeneity8. Our device (Figure 1) uses a spectral-domain OCT (SD-OCT) system. In SD-OCT, a beam splitter splits the light from a broadband short coherence-length superluminescent diode into reference and measurement arms. The reference arm contains a fixed-mirror, and the measurement arm contains a 2D-galvanometer to steer the light. Light backscattered from the sample is collected and interferes with the reflected light in the reference arm to form an interference pattern. The depth information is encoded in the frequency of the spectral fringe. To extract the information, the signal is passed through a spectrometer and an inverse FFT is applied to the result. The corresponding 1D signal represents the structures at different depths, corresponding to changes in refractive index9 (A-scan). By steering the laser in a single axis, one can construct a cross-section of the sample of interest (B-scan) and, similarly, by repeating the process in a step-wise pattern in the remaining axis, a three-dimensional image can be generated (C-scan). By extension, one can collect a series of B-scans at a single slice for a repeating time-varying subject based on an external trigger and repeat to generate a three-dimensional scan, representing a time-varying planar image10.
In integrating the three imaging systems, we have considered the following two principles. First, imaging sensors should not detect light from an alternative imaging modality, and second, the physical design should contain free space for at least three simultaneous imaging planes. To address the first requirement, the brightfield microscope uses a 660 nm wavelength LED to illuminate the sample in an inverted configuration. The fluorescence microscope is in an epifluorescence configuration where the same objective lens is used for both excitation and collection of the emitted light. The excitation light has a wavelength of between 340 nm and 380 nm, and a photomultiplier tube (PMT) measures the emitted light at a wavelength of 510 nm. A pair of dichroic mirrors enable these two optical paths to share the same physical footprint without interfering with the opposite measurement (Figure 2). Finally, the OCT uses broadband (100 nm spectral width) light with a central wavelength of 840 nm, distinct from the other two modalities. Due to the low-coherence nature of the light used for OCT, any scattered light from the brightfield-fluorescence sources will not contribute to the interference pattern that encodes depth information. For the second requirement, the housing design for the capillary tube has accessible optical pathways to the anterior, inferior, and superior planes of the sample. During experiments, two platinum hooks hold a trabecula within a capillary tube perfused with oxygenated Krebs-Henseleit (KH) solution. The galvanometer head of the OCT is oriented orthogonally to the brightfield-fluorescence imaging pathway to take advantage of the third orthogonal optical plane (Figure 3).
This paper outlines the design considerations for building a device capable of simultaneously imaging calcium, sarcomere length, and muscle geometry. To demonstrate these measurement capabilities, we describe the process of isolating a ventricular trabecula, the preparation of the necessary buffer solutions, along with the critical steps involved in the handling and fluorescence loading of an ex vivo trabecula. Finally, this paper outlines the processes required to translate the dataset into more useful visualizations.
Protocol
The University of Auckland's Animal Ethics Committee approved the handling of rats and the preparation of tissue samples.
1. Imaging calibration
- Brightfield microscope pixel calibration
- Fill the measurement chamber with distilled water.
- Place a diffraction grating with known lines per µm into the measurement chamber.
- Press F1 to enable the capture and adjust the Frame Rate [Hz] until the diffraction grating is clearly visible (Figure 4A). Ensure that the diffraction grating runs parallel with the edge of the frame. Press F1 again to stop capture.
- Set the Total Images to Capture? to one, press Ctrl + Shift + S to stream data to disk, and press F1 to capture an image of the diffraction grating.
- Open ImageJ and import the diffraction grating image (File > Open > Select Calibration image). Holding shift, draw a line that encompasses 20 light and dark bands of the diffraction grating.
- Calibrate the image (Analyze > Set Scale). The length of the line from Step 1.1.5 sets the Distance in Pixels value. Set the Known Distance value to 20 times the lines per µm measurement and the Unit of Length to µm. The inverse of the scale is the number of micrometers represented by a pixel.
- OCT depth resolution calibration
- Measure the thickness of a glass microscope slide using Vernier calipers.
- Turn on the OCT laser source.
- Cover the galvanometer head and click Get BG to measure the background interference pattern and subtract it from the measurement (Figure 4B).
- Clamp the measured glass microscope slide (from Step 1.2.1) in the measurement arm of the OCT.
- Click Live Stream to view the OCT image. Adjust the glass microscope slide until it is visible within the B-scan.
- To capture the B-scan image, set Range Y (Steps) to one, click Stream B-scan Data?, and click Acquire.
- Import the B-scan image into ImageJ (File > Open > Select B-scan). Holding shift, draw a line between the boundaries of the glass microscope slide.
- Set the scale (Analyze > Set Scale). Set Known Distance to the measurement collected in Step 1.2.1.
- To calculate the depth resolution in air, correct for the refractive index of the microscope slide (nglass = 1.5175)11 by multiplying the measurement per pixel value by nglass.
NOTE: The nglass quoted is for borosilicate glass. Microscope slides can be made from different materials. Use the appropriate refractive index for the slide measured. - To scale the depth resolution for myocardium, divide the value from Step 1.2.9. by nmyocardium = 1.38 (value reported previously12).
2. Muscle sample preparation
- Prepare the dissection rig.
- Pour some of the dissection solution (outlined in Table 1) into a small metal bowl and place in the freezer about an hour before heart excision.
- Setup a dissection rig ensuring dissection solution is well-oxygenated (100% oxygen) and has flushed through each of the tubing lines. Fill the dissection chamber with oxygenated dissection solution and loosely tie 3/0 suture around the perfusion catheter.
- Excise the heart.
- Anesthetize 8-10 weeks old Wistar rat using gaseous isoflurane (< 5% in oxygen). Confirm anesthesia by tail pinching.
- Position the anesthetized rat in a supine position and inject subcutaneously in the abdominal area with heparin solution (1000 IU/kg). Maintain anesthesia for five more minutes to allow the heparin to circulate.
- Retrieve the metal bowl containing dissection solution from the freezer and place it near the euthanization bench.
NOTE: Avoid freezing the dissection solution completely to enable the complete submersion of the dissected heart. - Transfer the anesthetized rat to the euthanization bench and euthanize by cervical dislocation.
- Open the rat chest with scissors, first cutting the body wall along the underside of the ribcage, then the diaphragm, before proceeding along the lateral borders of the ribcage. Lift the chest out of the way.
- Grab the heart with one hand while the other hand uses a pair of curved scissors to cut the connecting vessels (aorta, vena cava, etc.).
- Quickly submerse the heart in the cold dissection solution.
- Isolate a trabecula.
- Identify the aorta while the heart is in the metal bowl, then transfer the heart to the dissection chamber. Using two curved forceps, pull the aorta over the perfusion cannula.
- Hold the aorta in place with one forceps. Meanwhile, open the tubing line to allow the dissection solution to flow through the perfusion cannula.
NOTE: Aim to complete perfusion within the minute following the heart excision. - Once the coronary vasculature is cleared of blood and the heart is completely perfused with the dissection solution, halt the perfusion flow, and secure the aorta in place using the suture. Turn the flow back on and perfuse the cannulated heart.
- Rotate the cannula so that the left coronary artery is visible on the superior surface. Pin the apex of the heart to the bottom of the dissection chamber (Figure 5A). Cut off both atria (Figure 5B).
- With a set of spring scissors, cut along the right side of the septum to the apex of the heart (as indicated on Figure 5B). Pin the opened left ventricle to the base of the dissection chamber. Then cut along the left side of the septum, open the right ventricle, and pin it to the base of the dissection chamber, too (Figure 5C).
NOTE: In order to pin the ventricles in an open position, some papillary muscles will have to be cut. Identify a free-running trabecula in the right ventricle (Figure 5D-E). - Using the spring scissor and a forceps, cut the wall tissue surrounding the trabecula, then cut the wall tissue in half orthogonally to the direction of the trabecula. Trim the wall tissue until its dimension is appropriate for the mounting configuration used. In this case, approximately half the size of a sesame seed (Figure 5F).
NOTE: Trabeculae can be dissected from the right and left ventricles, but those from the left are typically more turbid and less applicable for sarcomere and geometry measurements. - Leave the excised trabecula in the dissection chamber, continuously superfusing with the dissection solution.
3. Experimental protocol
NOTE: The device13 used for this experiment was built in-house and uses custom control code. The necessary considerations for the design of a device built to replicate these data are two independently actuated mounting hooks, a measurement chamber with three optically clear axes (Figure 3), and an external trigger line that synchronizes the brightfield and OCT cameras with the stimulator. The PMT voltage and force signal were collected using analog DAQ cards, the images from the OCT and brightfield microscope were collected using Camera Link frame-grabber cards, and the stimulus signal was collected using a digital I/O card. Data were stored offline using a set of producer consumer loops to maintain temporal alignment.
- Prepare the cardiomyometer.
- Flush hot (~60 °C) water, distilled water (room temperature), and then superfusate solution through the measurement chamber. Continuously bubble the superfusate solution with carbogen.
- Turn on the brightfield microscope illumination source and press F1 to enable capture (Figure 4A). Manually adjust the downstream hook until it is centered in the brightfield image. Click Zero Downstream Axis, then Downstream Disabled to enable the motor (Figure 4C). Move the DS Setpoint [um] slider until the end of the hook aligns with the edge of the default region of interest.
- Re-zero the downstream axis, then move the DS Setpoint [um] slider to 1000. Repeat the process with the upstream hook, but do not move the US Setpoint [um] slider.
- Click Move to Mounting (Figure 4C).
- Start the fluorescence illumination system by toggling the Lamp switch before quickly turning on the controller subsystems by toggling the Main switch.
NOTE: Some UV light sources produce large amounts of ozone. If this is the case, connect an ozone extractor to the outlet vent of the light source and ensure it is running prior to turning on the fluorescence illumination source. - Switch the operational mode to Turbo-Blanking by pressing the Mode button on the front panel, followed by 2, then 1. Press the On-line button to allow the control code to inform operation.
- Mount the trabecula.
- Pause superfusate flow through the measurement chamber. Fill the mounting chamber with the dissection solution.
- Using a 1 mL syringe, transport the trabecula from the dissection chamber to the mounting chamber (Figure 5G).
- To transfer the trabecula, place the syringe vertically and in contact with the surface of the mounting chamber solution. Allow the trabecula to descend into the mounting chamber via gravity (Figure 5H).
- Lower the fluid level in the mounting chamber so that it is in level with the midsection of the hooks.
- Adjust the distance between the hooks to reflect the slack length of the trabecula by moving the DS Setpoint [um] slider.
- Using a microscope to aid visualization, lightly grip one of the pieces of end tissue with forceps and mount it onto the upstream hook. Mount the other piece of end tissue onto the downstream hook (Figure 5I).
- Once securely mounted, move the trabecula back into the measurement chamber (Figure 5J) by pressing Move to Chamber (Figure 4C). Resume superfusate flow and fluid extraction.
- Set Stimulus frequency [Hz] to 1, Stimulus duration [ms] to 10, and Stimulus Voltage to 10. Start stimulation by pressing Stimulus On?.
- Prepare the trabecula.
- After about 1 h of acclimatization, gradually decrease the stimulus voltage and stimulus duration in 1 V and 1 ms steps, respectively. A typical set of values is 3 V and 3 ms.
- Turn on the brightfield illumination system. Press F1 and select a region of interest that encloses a striated area on the user interface. Click Compute SL? to calculate the average sarcomere length in the highlighted region. Increase the muscle length until the average sarcomere length is 2.32 µm by increasing the Separation Setpoint [um] slider.
NOTE: Compute SL? uses a 2D FFT outlined in Step 4.3. The region of interest used to calculate the average sarcomere length is typically a 100 µm to 150 µm square. Therefore, as the muscle approaches optimal sarcomere length, 43 to 65 sarcomeres are used to calculate the average sarcomere length. - Move the muscle by adjusting the Centre Setpoint [um] slider on the "Centre and Separation Control tab (Figure 4C) so that the edge of the downstream hook is just visible within the brightfield image. Collect the fluorescence information for ten twitches.
- Increase the Centre Setpoint [um] value by 200 and collect another ten twitches worth of fluorescence information. Repeat this process until the brightfield image contains the upstream hook. Collect the final window's worth of fluorescence information.
- Return the trabecula to a central position by setting the Centre Setpoint [um] value to 0.
- Reduce the stimulus frequency to 0.2 Hz and switch from the KH superfusate to the Fura-2 loading solution (detailed in Table 1).
- Measure the fluorescence signal every 10 min by clicking Enable Fluorescence Source on the Stim and Data tab. Visualize the fluorescence signal on the PMT Signal tab.
- After the 360 nm signal has increased by a factor of 10 or the duration of the loading procedure has exceeded 2 h, return the stimulus frequency to 1 Hz and switch back to the KH superfusate solution.
- Check the ratio measurement every 10 min until the ratio measurement stabilizes, at which point data collection can begin.
- Collect brightfield- and fluorescence-imaging data.
- Return the muscle to the position where the edge of the downstream hook is just present within the brightfield image. Start streaming hardware data by clicking Stream Data to Disk on the Stim and Data tab of the hardware-control user interface. Capture fluorescence information by clicking Enable Fluorescence Source.
- On the brightfield imaging user interface, set the capture mode to an external trigger, increase the frame rate to 100 Hz, and set the number of images to capture to 100. Press Ctrl + Shift + S followed by F1 to record the brightfield imaging data for this window.
- Increase Centre Setpoint [um] value by 200 and repeat Step 3.4.2. Continue with the scanning protocol until the imaging data has been collected for the final window from Step 3.3.4.
- Return the trabecula to a central position by setting the Centre Setpoint [um] value to 0.
- Collect OCT imaging data.
- Turn on the OCT laser source by turning the master key to the | symbol, pressing the power button, followed by the SLDs button.
- Cover the galvanometer head and click Get BG to measure the background interference pattern and subtract it from the measurement (Figure 4B).
- Set the image capture mode to live-view.
- Adjust the y-position until the B-scan image contains the upstream hook only. Divide the muscle length displayed on the control front panel (Figure 4B) by two and subtract the current y-position. Enter this value into the "y-offset" input. Adjust the "x-offset" value until the cross-section of the trabecula is centered in the frame.
- With the trabecula centered, scan along the y-axis by adjusting the y-position to find the positions corresponding to the upstream and downstream hooks. Note these positions down. Set Range Y (steps) to the absolute difference between these values divided by ten.
- Set the image capture mode to Stimulus Triggered?, Range X (steps) to 100, and click the Set Active Parameters button.
- Click Stream B-Scan Data?, then Acquire.
NOTE: The gated imaging protocol requires 200 twitches to capture the entire muscle geometry for a sample 2 mm in length, which corresponds to a capture time of ~3 min 20 s.
4. Process the brightfield image dataset
- Prepare the images for analysis.
- Import images into ImageJ (File > Import > Image Sequence > Select image).
- Increase image contrast (Image > Adjust > Brightness/Contrast > Move minimum and Maximum sliders to centralize the image histogram).
- Sharpen the images (Process > Filters > Unsharp Mask > set Radius (Sigma) to 1.0 pixels and Mask Weight (0.1-0.9) to 0.6).
- Export the image sequence (Save As > Image Sequence > Set the Format to PNG, Start at to 0 and Digits (1-8) to 4).
- Stitch the images, measure the localized displacement, and compute the local sarcomere lengths.
- Open "TrabeculaProcessing.m" (available on request) and set the FolderPath variable to the main folder containing all of the data, and ImagePath to the folder where the image sequence from Step 4.1.4 was saved. Set sections to the number of imaging windows and frames to the number of frames captured per window.
- Run the code.
NOTE: The outputs will be present in the output folder path specified by the user. (By default, the path is set to FolderPath/Output).
- FFT sarcomere length technique
- Use image-processing software to perform a FFT on a region of the image where sarcomeres are highly visible.
- Multiply the pixels per µm calibration results from Step 1.1.6 by 1.6 µm and 3.0 µm before calculating the inverse to get the range of spatial frequencies of interest.
- Fit an exponential to the FFT result, ignoring the frequency information in the frequency range calculated in Step 4.3.2, and subtract it from the transform result to remove the DC term.
- Fit a Gaussian curve to the frequency band of interest.
- Calculate the inverse of the peak of the Gaussian curve. This is the average sarcomere length for the region of interest.
NOTE: The FFT calculation and the fitting of the exponential and Gaussian equations were performed using custom LabVIEW code.
5. Process the fluorescence data
- Subtract the window-dependent autofluorescence from the respective window and compute the quotient of the signals associated with the 340 nm and 380 nm excitation wavelengths.
6. Process the OCT imaging data
- Prepare the OCT image set for segmentation.
- Open ImageJ and import the images (File > Import > Image Sequence). On the file explorer window, this opens, locate the images, select one and click Open.
NOTE: If the control code for the OCT does not store the images in a format that is readable by ImageJ, convert them to PNG. - To ease visualization, organize the image sequence into a hyperstack (Image > Hyperstacks > Stack to Hyperstack). In the dialogue box that opens, set the number of slices to the number of B-scans per slice and the X to the number of slices along the length of the trabecula.
- Draw a rectangle that encloses the trabecula. Confirm that it encloses the entire volume through time by using the sliders on the hyperstack window. Crop the image to the window (Image > Crop).
- Remove slices that contain images of the mounting hooks (Stacks > Tools > Slice Keeper). Select the range of slices that contains trabecula information only.
- Open ImageJ and import the images (File > Import > Image Sequence). On the file explorer window, this opens, locate the images, select one and click Open.
- Train WEKA segmentation.
- Open WEKA segmentation (Plugins > Segmentation > Trainable Weka Segmentation).
- Set the selection mode to Freehand.
- Click Settings and adjust the classifier and training settings. (For this model, the following Training features were used: Gaussian blur, Sobel filter, Hessian, Difference of Gaussians, membrane projections, Bilateral, and Lipschitz. Membrane thickness was set to 1, Membrane patch size to 8, Minimum sigma to 1, and Maximum sigma to 32. The classifier was set to FastRandomForest and the classifier options were set to: batchSize 100, maxDepth to 32, numFeatures to 32, numThreads to 0, and numTrees to 200.)
- Manually segment images until training results in satisfactory segmentations.
- Save the classifier.
- Segment the processed B-scans
- Launch WEKA segmentation following Step 6.2.1.
- Load the classifier from Step 6.2.5.
- Click Create Result.
- Convert the images to 8-bit (Image > Type > 8-bit).
- Convert the images to binary (Process > Binary > Make Binary > Default method and default background).
- Save as image sequence (PNG).
- Calculate the average CSA in the segmented B-scan images.
- Count the number of white pixels in a binary B-scan image.
- Multiply the pixel area by the calibrated depth resolution (from Step 1.2) and 10 µm (the distance between neighboring A-scans).
- Repeat for all of the B-scans between the hooks and average the measurements.
- Convert segmented image into a mesh.
- Open "OCTmain.m" (available on request) and set imageDirectory to the folder containing the output from Step 6.3.6. Set outputPath as necessary.
- Set slices to the value of "Range Y (steps)" (Step 3.5.5) and frames to the value of "Repeat X" (Step 3.5.6), z_dim to the depth resolution (Step 1.2.10), and x_dim & y_dim to the value assigned to 10.
- Click Run.
Representative Results
In order to capture the regional Ca2+ and brightfield information for the entire length of the trabecula presented here, seven muscle positions were required. Figure 6 suggests that the twitch force was undisturbed by this motion, revealing that there was no position dependence of the active force production.
B-scans collected using optical coherence tomography at a rate of 100 Hz were segmented using the ImageJ plugin WEKA14 (Figure 7A). Each cross-section appears distorted due to the difference between the lateral (10 µm) and depth (1.73 µm (in myocardium)) resolutions. This distortion was corrected by scaling the image's depth axis by the lateral resolution-depth resolution ratio. Figure 7B,C demonstrate that after scaling the raw C-scan of the trabecula it is approximately cylindrical in geometry. The reflection of the measurement chamber wall can sometimes overlap with the muscle data (Figure 7A,B), but the segmentation software can be trained to account for this (Figure 7D,E). Once segmented, the cross-sectional area along the length of the muscle can be calculated throughout the twitch (Figure 7F). Note that this particular trabecula has a small appendage branching from it. The motion of the branch is evident ~0.75 mm along the trabecula. Finally, the segmented images can be converted into meshes to aid the construction of geometric models (Figure 7G).
Imaging data captured at each of the different trabecula positions at a rate of 100 fps were stitched together to create a single complete image of the trabecula (Figure 8A). The resolution of these images is 0.535 µm/pixel. The use of linear weighting functions in the overlapping regions of neighboring windows aids visualization and minimizes the impact of the vignette present in the brightfield images. To measure the fluorescent signal, a 540 µm by 540 µm window of the trabecula is cyclically illuminated with 340 nm, 365 nm, and 380 nm wavelength light at a rate of 600 Hz. The ratio of the emitted fluorescence associated with the 340 nm and 380 nm excitation light correlates to the intracellular calcium after the trabecula has been loaded with Fura-2. As this measurement is a ratio, the effective measurement rate is 200 Hz. The averaged (n = 10) intracellular Ca2+ transients from each window are aligned with the region they were imaged (Figure 8B). While the peak of the transients appear reasonably consistent, the diastolic [Ca2+] is lower within the region between 900 µm and 1800 µm along the trabecula. Similarly, the results of the displacement tracking (Figure 8C) and sarcomere length (Figure 8D) calculations also indicate the presence of regional variability. The markerless tracking technique used is able to process the displacement of each pixel, given enough contrast. When mapping the distribution of sarcomere lengths in post, a cross-correlation area of 128 pixels by 128 pixels (~67 µm by 67 µm) was used to calculate regional sarcomere length. This area encapsulates approximately 29 sarcomeres when close the sample is close to optimal sarcomere length. The step-size (in both the x- and y-directions) between the centroid of each cross-correlation window was set to 50 pixels (~26 µm) for processing these data. The suitability of sarcomere length estimates were tested based on the width and amplitude of the Gaussian fit to the FFT signal. These conditions were not met in the muscle region between 0 µm and 500 µm so no sarcomere length information could be computed there. Given the associated displacements, it is likely that the sarcomeres in this region elongated during the contractile phase. In keeping with this speculation, the average sarcomere lengths on the right-hand side of the trabecula shorten during that period. By combining the information provided by each of the panels, it appears that the region with the largest cross-sectional area does not produce the most significant force. On the assumption that the regional variation of Ca2+ transients has an approximately smooth gradient, Figure 8B indicates that the largest amplitude Ca2+ transient occurs somewhere between 1300 µm and 1600 µm along the trabecula. The displacement map indicates that the region that undergoes the least motion aligns well with the peak Ca2+ transient. However, this region has the smallest cross-sectional areas of the sample. With these data in mind, one could infer that this region generated the most stress.
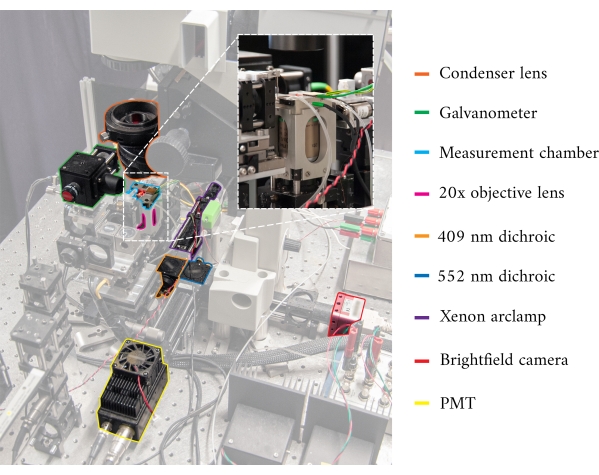
Figure 1: Annotated image of the cardiomyometer. Each of the main optical components is outlined. The inset contains a close-up, rear-view, of the microscope objective in situ, below the measurement chamber. Please click here to view a larger version of this figure.
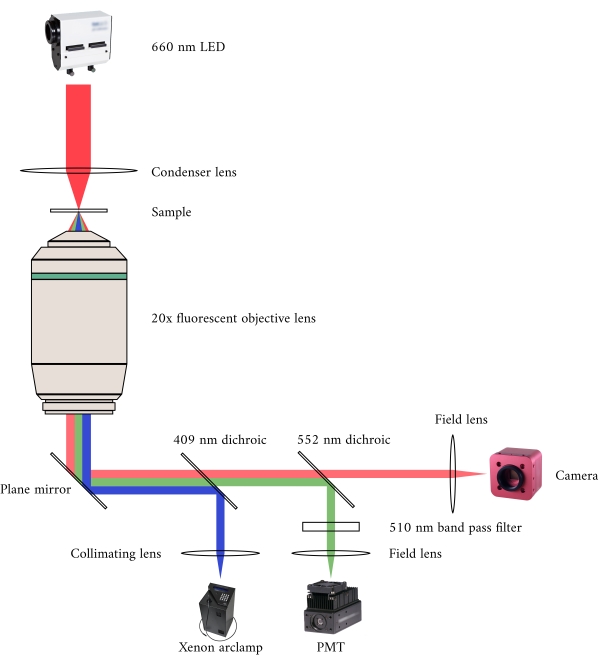
Figure 2: Optical pathway for simultaneous brightfield and fluorescence microscopy. The illumination source for the fluorescence microscope is a Xenon arc lamp, the output of which cyclically switches between 340 nm, 365 nm, and 380 nm light. The arc lamp output path contains a dichroic mirror with a cut-off wavelength of 409 nm that reflects the UV light onto a mirror that directs the light into a fluorescence microscope objective. The lens focuses the excitation light onto the sample and collects the emitted light, which has a longer wavelength of 510 nm. This emitted light passes through the first dichroic mirror, but not the second, as it has a cut-off wavelength of 552 nm. A field lens then focuses the reflected light onto the sensor of the PMT. Meanwhile, the illumination source (660 nm LED) for the brightfield microscope is located above the sample. The transmitted light is focused onto the sample by a condenser lens, and the 20× fluorescence objective captures the resultant transmission image. The wavelength used for brightfield illumination exceeds the cut-off wavelength of each dichroic mirror, so it passes through both of them before the image is focused onto the sensor of a CMOS camera. Please click here to view a larger version of this figure.
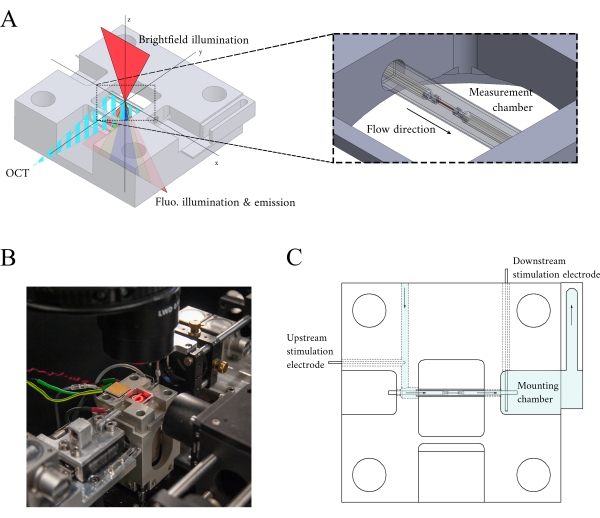
Figure 3: Measurement chamber holder design. (A) Isometric view of the measurement chamber holder with optical paths overlaid. Brightfield illumination occurs from the superior surface (z-axis); fluorescence illumination occurs from the inferior surface (z-axis), and the measurement arm OCT signal is orthogonal to the other illumination axis (y-axis). During the experiment, two platinum hooks hold a trabecula within a glass capillary tube that functions as the measurement chamber. Voice-coil motors control each hook and their positions are measured using laser interferometry. The current position is compared with a user-defined set point and, using a PID controller encoded within an FPGA, the error is minimized. (B) Measurement chamber in situ with the brightfield illumination turned on. The back-view is shown in the Figure 1 inset. (C) Schematic of the superfusate flow through the measurement chamber holder. Superfusate enters the rear of the block and flows in the direction indicated by arrows. The upstream and downstream electrodes establish the field stimulation for eliciting the contraction of a mounted trabecula in the measurement chamber. Blue shading indicates the regions where the superfusate flows during an experiment. Please click here to view a larger version of this figure.
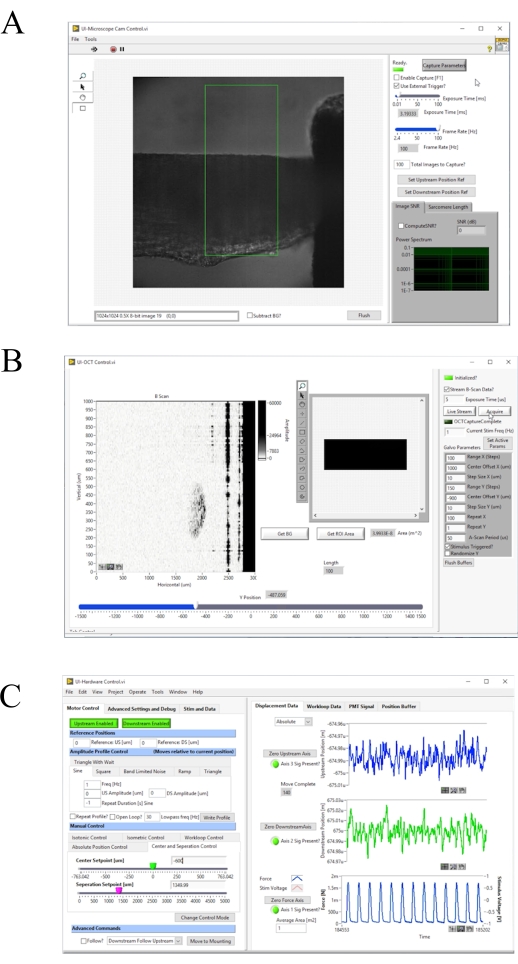
Figure 4: Front panel of the image acquisition and control software. (A) Brightfield imaging user interface. (B) OCT imaging user interface. (C) Hardware control user interface. Please click here to view a larger version of this figure.
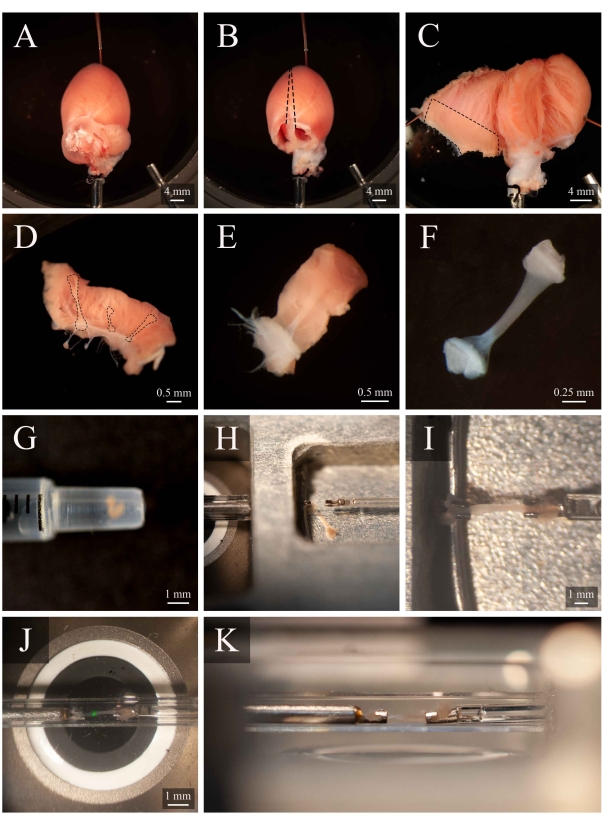
Figure 5: Trabecula dissection and mounting protocol. (A) Langendorff-perfused rat heart in the dissection chamber. (B) The same heart with the atria removed. Dashed lines indicate the excision trajectory to open the ventricles. (C) An opened heart to expose the interior of both ventricles. The dashed box indicates the region where trabeculae are typically found. (D) Excised right-ventricular wall region (the same as indicated by the dashed box in C). Dashed lines highlight three trabeculae. (E) A trabecula selected from the three in D. (F) The trabecula from panel E with the wall tissue removed. (G) The isolated trabecula in the end of a 1 mL syringe. (H) The trabecula in the mounting chamber. (I) The trabecula mounted between two platinum hooks. (J) The trabecula, mounted between hooks, within the measurement chamber (Figure 3B). The green spot is an artefact from the first dichroic filter. (K) Secondary angle of the mounted trabecula within the measurement chamber. The distance between the trabecula and the microscope objective lens is approximately 1 mm. Please click here to view a larger version of this figure.
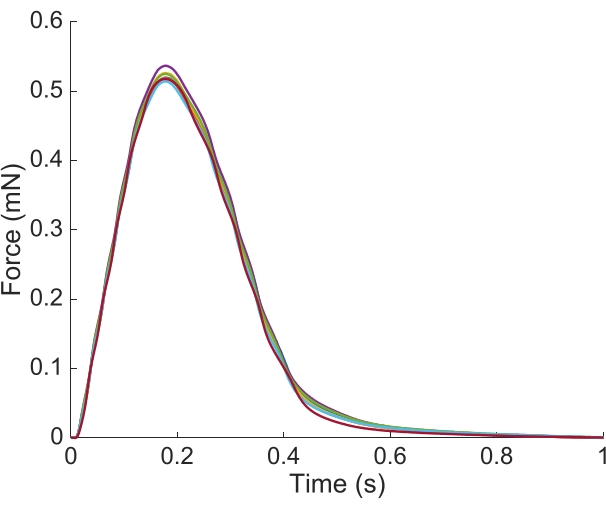
Figure 6: Position dependence of the force measurement. The force produced by the muscle from each of the imaging positions (n = 7) overlaid. The average active force production was 0.527 mN ± 0.003 mN, time to 50 % contraction 77.1 ms ± 0.3 ms, and time to 50 % relaxation 328.1 ms ± 0.9 ms (all data are presented as the mean ± SE). Please click here to view a larger version of this figure.
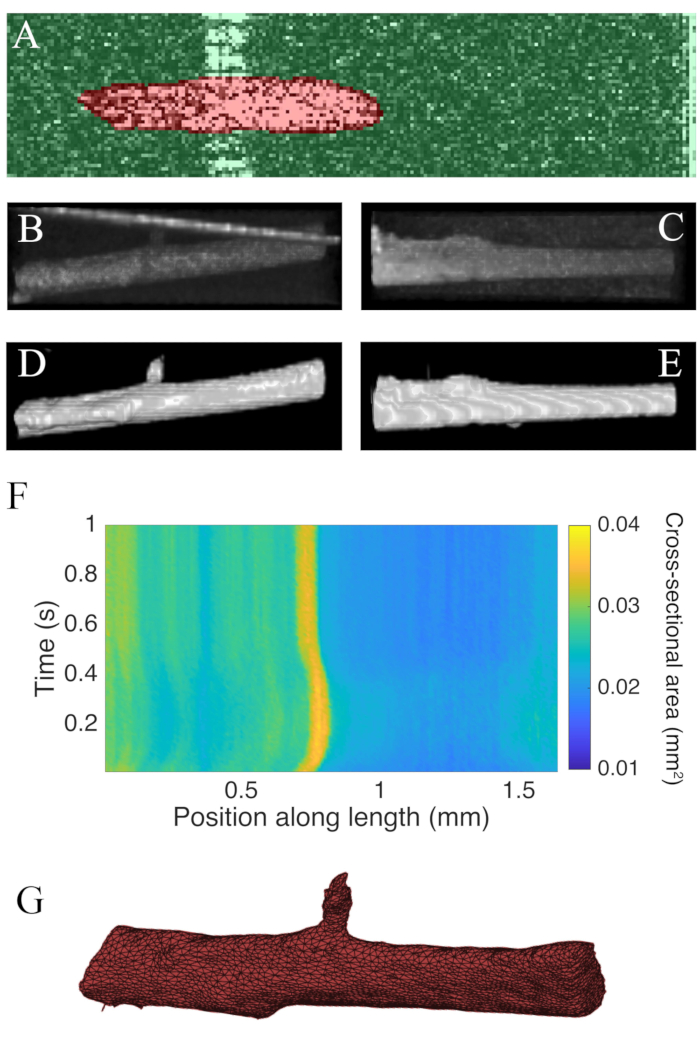
Figure 7: OCT imaging analysis. (A) Example of WEKA segmentation. The segmented cross-section of the muscle is highlighted in red, and the background is highlighted in green. (B) Superior view of the raw C-scan data of a trabecula. The bright angled line towards the top of the image is the reflection of the measurement chamber wall. (C) Lateral view of the raw C-scan data of a trabecula. (D) Superior view of the segmented OCT data. (E) Lateral view of the segmented OCT data. (F) The cross-sectional area along the length of the trabecula (x-axis) through time (y-axis). The average cross-sectional area along the muscle length was 0.0326 mm2 ± 0.0005 mm2 (mean ± S.E.) (G) A mesh of the trabecula. The mesh has been approximately aligned with the cross-sectional area plot of panel F. Please click here to view a larger version of this figure.
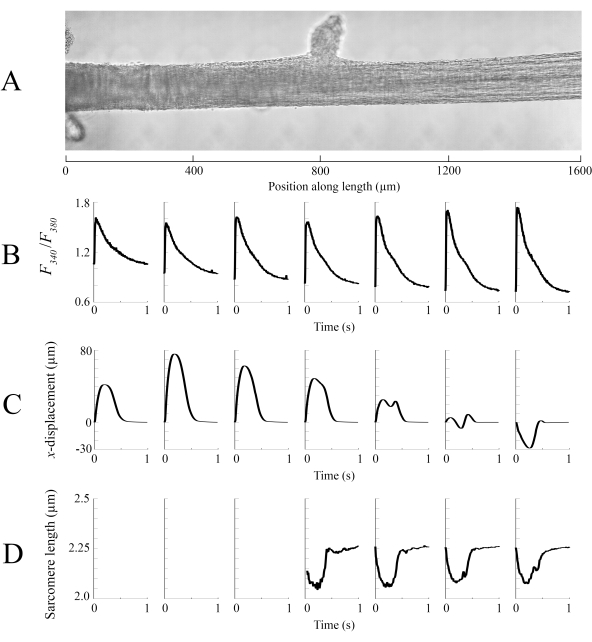
Figure 8: Brightfield and fluorescence imaging analysis. (A) Stitched image (seven imaging windows) of the trabecula. (B) Ca2+ transients along the length of the trabecula. (C) Average x-displacement from each imaging window. A positive displacement represents a motion to the right and negative to the left. (D) Average sarcomere lengths from each imaging window that had the necessary image contrast. Please click here to view a larger version of this figure.
Table 1: Table of Solutions Please click here to download this Table.
Discussion
In this study, we present a configuration that enables the assembly of three optical systems combining brightfield, fluorescence, and OCT imaging to gather data from an actively contracting ex vivo cardiac trabecula (Figure 1 and Figure 2). Such an orchestrated integration is possible due to the design of the measurement chamber (Figure 3) to enable the orthogonal arrangement of the OCT to the brightfield-fluorescence axis. The muscle-mounting system plays an equally important role in the success of simultaneous quantifications of key indices in characterizing cardiac muscle excitation-contraction dynamics. Its novelty resides in enabling muscle-scanning procedures with no apparent disturbance to the mechanical performance of the muscle (Figure 6). With the combined imaging configuration and motorized-hook system for force measurement, this system can evaluate regional heterogeneity in the Ca2+ transient, displacement, and sarcomere length, together with macroscopic geometric information of a contracting trabecula throughout the time course of the twitch (Figures 7 and Figure 8).
Given the ubiquity of brightfield-epifluorescence imaging systems within cardiac research laboratories, the reproduction of these results can be achieved with some minor hardware considerations. Here, we present the image-processing toolkit for combining brightfield-epifluorescence and OCT, which is essential in analyzing the underlying contractile heterogeneity. The integration of the OCT requires an unobstructed optical path, while the gated imaging requires an external trigger line between the stimulus and both the OCT and brightfield imaging camera, and muscle mounting hooks that are capable of moving the sample throughout the measurement chamber. The required post-processing software and methods are freely available. In particular, the segmentation software used, WEKA14, is open-source. The technique of markerless tracking of material points8, sarcomere length, gated volumetric imaging10, and mesh generation codes are likewise accessible and can be made available on request from the corresponding author.
Muscle viability, optimal loading of Fura-2, and image focus are the three pillars that form the foundations of a successful experiment. Using a dissection solution containing BDM to prevent contracture, transportation of the muscle in a syringe, continuous oxygenation of the solution, and preparing new experimental solutions on the day of an experiment, all contribute to a high muscle viability rate. Before loading the trabecula with Fura-2AM, autofluorescence must be collected for each condition one is interested in studying as it can have a significant effect on the measured Ca2+ transient15. Oxygenation of Fura-2AM loading solution is complicated by the necessary inclusion of the surfactant pluronic-F127 to aid dye loading. To combat the resultant excess bubble formation caused by this surfactant, a small drop of anti-foam in the loading solution allows the user to increase the oxygenation rate, thereby improving the chance that the trabecula maintains functional viability throughout the loading process. Finally, the imaging focus must be uniform along muscle length to maximize the signal to noise ratio of the brightfield and fluorescence information.
There are two limitations to consider with the methods presented here. First is the spatial resolution of the fluorescence microscope. While the spatial resolutions of the OCT and brightfield imaging are high, the resolution of the fluorescence microscope is limited to the integral of the fluorescence from the volume captured within a 540 µm by 540 µm imaging window. There is scope to increase the spatial resolution of the fluorescence microscope by using a high-gain charge-coupled device camera, instead of a PMT, to capture the fluorescence signal at the expense of the signal to noise ratio16. Second is the diameter of the trabecula that can be studied in terms of measurable sarcomere length and geometric depth. The windowed-FFT approach for computing sarcomere length exploits the benefit of improved spatial resolution but is associated with reduced robustness (Figure 8D). In cases where turbid or large-diameter trabeculae are to be studied, the resolvability of the FFT will be greatly reduced due to the reduced contrast associated with the sarcomeric banding in larger tissue samples. Likewise, within the OCT, the back-reflections from an imaging depth of greater than 300 µm will be too weak to be resolved during the segmentation stage. Hence, our technique is limited to trabeculae of a diameter less than 300 µm. However, it is not recommended to study large diameter samples as there may be problems with diffusive oxygenation of the muscle core during high rates of stimulation17.
Our method enables the assessment of ionic mechanical function in association with muscle geometry in healthy and diseased muscle, providing a powerful approach to understanding cardiac muscle physiology, pathophysiology, and pharmacology. The image-processing pipeline outlined here extracts data that will be pivotal for garnering a deeper understanding of contractile heterogeneity. One avenue to fully realize the potential of such a rich dataset is in the construction of mathematical models that integrate and interpret these data, and to make predictions that can be tested experimentally using our device.
Declarações
The authors have nothing to disclose.
Acknowledgements
This study was funded by Doctoral Scholarships from The University of Auckland (awarded to JD and MC), Sir Charles Hercus Health Research Fellowships (20/011 and 21/116) from the Health Research Council of New Zealand (awarded to J-CH to KT, respectively), a Doctoral Scholarship awarded by the National Heart Foundation (awarded to AA), Marsden Fast-Start grants (UOA1504 and UOA1703) from the Royal Society of New Zealand (awarded to J-CH and KT, respectively), and a James Cook Research Fellowship from the Royal Society of New Zealand (awarded to AT). The original development of this instrument was funded by a Marsden grant (11-UOA-199) from the Royal Society of New Zealand (awarded to AT and PN).
Materials
| 2,3-Butanedione monoxime | Acros Organics | 150375000 | |
| 20× microscope lens | Nikon | CFI Super Fluor 20× | NA 0.75 |
| 2D Galvanometer | Thorlabs | GVSM002/M | |
| 50-50 beam splitter | Thorlabs | FC850-40-50-APC | |
| 90-10 beam-splitter | Thorlabs | TW850R2A2 | |
| Analogue input module | National Instruments | NI-9205 | Records the PMT signal at 200 kHz |
| Brightfield imaging light source | CoolLED | PE-2 | 660 nm LAM |
| Broadband light source | Superlum | Broadlighter-840 | |
| CaCl2 | Sigma-Aldrich | C4901 | |
| Cameralink card | National Instruments | NI-1429 | Brightfield imaging frame grabber |
| Carbogen 5 | BOC | Gas code: 181 | |
| Condensor lens | Nikon | LWD 0.52 | |
| D(+)-Glucose | Merck | 108337 | |
| DAQ | National Instruments | NI-6259 | Triggers the galvanometer movement |
| Dichroic mirror 1 | Semrock | FF409-Di03 | |
| Dichroic mirror 2 | Semrock | FF552-Di02 | |
| Diffraction grating | Wasatch Photonics | 1200 lines/mm @840 nm | |
| Dimethyl sulfoxide | Sigma-Aldrich | 276855 | |
| Direct-Q 3 UV System | Merck Millipore | ZRQSVR3WW | Distilled water machine |
| Dry bath | Corning | 6875-SB | LSE digital dry bath |
| FIJI | ImageJ | Open-source image processing software | |
| Fura-2AM pentapotassium salt | Thermofisher | F14186 | |
| Hardware FPGA card | National Instruments | NI-7813R | Also controls the triggering of the brightfield capture |
| Heparin | Pfizer | 61024 | |
| HEPES | PanReac AppliChem | A1069 | |
| Inverted microscope | Nikon | TI-DH illumination pillar | |
| Isofluorane | MedSource | VAPDRUGISO250 | |
| KCl | Sigma-Aldrich | P9541 | |
| KH2PO4 | Sigma-Aldrich | P5655 | |
| Line-scan camera | Basler | spL2048-70km | Spectrometer camera |
| Magnetic stirrer | IKA | 3810000 | RCT basic |
| Matlab | Mathworks | Data processing code | |
| MgCl2 | Sigma-Aldrich | M8266 | |
| MgSO4.7H2O | Sigma-Aldrich | M1880 | |
| NaCl | Sigma-Aldrich | 71376 | |
| NaH2PO4.2H2O | Sigma-Aldrich | 71505 | |
| NaHCO3 | Sigma-Aldrich | S6014 | |
| OCT FPGA card | National Instruments | NI-1483R | |
| Oxygen tank | BOC | Gas code: 100D | |
| pH meter | Mettler Toledo | MP220 | |
| Photomultiplier tube | Hamamatsu | H7422-20 | |
| Powerload | Thermofisher | P10020 | |
| Superluminescent diode | Broadlighter | D-840 | |
| Transimpedance amplifier | Custom | ||
| Tris(hydroxymethyl)amino-methane | Sigma-Aldrich | 252859 | |
| Wistar rat | Vernon Jansen Unit | 8 – 10 weeks | |
| Xenon arc lamp | Sutter Instrument | DG-4 | Lambda DG-4 |
Referências
- Han, J. -. C., et al. Energetics of stress production in isolated cardiac trabeculae from the rat. American Journal of Physiology. Heart and circulatory physiology. 299 (5), 1382-1394 (2010).
- Ter Keurs, H. E. D. J., Rijnsburger, W. H., Van Heuningen, R., Nagelsmit, M. J. Tension development and sarcomere length in rat cardiac trabeculae. Evidence of length-dependent activation. Circulation Research. 46 (5), 703-714 (1980).
- Shen, X., Cannell, M. B., Ward, M. L. Effect of SR load and pH regulatory mechanisms on stretch-dependent Ca2+ entry during the slow force response. Journal of Molecular and Cellular Cardiology. 63, 37-46 (2013).
- Dowrick, J. M., et al. The slow force response to stretch: Controversy and contradictions. Acta Physiologica. 226 (1), 13250 (2019).
- Stuyvers, B. D. M. Y., Miura, M., Ter Keurs, H. E. D. J. Diastolic viscoelastic properties of rat cardiac muscle; involvement of Ca2+. Advances in Experimental Medicine and Biology. 430, 13-28 (1997).
- Tang, E. J. L. P., Laven, R. C., Hajirassouliha, A., Nielsen, P. M. F., Taberner, A. J. Measurement of displacement in isolated heart muscle cells using markerless subpixel image registration. Conference Record – IEEE International Instrumentation and Measurement Technology Conference. , (2019).
- Bers, D. M. Cardiac excitation-contraction coupling. Nature. 415 (6868), 198-205 (2002).
- Cheuk, M. L., et al. A method for markerless tracking of the strain distribution of actively contracting cardiac muscle preparations. Experimental Mechanics. 61 (1), 95-106 (2020).
- Lippok, N., Coen, S., Nielsen, P., Vanholsbeeck, F. Dispersion compensation in Fourier domain optical coherence tomography using the fractional Fourier transform. Optics Express. 20 (21), 23398 (2012).
- Cheuk, M. L., et al. Four-Dimensional imaging of cardiac trabeculae contracting in vitro using gated OCT. IEEE Transactions on Biomedical Engineering. 64 (1), 218-224 (2017).
- Ritland, H. N. Relation between refractive index and density of a glass at constant temperature. Journal of the American Ceramic Society. 38 (2), 86-88 (1955).
- Tuchina, D. K., Bashkatov, A. N., Genina, E. A., Tuchin, V. V. Quantification of glucose and glycerol diffusion in myocardium. Journal of Innovative Optical Health Sciences. 8 (3), (2015).
- Taberner, A., et al. A dynamometer for nature’s engines. IEEE Instrumentation and Measurement Magazine. 22 (2), 10-16 (2019).
- Arganda-Carreras, I., et al. Trainable Weka Segmentation: A machine learning tool for microscopy pixel classification. Bioinformatics. 33 (15), 2424-2426 (2017).
- Jiang, Y., Julian, F. J. Pacing rate, halothane, and BDM affect fura 2 reporting of [Ca2+](i) in intact rat trabeculae. American Journal of Physiology – Cell Physiology. 273 (6), 2046-2056 (1997).
- Miura, M., Boyden, P. A., Ter Keurs, H. E. D. J. Ca2+ waves during triggered propagated contractions in intact trabeculae. American Journal of Physiology – Heart and Circulatory Physiology. 274 (1), (1998).
- Han, J. -. C., et al. Radius-dependent decline of performance in isolated cardiac muscle does not reflect inadequacy of diffusive oxygen supply. American Journal of Physiology-Heart and Circulatory Physiology. 300 (4), 1222-1236 (2011).

