Primary Clarification of CHO Harvested Cell Culture Fluid using an Acoustic Separator
概要
Presented here is a protocol for the primary clarification of CHO cell culture using an acoustic separator. This protocol can be used for the primary clarification of shake flask cultures or bioreactor harvests and has the potential application for continuous clarification of the cell bleed material during perfusion bioreactor operations.
Abstract
Primary clarification is an essential step in a biomanufacturing process for the initial removal of cells from therapeutic products within the harvested cell culture fluid. While traditional methods like centrifugation or filtration are widely implemented for cell removal, the equipment for these processes have large footprints and operation can involve contamination risks and filter fouling. Additionally, traditional methods may not be ideal for continuous bioprocessing schemes for primary clarification. Thus, an alternate application using acoustic (sound) waves was investigated to continuously separate cells from the cell culture fluid. Presented in this study is a detailed protocol for using a bench-scale acoustic wave separator (AWS) for the primary separation of culture fluid containing a monoclonal IgG1 antibody from a CHO cell bioreactor harvest. Representative data are presented from the AWS and demonstrate how to achieve effective cell clarification and product recovery. Finally, potential applications for AWS in continuous bioprocessing are discussed. Overall, this study provides a practical and general protocol for the implementation of AWS in primary clarification for CHO cell cultures and further describes its application potential in continuous bioprocessing.
Introduction
A critical step in a biomanufacturing process involving secreted therapeutic proteins is the removal of biomass from harvested cell culture fluid (HCCF). Traditionally, biomanufacturers have adopted centrifugation followed by depth filtration as their primary clarification methods in the production of monoclonal antibodies1. However, centrifugation may lead to high shear stress on the cells, resulting in increased cellular debris in the HCCF. This can potentially lead to filter fouling during filtration and result in extra contaminants postfiltration that can subsequently reduce downstream chromatography efficiency1,2,3. Furthermore, the customization of the centrifuges for a certain process can be costly and may require additional connections to clean-in-place and sterilize-in-place systems that may also be a limiting factor for scalability. The use of depth filters can compensate for the limitations of the centrifugation and also take advantage of single-use technology4. However, depth filters are primarily used as secondary clarification because they cannot withstand high cell culture densities5. Alternatively, tangential flow filtration (TFF) cell retention devices have been employed to mitigate shear stress but may experience challenges such as membrane polarization and poor harvest yields6. The above issues arising from the use of centrifugation plus depth filtration or TFF creates an opportunity for the improvement of the primary clarification process of HCCF.
Acoustic separation was introduced as a technology that can be utilized for harvesting secreted proteins from cell cultures with high-quality protein products7,8. Acoustic separation is achieved through the propagation and reflection of multidimensional standing waves that interact with suspended fluids and retained particles9,10. These particles experience three forces: fluid drag, gravity, and acoustic radiation. When each of the forces are equally opposed to each other, reaching equilibrium, the particles are suspended and trapped within the ultrasonic standing wave10. In a cell culture suspension, cells are held within this pressure node plane of standing waves, the node grows as cells coalesce, and eventually these clusters of cellular nodes fall from the gravitational force9. These sedimented cells are then removed from the media, which allows for the clarified media to be pumped out for further downstream processing. The utilization of ultrasonic waves as a separation method has started to translate into biological applications ranging from separation of lipid particles and red blood cells11 to mammalian perfusion cell culture12. With its relative capabilities to reduce costs, labor, and cellular stress by avoiding centrifugation, depth filtration, or TFF, biomanufacturers are exploring the potential applications of using acoustic separation.
This study provides a general protocol for operating a benchtop acoustic wave separator (AWS) for clarification of CHO cell culture, presents representative data, and demonstrates how to achieve effective cell clarification and product recovery.
Protocol
1. Preparation of AWS
NOTE: This protocol was developed using one acoustophoretic chamber. However, the bench-scale AWS has five turbidity probes that can operate 4 acoustophoretic chambers in series if needed.
- Connect the turbidity cables into their respective ports labeled as F, 1, 2, 3, 4 (e.g., turbidity probe 1 in Figure 1c and port 1 in Figure 2a) and the chamber power BNC cables to the back of the AWS system labeled as 1, 2, 3, 4 (Figure 2b).
NOTE: Do not connect the other end of the chamber power BNC cable (Figure 3c) to the back of the acoustophoretic chamber (Figure 3d) until step 2.6 when the chamber is filled with fluid. If the chamber power is turned on with no fluid in the chamber, it will damage the piezo transducer in the chamber and no longer function. - Insert the turbidity probes into the turbidity meter and thermometer housing and tighten the screws (Figure 1c and Figure 3).
- Connect the feed tubing to the input of the feed turbidity port (Figure 4a) via the feed pump (Figure 1b to 1c).
- Connect the y-tubing from the output of the feed turbidity port (Figure 4b) to the inlet ports of the acoustophoretic chamber (Figure 4c).
- Connect the stage1 tubing from the waste port of the acoustophoretic chamber (Figure 4d) via the stage1 pump to a cell collection vessel (Figure 1d via 1e to 1f).
- Connect the tubing from the permeate port of the acoustophoretic chamber (Figure 4e) to the input of probe1 turbidity port (Figure 4f).
- Connect the harvest tubing from out of the probe1 turbidity port (Figure 4g) to a product collection vessel (Figure 1c to 1g).
2. Prime the system with HCCF
NOTE: This protocol was developed using CHO-K1 cells cultured in chemically-defined medium (ActiCHO P with 6 mM L-glutamine) producing the model IgG1 monoclonal antibody VRC0113 and may need to be adjusted for other cell lines and products. The HCCF used in this protocol was obtained at the end of 7–8 days of CHO-K1 cultures from a shaking flask or bioreactor process.
- Turn on the AWS by turning on the power switches on the back and front of the AWS.
- Turn on the computer and double-click the desk icon for the associated software (see Table of Materials). From the “Readings” panel, press the “Start Test” button to initiate data recording (Figure 5). Once data recording is initiated, all data collected will be recorded in an exportable spreadsheet until the test is stopped.
- Connect the feed tubing end into the HCCF vessel being stirred.
- Start the feed pump by entering the pump rate on the “Controls” screen within the “Feed Pump Image” and press “Enter” on the keyboard. Ensure that the “Pump Direction Arrow Icon” (clockwise or counterclockwise) is correctly selected in the gray box to the right of the Feed Pump Image to pump HCCF from the vessel into the acoustophoretic chamber. Click on the “Triangle Icon” next to the words “Turn ON” within the gray box under the Feed Pump Image to “Start” the pump (Figure 6a).
NOTE: The maximum pump rate is 10 L/h (167 mL/min), but it is recommended that the nominal flow rate, 60 mL/min, be used for this step to quickly fill the tubing and chamber without risking overfilling the chamber prior to beginning the separation. - Monitor the feed turbidity measurements by observing the “Percent Reduction Panel” (Figure 5c) during the filling of the acoustophoretic chamber. The turbidity values will remain consistent during the loading of the chamber if the HCCF is being mixed sufficiently in the HCCF vessel.
- Once the liquid is above the piezo transducer at the back of the acoustophoretic chamber, press “Turn OFF” within the gray box under the Feed Pump Image to stop the pump. Connect the BNC power cable (Figure 3c) to the acoustophoretic chamber (Figure 3d).
NOTE: The holdup volume of each acoustophoretic chamber is around 190 mL.
3. Operation of AWS
- Once the acoustophoretic chamber is filled and the BNC power cable is connected to the back of the acoustophoretic chamber, change the rate of feed pump to the desired operating rate (Figure 6a and Table 1). Several feed pump rates should be tested to identify the ideal operating parameters for a given process.
- Turn on the stage1 piezo power by sliding the bar in the power module to 10 W (Figure 6d) and pressing the “Turn ON” icon on the right side of the Stage 1 box (Figure 6c). As suggested by the manufacturer, use 10 W, the recommended power setting for CHO cells. This will generate a fixed frequency of 2 MHz for operation. After several seconds, the cells will start to visibly clump at the wave nodes in the acoustophoretic chamber (Figure 7a).
- Once the cells begin to settle to the bottom of the acoustophoretic chamber (Figure 7b), start the stage1 pump with an appropriate rate based on the cell density and feed pump rate (Figure 6b). Based on the manufacturer’s optimization and steady-state operation spreadsheet, the stage1 pump rate can be calculated based on the packed cell mass and feed flow rate using the following equation

- To calculate packed cell mass, tare a scale with an empty 15 mL tube (or other tube compatible with centrifugation). Fill the tube with feed material and record the total weight of the tube with feed. Centrifuge the tube for 10 min at 3,700 x g. Decant the supernatant into a separate container. Measure the weight of the tube with the cell pellet. The packed cell mass percentage of the feed material = (decanted tube weight/filled tube weight) x 100%.
- Monitor the turbidity profile of stage1 turbidity as the overflow from the acoustophoretic chamber enters the turbidity probe1 (Figure 8).
- As the cell separation continues, cell removal efficiency
 will increase.
 - In addition, monitor the temperature difference between feed and stage1 as it will increase as the cell separation continues (Figure 9). The temperature may rise when higher cell density feed is used but can generally be reduced by altering the feed flow rate.
NOTE: When using multiple acoustophoretic chambers, one can sequentially connect the tubing from the previous acoustophoretic chamber via turbidity probes to the input of the current acoustophoretic chamber. In addition, one can connect stage tubing from the bottom of the acoustophoretic chambers via stage pumps to cell collection vessels. A total of four acoustophoretic chambers can be connected in series for optimal cell removal efficiency if necessary.
4. Ending AWS
- When the run is over, stop the feed and stage1 pump by pressing Turn OFF within the gray box under the feed pump and stage1 pump images, respectively, to stop the pumps.
- Turn off the power to the chamber by pressing Turn OFF on the right side of the Stage 1 box and disconnect the BNC power cable.
- Take the product harvest material collected for further clarification and purification procedures, such as depth filtration and chromatography methods. Discard the cell harvest material.
- Drain the remaining fluid in the acoustophoretic chamber by placing the waste tubing into an empty vessel, disconnecting the tubing from the acoustophoretic chamber inlet and permeate ports and releasing the waste tubing from the pump head.
- Reconnect the tubing, place the waste tubing back into the pump head, and flow through DI water from the end of feed tubing using a feed pump rate of 60 mL/min and stage1 pump rate of 60 mL/min. Continue for 15–20 min. Discard the flow through.
- Pump 70% isopropyl alcohol (IPA) through the tubing and the chamber using the feed pump for 15–20 min. Discard the flow through.
- Repeat cleaning procedure with DI water to clear the tubes and the chamber by using the feed pump for 15–20 min. Discard the flow through.
- Disassemble the tubing from the turbidity probes and acoustophoretic chambers and clean the area with 70% IPA.
- Disassemble the turbidity probes and clean inside the turbidity probes with 70% IPA. Let all parts air dry and then reassemble for the next use.
NOTE: The acoustophoretic chambers are manufactured for single use but can be reused if handled and cleaned properly as described in this protocol.
Representative Results
As described in the protocol, the AWS was used to clarify HCCF at a density of 12.4 x 10⁶ cells/mL, as shown in Figure 1. The feed pump was set to 3.5 mL/min (5 L/day), representing a cell bleed rate within the presumed suitable range for a 10–20 L culture. As the HCCF entered the AWS chamber, the turbidity measurements from the feed turbidity probe remained consistent, around 1,000–1,100 NTU, and measurements from the probe1 turbidity probe remained around 40–50 NTU (Figure 8). Using the two measurements, cell removal efficiency

was calculated and averaged 95%. It was found that a turbidity measurement of 40–50 NTU was the minimum turbidity level achievable and thus no further separation from an additional AWS chamber in series was feasible.
While the AWS could separate with high efficiency at lower flow rates, keeping the HCCF for a longer time within the chamber caused temperature increases, which should be a consideration when selecting lower flow rates. Figure 9 is an example of the temperature difference of the HCCF before entering the acoustophoretic chamber and after acoustic separation at a feed flow rate of 3.5 mL/min, which showed a >6 °C increase in temperature due to prolonged time within the acoustic chamber.
Another important consideration when running high cell density harvests (i.e., >20 x 106 cells/mL) is the saturation of the turbidity probes. The turbidity measurements for the feed turbidity probe became saturated over 4,400 NTU (Figure 10), which may result in underestimation in the calculation of cell removal efficiency.
To test the effect of different feed rates on the cell clarification, cell removal efficiency was measured at different feed rates. As shown in Figure 11, cell removal efficiency decreased significantly from ~100% to 57% as the feed pump rate increased. In general, the slower the feed pump rate, the better the cell clarification. However, optimization of feed rate is recommended for each application.
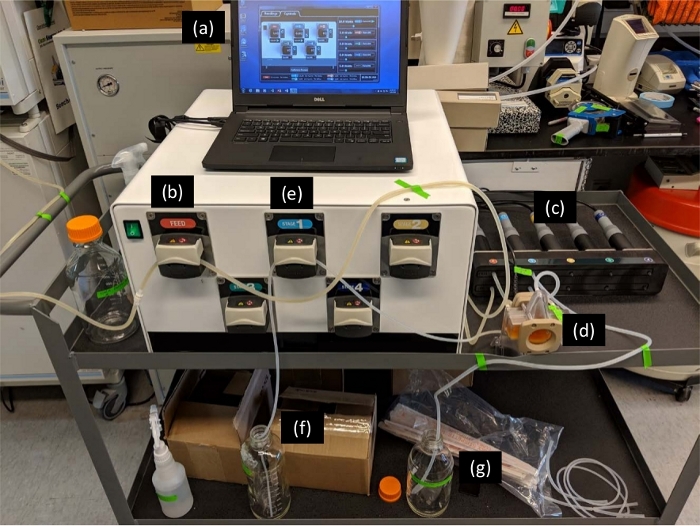
Figure 1: AWS Setup. Once the pumps were turned on with the software (a), the HCCF was channeled in via a feed pump (b) through the feed turbidity probe (c) then to the AWS chamber (d). Inside the chamber, acoustic forces trapped cells from the flow in nodes of waves and caused clumping. Decreased buoyancy caused cells to drop through gravitational force, and cells were removed from the waste port of the acoustophoretic chamber via stage1 pump (e) to a cell harvest bottle (f) while the clarified material exited to the probe1 turbidity probe (c) through the permeate port of the chamber to a product harvest bottle (g). Please click here to view a larger version of this figure.
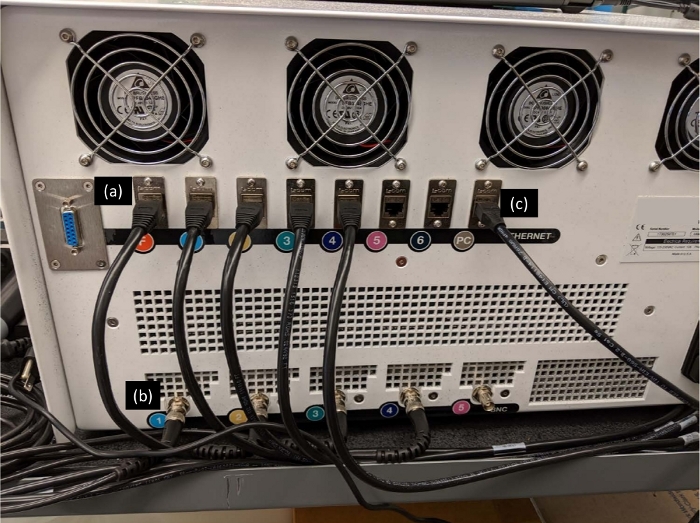
Figure 2: Back of AWS system. The turbidity probes and the chambers are connected to their respective ports at the back of AWS system via turbidity probe ethernet (a) and chamber power BNC (b) cables. Also, the computer is connected via PC ethernet cable (c). Please click here to view a larger version of this figure.
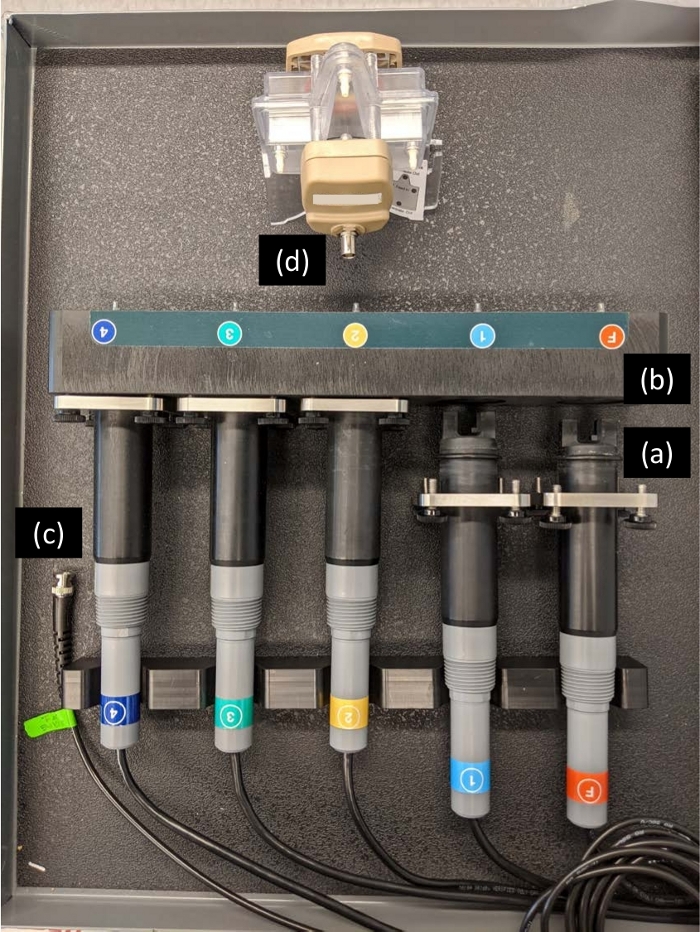
Figure 3: Turbidity probes and housing. Each turbidity probe (a) must be properly inserted to the respective turbidity meter and thermometer housing (b) and tightened with the screws. The chamber power BNC cable (c) should be connected to the back of the acoustophoretic chamber (d) only after the piezo transducer in the chamber is filled with fluid. The probes are indicated as following: F = feed turbidity, 1 = probe1 turbidity, and 2, 3, and 4 are unused probes (or can be used to serialize the procedure). Please click here to view a larger version of this figure.
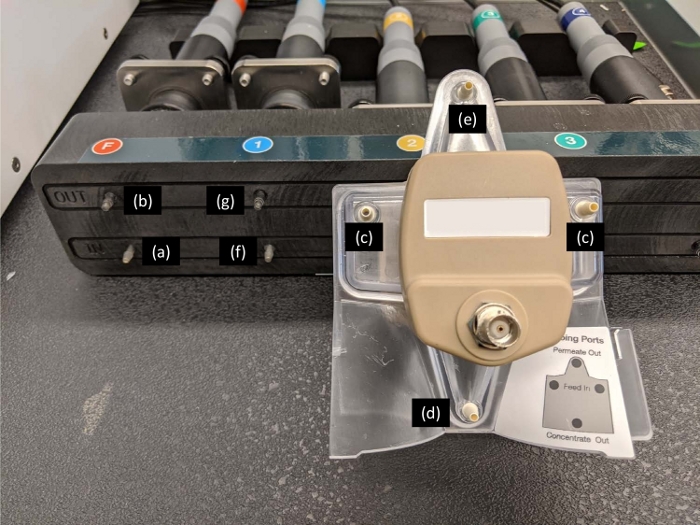
Figure 4: Connection between the turbidity housing and the acoustophoretic chamber. The feed tubing is connected to the input of feed turbidity port (a) via the feed pump. The output of the feed turbidity port (b) is connected to the inlet ports of the acoustophoretic chamber (c) via y-tubing. The stage1 tubing is connected from the waste port of the acoustophoretic chamber (d) via the stage1 pump to a cell collection vessel. The permeate port of the acoustophoretic chamber (e) is connected to the input of probe1 turbidity port (f). The harvest tubing is connected from out of the probe1 turbidity port (g) to a product collection vessel. Please click here to view a larger version of this figure.
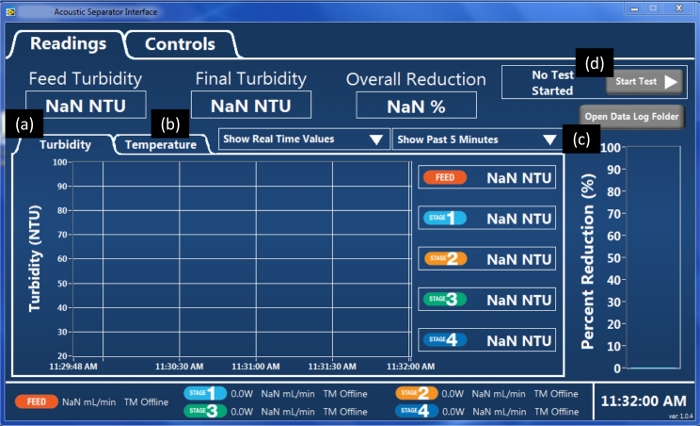
Figure 5: Readings panel in the Acoustic Separator software. The program has two panels, “Readings” and “Controls”. Within the “Readings” panel, turbidity (a), temperature (b), and percent reduction (c) are monitored. To initiate the data recording, the “Start Test” button (d) needs to be clicked, which will change the button’s color to green. Please click here to view a larger version of this figure.
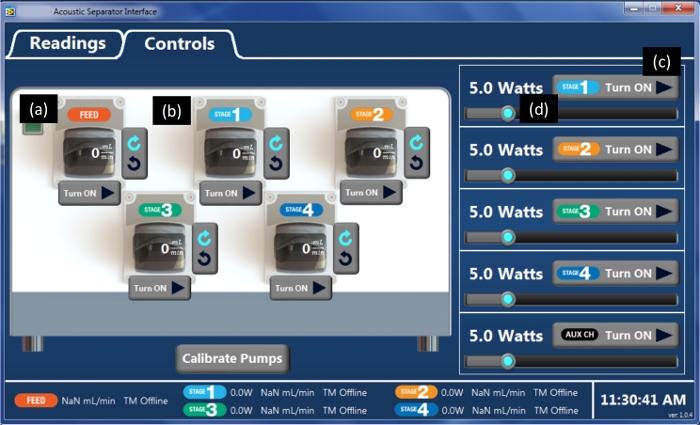
Figure 6: Controls panel in the program. Within the “Controls” panel, the pumps can be turned on or off, and the rate of pumping can be changed for feed (a) and other stages (b). Also, the chamber power on the piezo transducer can be turned on or off (c) and be changed with a slide bar (d). The experiments used 10 W, because it is the recommended power setting for CHO cells as recommended by the manufacturer. Please click here to view a larger version of this figure.
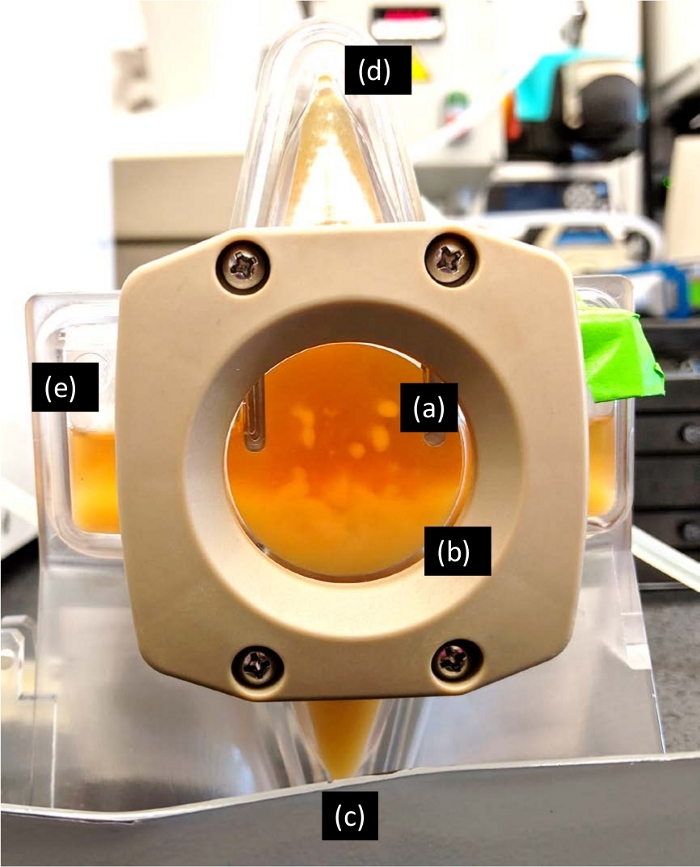
Figure 7: AWS Chamber. Once the cells were inside the chamber, the acoustic forces trapped cells in nodes of waves and caused cells to cluster (a). These cell clusters increased in size until they lost their buoyancy and eventually settled down by gravitational force (b). Next, the settled cells were removed from the waste port of the acoustophoretic chamber via stage1 pump to a cell harvest bottle (c). The product exited the chamber through permeate port (d) while HCCF continuously filled the chamber via inlet ports (e). Please click here to view a larger version of this figure.
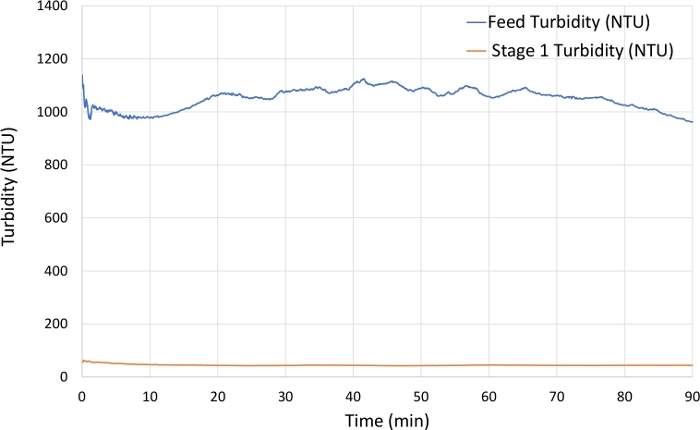
Figure 8: Turbidity measurements for a 12 x 106 cell/mL CHO cell culture with a feed pump rate of 3.5 mL/min. Feed turbidity (blue) was approximately 1,000 NTU and permeate exiting the stage 1 turbidity meter (orange) was 40–60 NTU. Please click here to view a larger version of this figure.
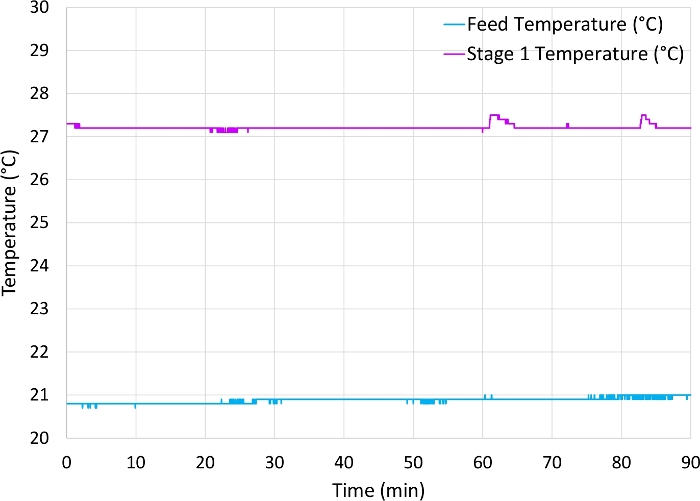
Figure 9: Temperature measurements for a 12 x 106 cell/mL CHO cell culture with a feed pump rate of 3.5 mL/min. Feed temperature (blue) was approximately 21 °C and permeate exiting the stage 1 turbidity meter (orange) was approximately 27 °C. Please click here to view a larger version of this figure.
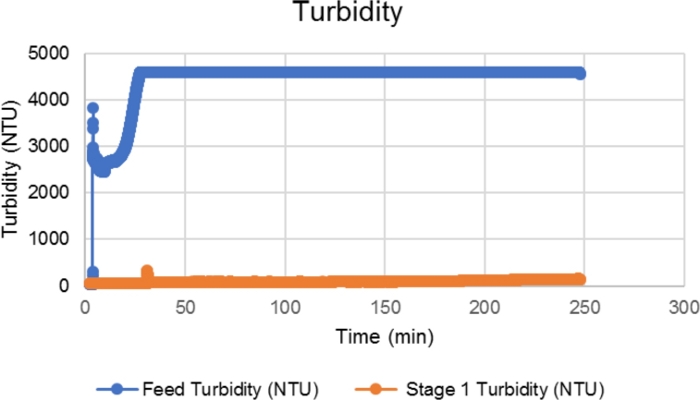
Figure 10: Turbidity measurement example for a high cell density sample. When the cell density was >20 x 106 cells/mL, the feed turbidity measurement was saturated at the maximum value of 4,400 NTU, resulting in underestimation of cell removal efficiency. Please click here to view a larger version of this figure.
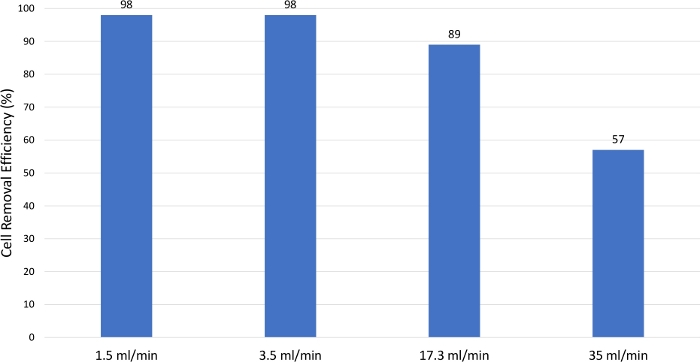
Figure 11: Cell removal efficiency comparison. As the feed rate increased, the cell separation decreased. Hence, as the feed rate increased, the cell clarification efficiency decreased. Please click here to view a larger version of this figure.
| Parameter | Specification |
| Flow Rate | 0 – 10 L/h |
| Pressure Range | 0 – 2 bar (0 – 30 psi) |
| Feed Fluid Temperature | 0 – 40 °C (32 – 104 °F) |
| Operating Temperature | 0 – 40 °C (32 – 104 °F) |
Table 1: Operating Conditions. The recommended operating conditions from the AWS manufacturer for flow rate, pressure range, feed fluid, and operating temperature.
Discussion
Described is a step-by-step protocol for the implementation of a bench-scale AWS in primary clarification of a model monoclonal antibody from HCCF of a CHO cell line. As shown in the representative results, the use of the AWS in primary clarification resulted in effective cell clarification and product recovery. Furthermore, the low level of maintenance and operational requirements and scale-up capability allow broader application potential in primary clarification.
Importantly, the representative results suggest that the feed pump rate is critical for the separation of the cells. In addition, due to limitations in detecting high cell density in the turbidity measurement, working cell density is another factor to consider when using an AWS system. Because the turbidity probe will be saturated when running high cell density feed material, it may be best to calculate cell separation efficiency by measuring the cell densities of the feed material and clarified cell culture fluid offline. With accurate offline measurement of clarification, one process strategy that can be considered in solving these problems is to use multiple chambers in series. Although this protocol is primarily focused on using a single chamber, this system can operate three additional chambers for sequential clarification of the cells that can minimally impact the condition of the cells and result in high product recovery. In addition, other parameters, such as power for AWS and cell removal flow rates, can be further optimized for specific cell types or mode of operation. Overall, an optimization of the operation parameters and strategy using these considerations are recommended prior to implementation of AWS.
Among many application potentials, the use of AWS in continuous bioprocessing is promising. Because AWS can replace centrifugation and drastically reduce the filter surface area14, the use of AWS would enable a constant flow of cell-free material for subsequent filtration and chromatography processes that are compatible with continuous biomanufacturing. Due to this compatibility and the availability of perfusion technology for high cell density (e.g., >50 x 106 cells/mL) and longer culture duration (e.g., >14 days), AWS has the potential to develop a novel continuous cell bleeding strategy in addition to the primary clarification.
In some cases, up to 30% of the protein therapeutic produced is removed during steady-state operation in the cell bleed material15,16. In addition, for the removed monoclonal antibodies to be pooled with the standard harvested material certain quality attributes must be met. When these specifications are not met, the result may be a rejection of material that can impact product yield. To compensate for such product loss, a continuous clarification of cell bleed material using AWS can be implemented at a steady-state condition during a long-term perfusion process17. This strategy may reduce the product loss in the bleed material and utilize more of the protein produced. In addition, cells after the continuous clarification using AWS could potentially be added back into the bioreactor if desired for higher cell density and productivity. Thus, continuous clarification of cell bleed material with AWS may offer an opportunity to increase yield and/or decrease secondary filter surface area in a given process.
In summary, the utility of AWS is not limited to simple primary clarification but may have utility for applications in continuous bioprocessing that may improve manufacturing rate and operational flexibility.
開示
The authors have nothing to disclose.
Acknowledgements
The authors would like to acknowledge Nilou Sarah Arden and Zhong Zhao for their constructive review of this manuscript. The authors would also like to thank Lindsey Brown for essential input during this project. Partial internal funding and support for this work was provided by the CDER Critical Path Program (CA #1-13) and the CDER Manufacturing Science, Innovation Center of Excellence Program (Berilla-CoE-19-49). This project was supported in part by the Internship/Research Participation Program at the Office of Biotechnology Products, U.S. Food and Drug Administration, administered by the Oak Ridge Institute for Science and Education through an interagency agreement between the U.S. Department of Energy and FDA.
This publication reflects the views of the author and should not be construed to represent FDA’s views or policies.
Materials
| Acoustophorectic chamber | Pall | CAS-AC-K1 Cadence acoustic chamber kit | |
| ActiCHO P | GE | SH31025.01 | powder medium |
| AWS | Pall | CAS-SYS (60500101-SP) | |
| Cadence Acoustic Separator Software | Pall | Cadence Acoustic Separator Interface Ver. 1.0.4 | |
| CHO-K1 cells | VRC | VRC01 | |
| Computer | Dell | Latitude 3470 | Windows 7, 64 bit OS |
| Isopropanol (70%) | LabChem | LC157605 | 20L prepped 70% IPA |
| L-glutamine | Corning | 25-005-CV | 200 mM stock solution |
| Masterflex L/S 14 tubing | Cole-Parmer | 96400-14 | peroxide-cured silicone tubing, 25ft |
| Masterflex L/S 16 tubing | Cole-Parmer | 96400-16 | peroxide-cured silicone tubing, 25ft |
| Tubing set | Pall | CAS-FP-K1 Tubing set | |
| Turbidity probe | Pall | CAS-TS-S1 (60500106) |
参考文献
- Roush, D. J., Lu, Y. Advances in primary recovery: centrifugation and membrane technology. Biotechnology Progress. 24 (3), 488-495 (2008).
- Hutchinson, N., Bingham, N., Murrell, N., Farid, S., Hoare, M. Shear stress analysis of mammalian cell suspensions for prediction of industrial centrifugation and its verification. Biotechnology and Bioengineering. 95 (3), 483-491 (2006).
- Shukla, A. A., Suda, E. . Harvest and recovery of monoclonal antibodies: cell removal and clarification. Second ed. 2, 55-79 (2017).
- Felo, M., Christensen, B., Higgins, J. Process cost and facility considerations in the selection of primary cell culture clarification technology. Biotechnology Progress. 29 (5), 1239-1245 (2013).
- Singh, N., et al. Clarification of recombinant proteins from high cell density mammalian cell culture systems using new improved depth filters. Biotechnology and Bioengineering. 110 (7), 1964-1972 (2013).
- Liu, H. F., Ma, J., Winter, C., Bayer, R. Recovery and purification process development for monoclonal antibody production. MAbs. 2 (5), 480-499 (2010).
- Ryll, T., et al. Performance of small-scale CHO perfusion cultures using an acoustic cell filtration device for cell retention: characterization of separation efficiency and impact of perfusion on product quality. Biotechnology and Bioengineering. 69 (4), 440-449 (2000).
- Gorenflo, V. M., Smith, L., Dedinsky, B., Persson, B., Piret, J. M. Scale-up and optimization of an acoustic filter for 200 L/day perfusion of a CHO cell culture. Biotechnology and Bioengineering. 80 (4), 438-444 (2002).
- Chitale, K., Lipkens, B., Presz, W., Desjardins, O. Understanding the fluid dynamics associated with macro scale ultrasonic separtors. 169th Meeting of the Acoustical Society in America. , (2015).
- Dionne, J., McCarthy, B., Ross-Johnsrud, B., Masi, L., Lipkens, B. Large volume flow rate acoustophoretic phase separator for oil water emulsion splitting. The Journal of the Acoustical Society of America. 133 (5), 3237 (2013).
- Dutra, B., et al. A Novel Macroscale Acoustic Device for Blood Filtration. Journal of Medical Device. 12 (1), 0110081-0110087 (2018).
- Lipkens, B. E. M., Ross-Johnsrud, B., Presz, W. M., Chitale, K., Kennedy, T. J., Winiarski, L. Acoustic perfusion devices. US patent. , (2017).
- Wu, X., et al. Rational design of envelope identifies broadly neutralizing human monoclonal antibodies to HIV-1. Science. 329 (5993), 856-861 (2010).
- Shirgaonkar, I. Z., Lanthier, S., Kamen, A. Acoustic cell filter: a proven cell retention technology for perfusion of animal cell cultures. Biotechnology Advances. 22 (6), 433-444 (2004).
- Wolf, M. K. F., et al. Improved Performance in Mammalian Cell Perfusion Cultures by Growth Inhibition. Biotechnology Journal. 14 (2), 1700722 (2019).
- Lin, H., Leighty, R. W., Godfrey, S., Wang, S. B. Principles and approach to developing mammalian cell culture media for high cell density perfusion process leveraging established fed-batch media. Biotechnology Progress. 33 (4), 891-901 (2017).
- Emily, B., et al. Primary clarification of very high cell density cell culture harvest by enhanced cell settling. BioProcess International. 8, 32-39 (2010).

