Quantification of Cerebral Perfusion using Laser Speckle Imaging and Infarct Volume using MRI in a Pre-clinical Model of Posterior Circulation Stroke
Summary
A canine model of LVO stroke was utilized to develop laser speckle imaging to monitor cerebral perfusion in real-time. Diffusion-weighted MRI was optimized to image infarct volume utilizing a high b-value, enabling ADC and MRA, correlated with DSA at the time of stroke. Finally, ADC reconstructions correlated with histological findings.
Abstract
Background: Basilar artery occlusion (BAO) is a subset of posterior circulation stroke that carries a mortality as high as 90%. The current clinical standard to diagnose ischemic stroke include computerized tomography (CT), CT angiography and perfusion and magnetic resonance imaging (MRI). Large animal pre-clinical models to accurately reflect the clinical disease as well as methods to assess stroke burden and evaluate treatments are lacking.
Methods: We describe a canine model of large vessel occlusion (LVO) stroke in the posterior circulation, and developed a laser speckle imaging (LSI) protocol to monitor perfusion changes in real time. We then utilized high b-value DWI (b=1800s/mm2) MRI to increase detection sensitivity. We also evaluated the ability of magnetic resonance angiography (MRA) to assess arterial occlusion and correlate with DSA. Finally, we verified infarct size from apparent diffusion coefficient (ADC) mapping with histology.
Results: Administration of thromboembolism occluded the basilar artery as tracked by DSA (n=7). LSI correlated with DSA, demonstrating a reduction in perfusion after stroke onset that persisted throughout the experiment, allowing us to monitor perfusion in real time. DWI with an optimized b-value for dogs illustrated the stroke volume and allowed us to derive ADC and magnetic resonance angiography (MRA) images. The MRA performed at the end of the experiment correlated with DSA performed after occlusion. Finally, stroke burden on MRI correlated with histology.
Conclusions: Our studies demonstrate real time perfusion imaging using LSI of a canine thromboembolic LVO model of posterior circulation stroke, which utilizes multimodal imaging important in the diagnosis and treatment of ischemic stroke.
Introduction
The prevalence of stroke worldwide is almost 25.7 million, the majority of which are ischemic1. Posterior circulation stroke accounts for 20% of all strokes of which basilar artery occlusion is the most severe, approaching 90% mortality1,2. In 1995, recombinant tissue plasminogen activator (rtPA) was the first acute therapy developed for ischemic stroke in patients who presented within 3 hours from stroke onset3. More recently, mechanical thrombectomy has demonstrated benefit in treating acute ischemic stroke in patients who present with large vessel occlusion (LVO), which includes the intracranial portion of the internal carotid artery or the first segment of the anterior and middle cerebral arteries4. None of the recent clinical trials included posterior circulation stroke and its outcomes remain dismal despite utilizing mechanical thrombectomy for basilar artery occlusion5,6.
Advances in assessment techniques in stroke patients have an impact on predicting the chance of functional recovery and survival7. Pre-clinical models of posterior circulation stroke have been previously described8,9,10, however assessing stroke burden and revascularization remain suboptimal. Smaller species such as rodents offer several advantages including ease of genetic manipulation, inexpensive animal purchase, and low per diem housing costs11,12. However, small animal experiments sometimes do not fully represent large animal and human vasculature, physiological conditions, or related inflammatory responses7. Large animals more closely mimic human stroke2,7,13,14. Moreover, serial blood sampling can be performed for blood analysis of thrombotic and inflammatory markers.
In this study, we describe a canine model of basilar artery occlusion verified by digital subtraction angiography (DSA) from the onset of stroke. We utilize laser speckle perfusion imaging (LSI) to monitor perfusion in real time. We then utilize a novel microvascular enhancement algorithm based on laser speckle perfusion imaging (LSI) acquisition as well as a high b-value magnetic resonance imaging (MRI) technique to optimize infarct imaging15. These techniques allow us to monitor and quantify local and global ischemia. Finally, we correlate these imaging findings to histology. Understanding prognosis and the need to study posterior circulation stroke in pre-clinical models is critical in order to improve therapies.
Protocol
All procedures were performed in compliance with the Animal Welfare Act and the Guide for Care and Use of Laboratory Animals (NRC 2011), as approved by the Ohio State University’s Institutional Animal Care and Use Committee (IACUC).
1. Step 1 Animal Preparation and Surgical Protocol A canine model of basilar artery occlusion (BAO) stroke was used as previously described9,10.
- Fast adult beagles (8-13 kg, 14-21 months old) overnight with free access to water.
- Inject, pre-anesthetic, an intramuscular administration of acepromazine (0.2 mg/kg)
- Introduce a 20 gauge catheter into a cephalic vein.
- Induce anesthesia with intravenous administration of ketamine (10 mg/kg) and midazolam (0.025 mg/kg).
- Following anesthetic induction, intubate dogs and mechanically ventilate using constant inhaled anesthesia (2-3% isoflurane).
- Create a 1 cm2 craniotomy window for laser speckle imaging.
- Introduce a 7F arterial sheath into the right femoral artery for access and blood pressure measurement.
- Introduce a 16 gauge angiocatheter into the right femoral vein for blood draws.
- Prepare thromboembolus (blood clot) as previously described16. Briefly, draw and mix 5 mL of canine whole blood with 0.5 g of barium sulfate (Ba2SO4) in a plastic serum blood collection tube while rolling for 30 seconds. Rest the mixture undisturbed for 60 minutes at room temperature before catheter administration.
- Begin recording baseline digital subtraction angiography (DSA) prior to accessing the middle basilar artery. Advance a 4F guiding catheter under fluoroscopic guidance, using a retrograde trans-aortic approach, into the 7F arterial sheath previously placed into the right femoral artery through a vertebral artery to the base of the basilar artery. Inject two milliliters of contrast agent with normal saline to identify the basilar artery.
- Using a surgical scalpel, resect the clot into small pieces with both fibrin-rich and erythrocyte-rich layers16 to load into a 3 mL syringe and inject through the microcatheter into the middle of basilar artery. Allow the clot to stabilize for 10 minutes. Perform a follow up angiogram to verify your desired clot location. Arterial occlusion can be verified by DSA and decreasing cerebral perfusion by laser speckle imaging (LSI).
2. Step 2 Laser Speckle Imaging
- Focus the laser speckle perfusion imaging (LSI) camera on the cranial window. Configure the high resolution laser speckle imaging (LSI) camera system as previously described15.
- Record perfusion with interruptions during performance of angiogram at desired time points. Acquire data from a 1.5 cm x 1.5 cm field of view using a 785 nm wavelength and 80 mW lasers with a sampling rate of 60 Hz at a working distance of 10 cm in this canine model.
- From the real-time perfusion graphs, choose the time-of-interest (TOI) to include lower peaks only to exclude the respiratory motion related artifacts. Average relative perfusion units over a 10 s sampling period using PimSoft v1.4 software. Perform laser speckle contrast analysis (LASCA) as previously described15.
- To optimize the quantification of brain microvasculature in this canine model, record images at 15 frames per second and perform intensity and variance calculations with spatiotemporal averaging over a 5 x 5 pixel area with 5 frames. The overall frame rate for the intensity and variance data was 3 frames per second. Choose the median value of perfusion for each pixel to reduce the effects on the mean of large sudden changes in perfusion readings due to motion from canine respiration. Convert raw data into binary files and process the data into meaningful imaging of the vasculature. Utilize the program re-tooled LASCA algorithm (rt-LASCA) to use the variance of the contrast data over time to determine the locations of vasculature as previously described15.
3. Step 3 Magnetic Resonance Imaging (MRI) and Magnetic Resonance Angiography
- Perform MRI the day before surgery for comparison if desired, then repeat to confirm BAO and again before sacrifice if a therapeutic is to be evaluated.
- Place continuously anesthetized canines head-first in a supine position as previously described in a Siemens Prisma 3 Tesla field strength and 60 cm-diameter bore MRI scanner including a 32 channel head coil as a receiver with enhanced parallel imaging performance to obtain brain images17.
- Perform localizer scans to acquire pilot images of each canine brain before the anatomical imaging begins. The system utilized to obtain the presented data has an integrated imaging system which allows faster scanning in optimal spatial and temporal resolutions. The 80 mT/m gradients generate high-quality T2-weighted, diffusion-weighted images and MR angiograms. Diffusion-weighted imaging (DWI) is sensitive enough and can show more anatomic sub-structure than by conventional structural MRI methods such as T2-weighted images. In this study, MRI was performed 4h after BAO.
- After proper localization, perform T2-weighted gradient echo imaging (Parameters: FOV = 130 mm, Matrix size = 320 x 320, pixel size = 0.3 x 0.3 mm, Slice thickness =3 mm, TR= 4s, FA= 180 degrees, BW =255 Hz/pixel, NEX= 2, TE=75ms, Resolution= 2.4615 pixels per mm) followed by a flow attenuated inversion recovery (FLAIR) imaging to visualize the structure of the brain anatomy.
- Perform magnetic resonance angiography (MRA) to visualize the vascular anatomy and blood circulation measurement. Acquire MRA of the brain covering the head and neck with a time-of-flight-3D (TOF) sequence in transverse view (Parameters: FOV = 129×129 mm, Matrix size = 768 x 768, pixel size = 0.3 x 0.3 mm, slice thickness = 81.59 mm, TR= 25 ms, FA= 18 degrees, BW =185 Hz/pixel, NEX= 1, TE=4.22ms, Resolution = 5.91 pixels per mm). Perform maximum intensity projection (MIP) with 3D color-coded visualization to maximize the signal intensity in the blood vessels. Post-process acquired DICOM images to visualize the blood vessels and to confirm that the basilar artery was occluded.
4. Step 4 Diffusion weighted imaging and stroke volume calculation
- Perform diffusion weighted imaging sequence to detect acute ischemic strokes (Parameters: FOV = 149mm x149 mm, Matrix size = 132 x0x0x 100, pixel size = 0.30mm x 0.30 mm, slice thickness = 4 mm, TR = 4.6s, FA = 90 degrees, BW = 255 Hz/pixel, NEX= 1, TE = 86ms, Resolution= 0.93 pixels per mm). Transfer DICOM images for post-processing.
- Generate apparent diffusion maps (ADC) from DWI images and calculate infarct volumes using OsiriX MD v.5.0 software.
- Trace both the brain hemispheres and infarct areas per slice and multiply by slice thickness to acquire infarct volumes.
- Convert the absolute whole volume to 100 units to calculate the percent stroke volume of each canine.
5. Step 5 Hematoxylin and Eosin staining brain histology
- At time of sacrifice in anesthetized canine, harvest the brain and cut two medial sections 4 mm thick with a sharp scalpel, one section will be used for TTC staining below.
- Fix the 4 mm section in 10% formalin for a minimum of 7 days to allow infiltration throughout the entire section.
- Embed the fixed brain section in paraffin following our protocol17.
- Trim and level each paraffin block (multiple blocks can be stored and processed at the same time).
- Section each paraffin block at 4μm and place cut tissue on a 2" x 3" inch slide.
- Process each slide in Hematoxylin 560 for 8 min, differentiate with 1% acid alcohol for 1s three times with rinsing in tap water.
- Blue each slide with 1% ammonium hydroxide for 1s and rinse for 2s with tap water.
- Dehydrate in 70% ethanol for 1s twelve times, counterstained in eosin for 1 min.
- Dehydrate in 95% for 1s twelve times followed by 100% ethanol.
- Clear in xylene and apply a 2" x 3" inch coverslip with mounting media, removing air bubbles.
6. Step 6 2% 2,3,5-triphenyltetrazolium chloride brain staining
- Place the second 4 mm section which was harvested beside the H&E section into a previously prepared solution containing with 100 mL 2% 2,3,5-triphenyl-2H-tetrazolium chloride (TTC) in pH 7.4 PBS warmed to 37 °C in the dark.
- Incubate in the dark at 37 °C for at least 20 min, flipping the brain section over gently every 5 minutes.
- When the section turns cherry red on both sides, remove the TTC solution and replace with 4% paraformaldehyde in PBS, pH 7.4, to optimize the contrast overnight.
- When the contrast is optimal between white and red staining in the brain (1-3 days), place between clear plastic sheets, dry excess fluid, and scan at high resolution.
- Trace the ischemic regions and whole brain slide to obtain percent infarction in each section as previously described17.
Representative Results
Laser Speckle Perfusion Recording and Imaging: Perfusion recording was performed continuously until the animal was transported to MRI, and again at sacrifice (Figure 1A). Data showed that cerebral perfusion decreased by ~15% to 83 ± 10% at the time point before basilar artery occlusion (pre-BAO). This nominal decline is likely the result of a microcatheter insertion in the distal vertebral artery. After injecting the prepare thromboembolus, the post-BAO perfusion dropped to an average of 33 ± 2.6%, representing a ~67% decline from baseline (Figure 1B). Angiographic observation showed that blood circulation in the basilar artery was patent prior to BAO (Figure 2A) and fully occluded after administration of the autologous clot (Figure 2B). In agreement with the angiograms, laser speckle perfusion imaging (LSI) observed through the cranial window depicted unrestricted perfusion (Figure 2C) in contrast to restricted perfusion after occlusion (Figure 2D). The efficacy of embolization in the BAO model was then verified. For this purpose, the vasculature was visualized and quantified using the rt-LASCA technique15. The brain vasculatures at baseline were clearly observed (Figure 2E) while vasculature was not visualized during occlusion (Figure 2F). Mean real time perfusion (average of 10s recording) was 191.71±20.61 pu at baseline measurement and dropped to 64.71±11.35 pu (only 34% residual flow in a representative dog) at BAO. After injection of an autologous thromboembolus, the cerebellum region was immediately occluded and its territories were no longer visible during DSA analysis.
T2-weighted and FLAIR imaging: T2-weighted MRI is inadequate to detect early acute strokes (Figure 3A)18,19. This was also the case with FLAIR images (Figure 3B). T2-weighted imaging was performed to confirm whether these scans are required in the therapeutic treatment in both pre-clinical and clinical evaluations.
Figure 4. High b-value apparent diffusion coefficient (ADC) mapping enables quantification of acute ischemic stroke volume. Canine MRI was performed on five dogs. Data converted to DICOM images and transferred for post-processing. ADC maps were obtained from two sets of DWI images corresponding to the b-values of 0 and 1800 s/mm2. Representative DWI images (infarct region bright); slice1: A-B: slice2: E-F, and slice3: I-J; and respective ADC maps (infarct region dark) of three adjacent central slices, C-D, G-H, and K-L are shown. The blue color in the color images represents the low signal in the gray scale images and is the infarct region (traced with red dotted curves). (M) Quantification of infarct volume was performed by delineating the lesion borders on DICOM images using OsiriX MD v.5.0 software to calculate the areas. Area of the whole brain and infarct region so obtained were multiplied by the slice thickness (3mm) to get the brain and infarct volumes. Whole brain volume was converted as 100 percent and the infarct volume percent was calculated. Data = mean ± SEM, n=5.
Digital Subtraction Angiography and Magnetic Resonance Angiography: Magnetic Resonance Angiography (MRA) was performed using Siemens’ 3D-time-of-flight (TOF) sequence for high spatial resolution. DICOM image series were reconstructed and maximum intensity projection (MIP) was applied during post processing to visualize the blood vessels from the head and neck to confirm BAO. DSA demonstrated vascular occlusion post-BAO (Figure 5A). MRA images clearly demonstrated the restricted flow through the basilar artery as shown in representative color scale vascular image (Figure 5B).
Histological Correlation with MRI: We traced representative canine brain TTC images (Figure 6A) and MRI images (Figure 6B) to correlate infarct size and revealed a significant Pearson’s Correlation Coefficient of r=0.77 (Figure 6C).
Physiological parameters: Physiological parameters including heart rate (HR), blood pressures (BP) and temperature were monitored throughout the procedure and are critical to ensure physiological surgical procedures and proper interpretation of therapeutic and device testing (Supplementary Table 1). Representative electrocardiograms at baseline (Supplementary Figure S1A) and post-BAO before sacrifice (Supplementary Figure S1B) are shown. Laboratories who perform this model as presented should expect a significant decrease in systolic blood pressure in an acute time frame.
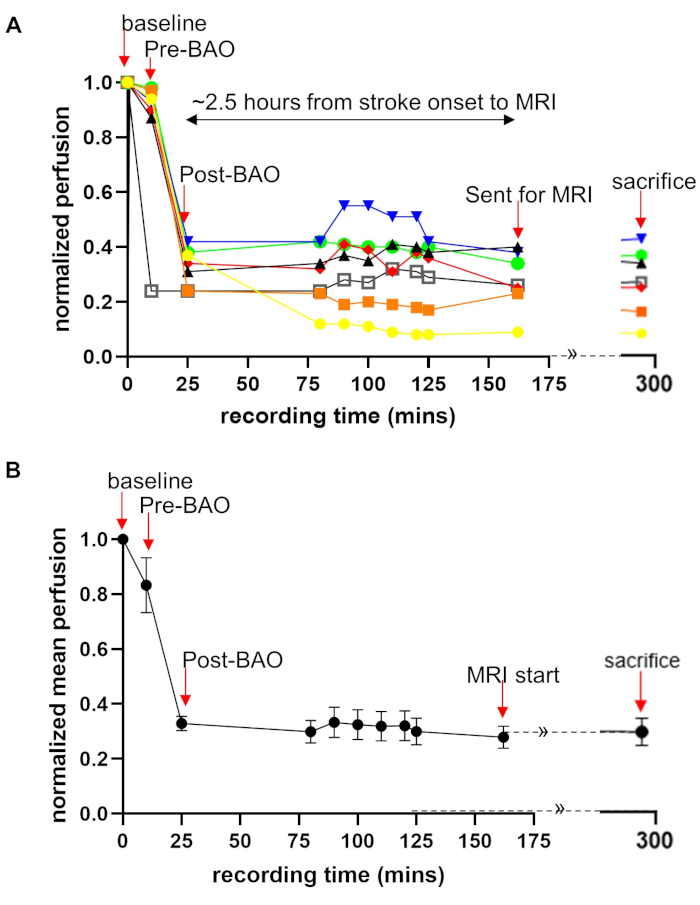
Figure 1: Quantification of laser speckle perfusion data shows restricted blood flow during and after BAO. Laser speckle perfusion recording during the experimental process performed on all seven dogs. Perfusion recording was performed for the time points: baseline, before BAO, clot placement, during onset of occlusion, throughout saline infusion (duration of stroke) after MRI exams. Data were acquired from a cranial window, providing a 1.5 cm × 1.5 cm field of view. The perfusion data were normalized as a percentage of baseline. (A) Perfusion data are shown with color line graphs for all seven dogs which showed that there is an individual difference in perfusion. (B) Mean perfusion fold change over time are shown. Data = mean ± SEM, n = 7. Arrows indicate the time points of interest. LSI data during MRI could not be collected. This part of graph is shown with dotted lines with continuation sign (»). Please click here to view a larger version of this figure.
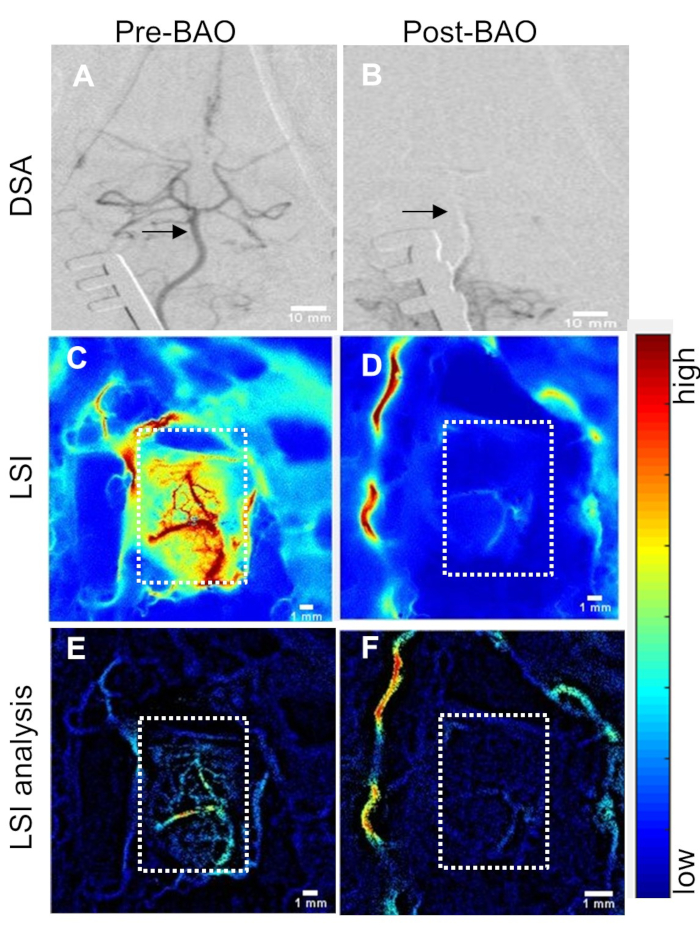
Figure 2: Cerebral perfusion measurement through cranial window correlates with changes in DSA. (A) Baseline (pre-BAO) digital subtraction angiogram (DSA) of the basilar artery and Circle of Willis. Basilar artery indicated by arrows. (B) DSA at post-BAO. (C) Laser speckle perfusion imaging (LSI) at baseline (pre-BAO) and (D) during occlusion after delivery of autologous clot. Post-processed analysis for the detection and enhancement of microvasculature using retooled laser speckle contrast analysis (rt-LASCA) technique at (E) baseline and (F) post-BAO. Color bar code: blue to red = low to high perfusion. Cranial window shown by dotted rectangles. Please click here to view a larger version of this figure.
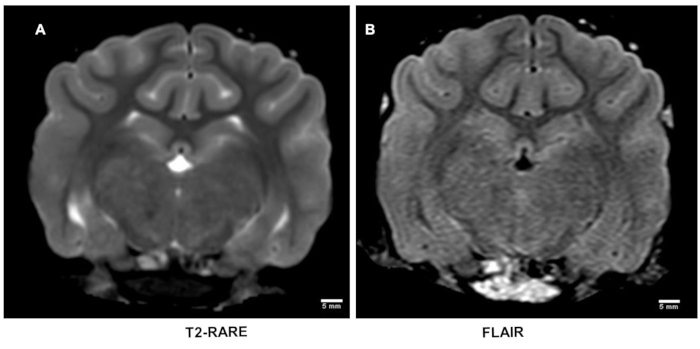
Figure 3: T2-weighted magnetic resonance imaging after stroke. T2-weighted MRI using rapid acquisition of relaxation enhancement (RARE) sequence is inadequately sensitive to detect early acute strokes (A) which was also corroborated on flow attenuated inversion recovery (FLAIR) sequence images (B). Please click here to view a larger version of this figure.
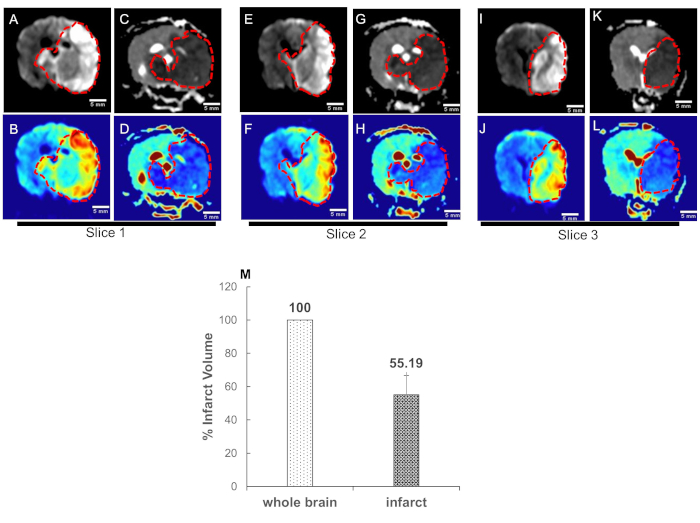
Figure 4: High b-value apparent diffusion coefficient (ADC) mapping enables quantification of acute ischemic stroke volume. Canine MRI was performed on five dogs. Data converted to DICOM images and transferred for post-processing. ADC maps were obtained from two sets of DWI images corresponding to the b-values of 0 and 1800 s/mm2. Representative DWI images (infarct region bright); slice1: A-B: slice2: E-F, and slice3: I-J; and respective ADC maps (infarct region dark) of three adjacent central slices, C-D, G-H, and K-L are shown. The blue color in the color images represents the low signal in the gray scale images and is the infarct region (traced with red dotted curves). (M) Quantification of infarct volume was performed by delineating the lesion borders on DICOM images using OsiriX MD v.5.0 software to calculate the areas. Area of the whole brain and infarct region so obtained were multiplied by the slice thickness (3mm) to get the brain and infarct volumes. Whole brain volume was converted as 100 percent and the infarct volume percent was calculated. Data = mean ± SEM, n=5. Please click here to view a larger version of this figure.
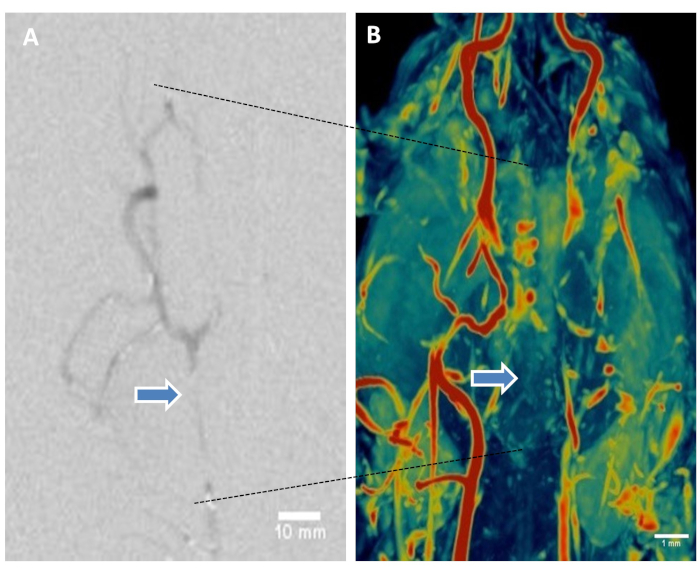
Figure 5: Digital subtraction angiography and magnetic resonance angiography of brain help visualize thromboembolic basilar artery occlusion. (A) Representative DSA showing basilar artery occlusion. (B) Representative canine brain MRA using 3D-time-of-flight sequence. Maximum intensity projection (MIP) volume rendering technique, leveling, filtering, and surface display was performed to create the MR angiograms from the DICOM image series. Color coding using color look-it-up table. Representative image shows restricted flow in basilar artery (arrows). Please click here to view a larger version of this figure.
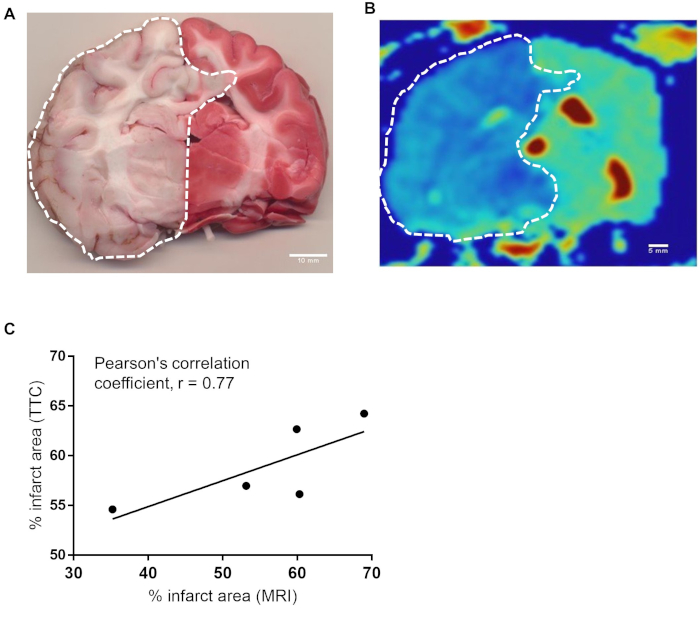
Figure 6: There is a strong correlation between infarct area of histochemical and MRI methods. (A) Representative canine brain section harvested at the time of sacrifice immediately proximal to H&E section stained with TTC 4.5 hours after BAO. (B) ADC map of corresponding brain section from MRI. Infarct area was calculated by delineating the sections of all brains stained in TTC (n=7). Similarly infarct region of one MRI slice from each brains (n=5) were delineated using OsiriX MD v.5.0 software. (C) The data were analyzed using software Prism Graph Pad 8.0. Area from TTC vs MRI were compared for Pearson’s correlation coefficient. Pearson correlation between representative TTC section and MRI section at the same location showed strong correlation, r = 0.77. Please click here to view a larger version of this figure.
Supplementary Figure S1: Physiological data before BAO and at time of sacrifice. Baseline data were compared with post-BAO in all seven dogs. Ages range from 14-21 months and body weights range from 8-13 kilograms. Mean, systole, and diastole blood pressures (BP) are shown. Representative electrocardiographs (ECGs) at baseline (A) and just before sacrifice are shown (B). Please click here to download this figure.
Supplementary Table. Please click here to download this table.
Discussion
The most common causes of posterior circulation stroke include embolism, large-artery atherosclerosis, and small artery disease5. Basilar arterial occlusion (BAO) represents a subset of posterior circulation strokes, carrying significant morbidity and mortality13. In this context, a canine model of acute posterior stroke was utilized and we developed an LSI protocol to monitor perfusion of the occluded region in real time. Laser speckle perfusion imaging was performed through a small cranial window, providing real-time information about a defined region of interest. Perfusion decreased after stroke onset and persisted to the end of the experiment. This window can provide real time information about changes in the perfusion after therapy with thrombolytic drugs or thrombectomy devices. After performing LSI through the cranial window, the perfusion data was further processed to visualize vascular anatomy of the stroke affected region using our rt-LASCA algorithm15. In this study, the posterior circulation occlusion recorded by laser speckle perfusion correlated with intra-operative angiography. The cranial window, although it takes less than 5 minutes to complete, can be modified for the interests of the investigation but the actual size is only slightly larger than the field that will be recorded. Therefore, making the window larger will only incur greater injury to the surrounding tissue and more bleeding, the recording field cannot be expanded by the equipment. Having said that, this method can be used to access thrombolytics, prophylactics, or any drug which may alter cerebral flow and therefore can be moved to interrogate any region where the area can reasonably be accessed with the surgical set-up.
Cerebral infarction in pre-clinical studies has been generally diagnosed on the basis of post-mortem histological staining. Clinically, stroke burden is assessed by MRI20, as it is more sensitive than a non-contrast head CT21. MR diffusion weighted imaging (DWI) sequence paired with an apparent diffusion coefficient (ADC) map is the most sensitive sequence for acute strokes22. On the other hand, the gold standard for vascular imaging for LVO stroke is a cerebral angiogram and should be considered when initial, noninvasive imaging is non-diagnostic or conflicting13. Successful recanalization of LVO is an important predictor of a better outcome after stroke23. Our optimized b-value DWI for the dog was able to detect the acute ischemic lesion within 4 hours post BAO. An optimized b-value is essential to achieve ideal sensitivity and is different depending on what is being studied. The ideal b-value in adult humans is b=1000 s/mm2, in neonates it is b=600 s/mm2. In this canine model, we found ideal DWI at b=1800 s/mm2. ADC maps corresponding to high b-value are more sensitive for hyper-acute ischemic stroke as early as 30 min after stroke onset21. Furthermore, the ADC maps enabled better discrimination of infarct and normal tissue thereby increasing the accuracy of tracing lesion boarder for accurate infarct volume calculation24.
A 3D-time-of-flight (TOF) non-contrast-enhanced method is based on flow related vessel enhancement and has increased signal-to-noise ratio, better spatial resolution, faster acquisition times, and better resistance to intrascan motion artifacts25,26. In fact, better spatial resolution enables more accurate analysis of changes in the vessel patency, particularly with vessel branches in close proximity, and in the pathological settings of stenosis and thrombosis20. In this study, the MRA technique successfully illustrated BAO. In addition, we have developed a Matlab-based program to fuse ADC reconstruction on histology.
Results of the present study in dogs indicated that the use of multimodal imaging platform using DSA, LSI, MRI, MRA and histologically staining techniques become powerful tools to evaluate acute ischemic stroke and provide preclinical assessment of drug and device therapies.
Divulgazioni
The authors have nothing to disclose.
Acknowledgements
This work was supported in part from the Mayfield Education and Research Foundation grant #GRT00049047 and Ohio Department of Services Agency Accelerator Award #TECG20180269 to SMN.
Materials
| 2% 2,3,5-triphenyltetrazolium chloride (TTC in PBS, pH 7.4) | Sigma Aldrich | T8877 | |
| EDTA K3 vacutainers | Becton Dickinson | BD455036 | |
| Eosin | Surgipath | 3801602 | |
| Formalin, neutral buffered, 10% | Richard-Allan Scientific | 5701 | |
| Hematoxylin 560 | Surgipath | 3801570 | |
| HUG-U-VAC positioning system | DRE Veterinary | 1320 | |
| LabChart Software | ADInstruments Inc. | ||
| Laser Speckle Imaging camera | Perimed Inc., Jarfalla, Sweden | PeriCam PSI HR System | |
| Lithium heparin vacutainer, 4.5% | Becton Dickinson | BD 368056 | |
| Matlab | The MathWorks, Inc., Natick, MA | ||
| OsiriX MD v.5.0 software | Pixmeo Inc, Geneva | ||
| Paraformaldehyde 4% in PBS | Alfa Aesar | AAJ61899AP | |
| PimSoft v1.4 software | Perimed Inc. | software that accompanies LSI equipment | |
| Prisma Fit 3 tesla (3T) magnet | Siemen's Diagnostics | ||
| Sodium heparin for injection (to coat blood gas syringe) | NovaPlus | 402525D |
Riferimenti
- Donkor, E. S. Stroke in the 21(st) Century: A Snapshot of the Burden, Epidemiology, and Quality of Life. Stroke Research and Treatment. 2018, 3238165 (2018).
- Kaiser, E. E., West, F. D. Large animal ischemic stroke models: replicating human stroke pathophysiology. Neural Regeneration Research. 15 (8), 1377-1387 (2020).
- National Institute of Neurological Disorders and Stroke rt-PA Stroke Study Group. Tissue plasminogen activator for acute ischemic stroke. New England Journal of Medicine. 333 (24), 1581-1587 (1995).
- Mokin, M., Rojas, H., Levy, E. I. Randomized trials of endovascular therapy for stroke–impact on stroke care. Nature Reviews Neurology. 12 (2), 86-94 (2016).
- Sparaco, M., Ciolli, L., Zini, A. Posterior circulation ischaemic stroke-a review part I: anatomy, aetiology and clinical presentations. Neurological Sciences. , (2019).
- Lekic, T., Ani, C. Posterior circulation stroke: animal models and mechanism of disease. Journal of Biomedicine and Biotechnology. 2012, 587590 (2012).
- Vilahur, G., Padro, T., Badimon, L. Atherosclerosis and thrombosis: insights from large animal models. Journal of Biomedicine and Biotechnology. 2011, 907575 (2011).
- Atchaneeyasakul, K., et al. Large animal canine endovascular ischemic stroke models: A review. Brain Research Bulletin. 127, 134-140 (2016).
- Qureshi, A. I., et al. Randomized comparison of intra-arterial and intravenous thrombolysis in a canine model of acute basilar artery thrombosis. Neuroradiology. 46 (12), 988-995 (2004).
- Boulos, A. S., et al. Tamoxifen as an effective neuroprotectant in an endovascular canine model of stroke. Journal of Neurosurgery. 114 (4), 1117-1126 (2011).
- Doyle, K. P., Buckwalter, M. S. A mouse model of permanent focal ischemia: distal middle cerebral artery occlusion. Methods in Molecular Biology. 1135, 103-110 (2014).
- Wen, Z., et al. The effect of anterior communicating artery flow on neurovascular injury and neurobehavioral outcomes in mice with recurrent stroke. Brain Research. , (2019).
- Demel, S. L., Broderick, J. P. Basilar Occlusion Syndromes: An Update. Neurohospitalist. 5 (3), 142-150 (2015).
- Cai, B., Wang, N. Large Animal Stroke Models vs. Rodent Stroke Models, Pros and Cons, and Combination. Acta Neurochirurgica Supplement. 121, 77-81 (2016).
- Gnyawali, S. C., et al. Retooling Laser Speckle Contrast Analysis Algorithm to Enhance Non-Invasive High Resolution Laser Speckle Functional Imaging of Cutaneous Microcirculation. Scientific Reports. 7, 41048 (2017).
- Kan, I., et al. A novel method of thrombus preparation for use in a swine model for evaluation of thrombectomy devices. American Journal of Neuroradiology. 31 (9), 1741-1743 (2010).
- Huttinger, A. L., et al. Ferric Chloride-induced Canine Carotid Artery Thrombosis: A Large Animal Model of Vascular Injury. Journal of Visualized Experiments. (139), (2018).
- Siemonsen, S., et al. Elevated T2-values in MRI of stroke patients shortly after symptom onset do not predict irreversible tissue infarction. Brain. 135, 1981-1989 (2012).
- Leiva-Salinas, C., Wintermark, M. Imaging of acute ischemic stroke. Neuroimaging Clinics of North America. 20 (4), 455-468 (2010).
- Ishikawa, C., Ito, D., Tanaka, N., Kitagawa, M. Use of three-dimensional time-of-flight magnetic resonance angiography at 1.5 Tesla to evaluate the intracranial arteries of 39 dogs with idiopathic epilepsy. American Journal of Veterinary Research. 80 (5), 480-489 (2019).
- Mohr, J. P., et al. Magnetic resonance versus computed tomographic imaging in acute stroke. Stroke. 26 (5), 807-812 (1995).
- Rosso, C., et al. Diffusion-weighted MRI in acute stroke within the first 6 hours: 1.5 or 3.0 Tesla. Neurology. 74 (24), 1946-1953 (2010).
- Cheng, Q., et al. High b value DWI in evaluation of the hyperacute cerebral ischemia at 3T: A comparative study in an embolic canine stroke model. Experimental and Therapeutic. 12 (2), 951-956 (2016).
- Xu, X. Q., et al. Use of FLAIR imaging to identify onset time of cerebral ischemia in a canine model. American Journal of Neuroradiology. 35 (2), 311-316 (2014).
- Rodriguez, D., Rylander, H., Vigen, K. K., Adams, W. M. Influence of field strength on intracranial vessel conspicuity in canine magnetic resonance angiography. Veterinary Radiology & Ultrasound. 50 (5), 477-482 (2009).
- Bosmans, H., Wilms, G., Dymarkowski, S., Marchal, G. Basic principles of MRA. European Journal of Radiology. 38 (1), 2-9 (2001).

.
