A Basic Positron Emission Tomography System Constructed to Locate a Radioactive Source in a Bi-dimensional Space
Summary
We present a simple but well-constructed Positron Emission Tomography (PET) system and elucidate its basic working principles. The goal of this protocol is to guide the user in constructing and testing a simple PET system.
Abstract
A simple Positron Emission Tomography (PET) prototype has been constructed to fully characterize its basic working principles. The PET prototype was created by coupling plastic scintillator crystals to photomultipliers or PMT's which are placed at opposing positions to detect two gamma rays emitted from a radioactive source, of which is placed in the geometric center of the PET set-up. The prototype consists of four detectors placed geometrically in a 20 cm diameter circle, and a radioactive source in the center. By moving the radioactive source centimeters from the center the system one is able to detect the displacement by measuring the time of flight difference between any two PMT's and, with this information, the system can calculate the virtual position in a graphical interface. In this way, the prototype reproduces the main principles of a PET system. It is capable to determine the real position of the source with intervals of 4 cm in 2 lines of detection taking less than 2 min.
Introduction
Positron Emission Tomography is a non-invasive imaging technique used for obtaining digital images of the inner tissues and organs of the body. Various non-invasive techniques exist that allow one to obtain images and information on the internal workings of a patient such as Computer Axial Tomography (TAC) and Magnetic Resonance Imaging (MRI). Both give good spatial resolution and are additionally used for applications in anatomic and physiologic studies. Although comparatively PET gives less spatial resolution, it provides more information concerning the metabolism occurring in the zone of interest. PET is widely used to obtain functional and morphological information; its main clinical applications are in the fields of oncology, neurology and cardiology. Also, PET images can help physicians give better diagnoses, e.g., establish tumor treatment planning.
The basic working principle of PET systems is the detection of two photons or gamma rays coming from a positron-electron annihilation pair, both flying in opposite directions towards the detectors, which commonly consist of scintillator crystals coupled with PMTs. The scintillator crystals transform gamma radiation into visible light, which travels to a PMT which converts the light signal to an electrical pulse via a photoelectric process. Inside the PMT electronic devices called dynodes are present, which increase the magnitude of the electrical charge before sending it to a read-out system. These two detected photons were created when a positron (positively charged electron) emitted by an isotope fluid, which was injected into the bloodstream of the body, annihilates with an electron in the body. The read-out system measures in coincidence the arrival time of the two back-to-back photons with respect to a time reference and further it substrates both times to obtain the difference. The system uses this time difference to calculate the space position where the radiation source emitted both photons, and thus where the electron-positron annihilation occurred.
Some features of PET systems must be defined to optimize the quality of the image and to increase spatial and time resolution. One feature to consider is the Line of Response (LOR), defined as the distance that the two photons travel after the annihilation process. Another feature to consider is the Time of Flight (TOF). The quality of the images also depends on external features, mainly the bodily organs and the patient's movements during the treatment session1. The isotopes used in PET systems are called Beta+ emitters. These isotopes have a short half-life (on the order of seconds). They are produced in particles accelerators (cyclotrons) when stable elements are bombarded with protons or deuterons causing nuclear reactions. Such reactions transform the stable elements into unstable isotopes, such as C-11, N-13, O-15, F-18 among others2.
There are two types of PET. (1) Conventional: this uses the TOF information only to identify the line along which the annihilation occurred, but it is unable to determine the origin place of the two photons. It requires additional analytical or iterative reconstruction algorithms to estimate this. (2) TOF PET: utilizes the TOF difference to locate the annihilation position of the emitted positron. The time resolution is used in the reconstruction algorithm as a kernel for a localization probability function3.
Our main objective is to demonstrate the primary functions of PET, which is used to locate a radiation source in space. The principal scope of the PET system set proposed here is to provide a basic PET construction guide for the academic public, and to explain, in a simple way, its main properties.
Protocol
1. Preparation of the PET Setup
- Prepare the PMT's coupled with plastic scintillator pieces. Depending on the kind of PMT (size, shape of the photocathode) build an adequate scintillator piece to fit with the photocathode of the PMT.
- Wrap the scintillator pieces with black tape. Leave one side uncovered, as it will be coupled with the PMT light entrance.
NOTE: It is important that these pieces are previously polished to avoid light accumulation losses.
- Wrap the scintillator pieces with black tape. Leave one side uncovered, as it will be coupled with the PMT light entrance.
- Clean the PMT light entrance with alcohol (commercial alcohol concentration of 70%) then apply optical grease to it and the scintillator's uncovered face. Coupled the PMT face with the scintillator and wrap them with more black tape.
- Connect the PMT to the source voltage (a cable is included for every PMT, in this case bias 14 V bias and 0.5 V for voltage control). Identify the signals coming from the PMT by connecting the PMT signal cable to a standard digital oscilloscope channel (a signal cable is also included for every PMT). Observe the variations in amplitude of the signals when turning on/off the light in the lab, to verify there are no light losses. Repeat this step for each of the four detectors, where a detector means scintillator plus PMT.
- Build a coincidence system by placing the scintillator part of one detector above the corresponding part of another detector. Put two NIM (Nuclear Instrument Module) instruments called discriminator and logic unit modules in a NIM crate.
- Connect the output signals from the detectors to the inputs of a discriminator module. Use a logic unit in the AND mode, by selecting this logic case in the logic unit front panel. Connect the two discriminator outputs in the logic unit inputs.
NOTE: AND is a logical operation that selects when two square signals arrive at the same time or in coincidence. - Connect the logic unit output signal in a scaler module (which counts digital signals) to count the events (created by the cosmic rays hitting in coincidence both detectors).
2. Acquiring Signals with PET
- Place both detectors in the opposite corners of the square area defined before, so they face each other, and are 20 cm apart, and do the same exercise as 1.4 and 1.5, but this time, instead of using cosmic rays (cosmic rays served as a provisional natural radioactive source), use the Na-22 radiation source.
- Place the radioactive source in a middle distance between both detectors and make data acquisition through the scaler module. The system set up and the schematic arrangement of the logic block used to obtain a coincidence can be seen in Figures 1, 2, and 3.
- Measure the time difference of the arriving signals by connecting the two discriminate PMT's outputs and the coincidence output in the oscilloscope. Each of the three signals goes to an oscilloscope input; there will be three square signals in the oscilloscope screen. With the horizontal scale (time scale) measure the time difference of the two discriminate signals.
NOTE: When the radioactive source is directly in the middle between both detectors there will be little or no separation or time difference between the square discriminate signals on average, and when the radioactive source is out of the center and close to one of the PMT then there will be time difference on average. - Send these timing signals to one of the eight channels of the CAMAC (Computer Automated Measurement And Control) TDC (Time to Digital Converter) module. To do this, connect the output of logic AND to the TDC input call "START" then connect the detector discriminate outputs to the TDC inputs which are called "STOP". The AND signal has to be delayed through a Delay Module by some nanoseconds in order for this signal to arrive before the other two STOP signals (see Figure 4).
- Calibrate the TDC counting units vs. time showed by the oscilloscope through a software program (see steps in Section 3). Do this calibration by using the distance separation between the radioactive source and one of the detectors, measuring the average time difference (step 2.3) of every position. Establish a software communication between the different modules and the computer via a standard bus GPIB (General Purpose Instrumentation Bus) to do this calibration.
3. Building the Virtual Instrument Interface
- Download and use a LabView software or any similar software.
NOTE: To work with Labview, it is necessary to have some knowledge of the "G programming language". In this language, no code has to be written, and all the actions performed can be done from a software tool palette. An easy guide with practical examples can be found in the help tool. - Select the array utility from the front panel tool palette (programming variables containers) to save the TDC output data.
NOTE: The "front panel" is the graphic interface of the virtual instrument to the user and the "block diagram" is used for software programming. - Plot the data acquisition (time data from TDC) by selecting a logic instrument from the plots menu. Identify the plots data related with every position of the source. Do this by varying the source distance from the detectors line by some centimeters.
- Take the mean of the data using the statistical functions (mean) from the mathematical menu tool, and choose an interval of values centered in the mean. Then, according to the programming logic followed, use the necessary tools from the array menu to remove all data with values outside this interval.
- Select indicators from the block diagram tool palette to show the number of data stored in each array and identify a few containers with the largest number of data stored.
- Get the mean of the data in each array selected in the step 3.5 and use this information to establish a set of time intervals values for each source position using for this the LabView block diagram tool palette.
- Select an array of indicators from the front panel tool palette to store the mean obtained in step 3.6 for a sequence of measurements.
- Select a case structure from the block diagram tool palette to relate each position with its respective interval from step 3.7, and associate each interval to one virtual LED in an array from the front panel tool palette.
- Notice the time each signal takes to arrive to the TDC channels: when the radioactive source is moved from the middle closer to one detector, observe a movement of the virtual source in the programming array of LEDs (see Figure 5) moving to the right in the computer.
- Include a control (variable programming element) from the front panel tool palette for the total time acquisition.
NOTE: The efficiency of the positioning will depend on this control time tool: the more time the acquisition takes, the more precisely the virtual object simulating the radioactive source will give the correct position.
4. Graphical Results
- For calibration purposes, place the source at any intermediate position relative to one of the coupled pairs of detectors. Take measurements for 30 min, and with the data acquired, take the average of the values accumulated every 2 min. Repeat this process for different source positions and plot the average value from each detector in all positions (see Figures 6 and 7). The differences of the detectors values are plotted in Figure 8.
- To obtain better results, select two detectors having similar data values to form a couple. To test this, put the PMT control voltage to its lower value, in this case 0.5 V. Start measuring the number of detected events with the scaler module for a fixed time by connecting the detector output to the scaler input. Increase the voltage by 0.01 V and measure again. Repeat this process to reach the maximum possible control value, in this case 0.9 V.
- Plot the number of detected events versus the control voltage in semi logarithmic scales (see Figure 9). Couple the pairs of detectors having similar distributions.
- To test the sensitivity of the system, place the radioactive source in some equal spacing intermediate positions along the lines, in this case there are five. Acquire data for 5 min in each position, and plot the mean and median of the values obtained for each detector independently (see Figures 10 and 11).
Representative Results
Two main results are achieved with this PET system. First: an efficient synchronization between visual effects of the virtual radioactive source when moving the real radioactive sample. With this program, users have control of the acquisition time, the number of repetitions in the same position, the variation of the interval around the acquisition data mean, among others. Second: the construction of a simple structure of coincidence logic to obtain the time difference between two signals, converting this time difference to distance to calculate the final position of the source.
In one detection line, it is enough to use only a logic module 'AND', to discriminate the signal coming from a coincidence or external noise. In this case there are two detection lines which both require their logic modules. If the number of detectors increases, it is necessary to include another detection line and also include "OR" modules (see Figure 3).
Another feature to take into account is the comparison between the TOF PET system and the conventional PET system located in all positions every 5 min. Figures 6 and 7 show the response of the system measured for a couple of detectors for different positions. For each position of the source, there is a plot of the TDC response. For each set of measurements, linear behavior is expected, and allows one to establish a relation between position and time. Even though there are variations or overlapping, there is a stability improvement as long as the acquisition time increases.
Figures 10 and 11 show the advantages when taking the difference of the accumulated data average to obtain a better calibration of the system. Using the average, the results become more stable, and the separation of the TDC units increases giving a better positioning of the virtual radioactive source. Our final result is obtained by repeating 30 measurements within 2 min. To distinguish the two lines of acquisition, they were called i-j and e-f lines. For the acquisition line i-j, an average efficiency around 90% is found, while the line e-f reached around 87%. For the whole system, the efficiency obtained was around 85%.
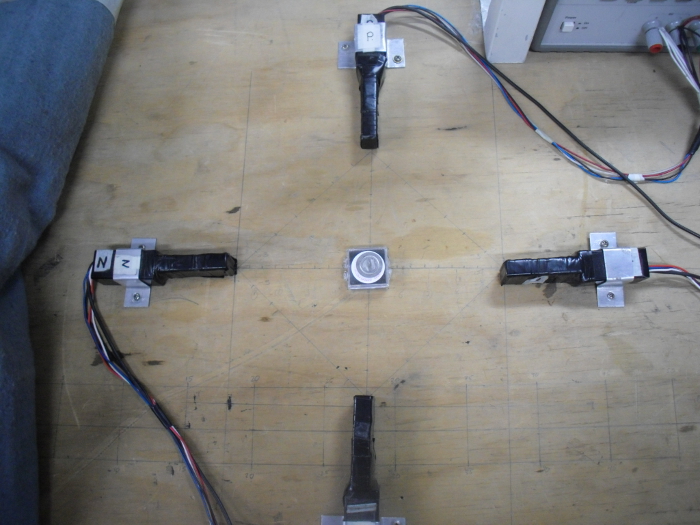
Figure 1. Arrange of PMTs. A two-Dimensional set-up of 4 PMTs is shown. Each PMT is positioned 10 cm from the geometrical center. In the center of the image, the Na-22 radioisotope produces a pair of back-to-back photons. By detecting these photons in coincidence, the radioactive source can be located. Please click here to view a larger version of this figure.
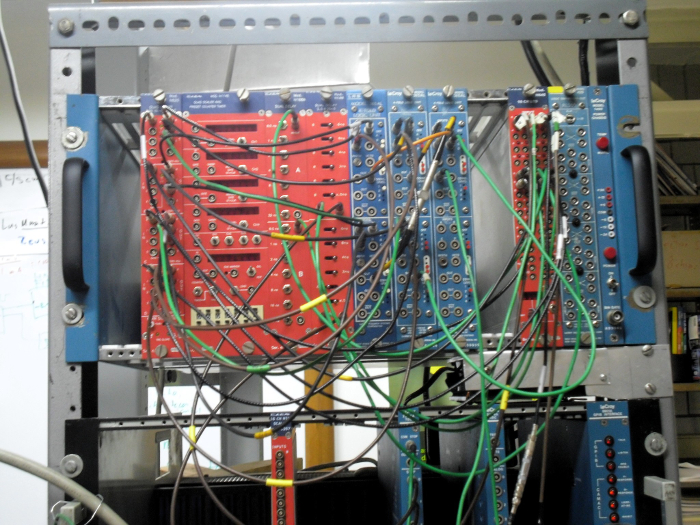
Figure 2. Detection System. NIM modules used to obtain the signal position of the radioactive source, including discriminator, delays modules, and logics units. Below them lie a CAMAC crate with the TDC and GPIB control module. Please click here to view a larger version of this figure.
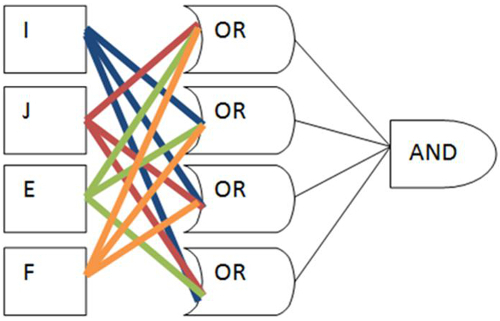
Figure 3. Logic block. In this scheme four PMTs are shown, named i, j, e, and f, connected to four 'OR' modules that are connected to a common 'AND' module. The operation is simple: when a signal is sent by one of the PMTs, 3 of the "OR" modules send a signal, but this is not enough for the operation requirements of the "AND" module, and only occurs when more than one PMT sends a signal (i.e., there was a coincidence). Please click here to view a larger version of this figure.
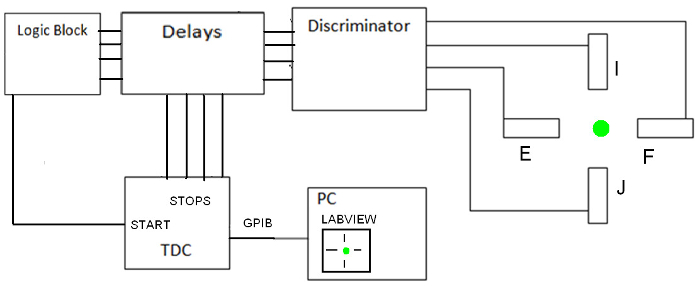
Figure 4. System scheme. In the upper right corner the radioisotope is placed between the PMTs, which send a signal to the discriminator which converts from the signal from analog to a digital pulse. The pulse then passes through the logic block. The same signal is sent to the delay modules, in order to measure the time difference. Please click here to view a larger version of this figure.
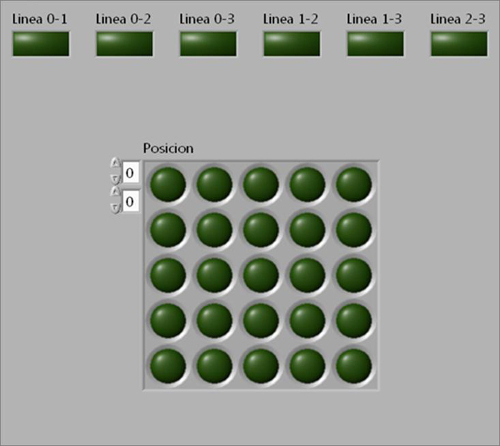
Figure 5. Software interface consisting of an array of LEDs that simulates the position of the radioactive source. When the program finishes the acquisition, one LED is ON to indicate the position of the source. At the top of the image there are other kind of LED's representing the lines of emission. Please click here to view a larger version of this figure.
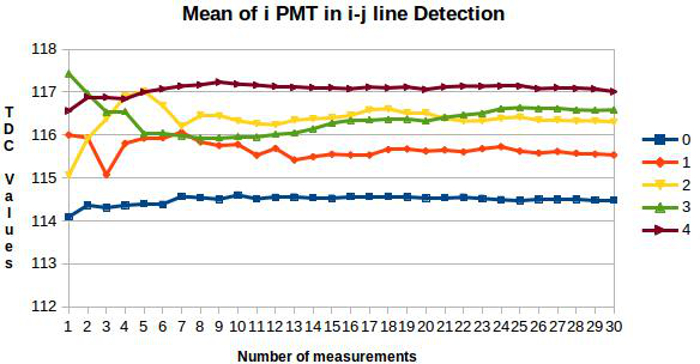
Figure 6. Calibration using the PMT called i. Consecutive measurements were performed and the average of the accumulated data was taken. Each measurement lasted 2 min. Each color corresponds to each position between the detectors. After some time, a well defined separation of signal was obtained, which means that the position of the source is well known. Please click here to view a larger version of this figure.
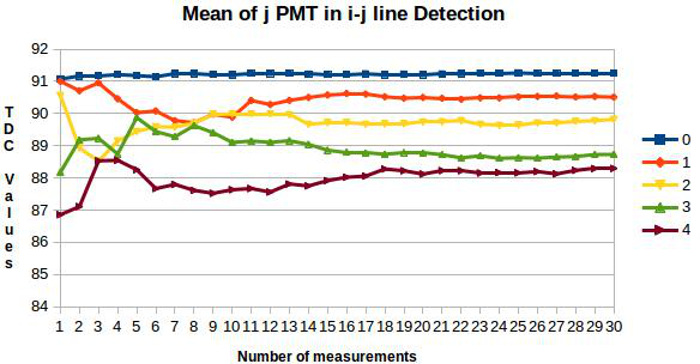
Figure 7. Calibration using the PMT called j. This graph as the previous one shows the mean of the j PMT. Please click here to view a larger version of this figure.
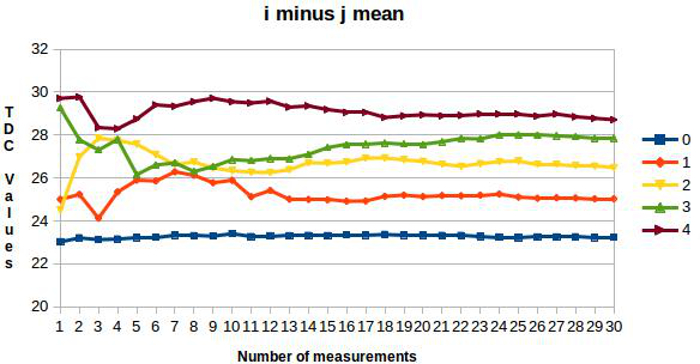
Figure 8. Calibration using the difference between the accumulated data average. Every color corresponds to one position in the detection line. Please click here to view a larger version of this figure.
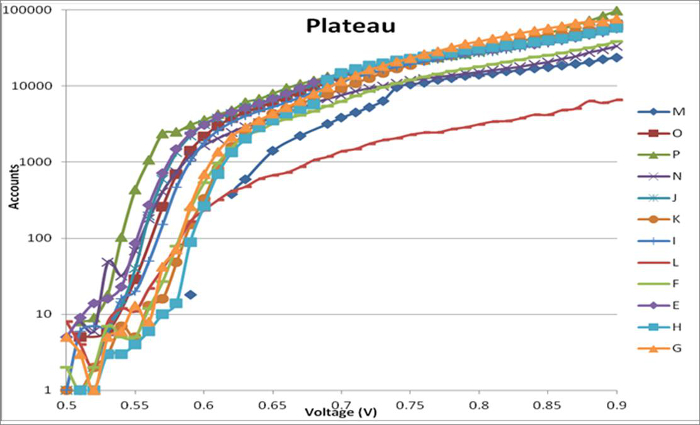
Figure 9. Plateau curve. In this graph the 'plateau' curve for different PMTs is shown. Here the control voltage varies from 0.5 to 0.9 V. The curve begins to bend around 0.6 V; some have steeper curves, corresponding to greater stability; on the other hand the values of some curves such as oranges line reach higher values. Please click here to view a larger version of this figure.
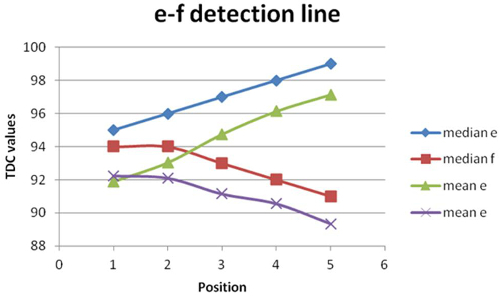
Figure 10. Coupling response. Here the magnitude of the mean and median from the PMTs e and f, placing the radioactive source position in five different locations along the detection line is shown. The statistics obtained use the data obtained in 5 min. The curve should be as vertical as possible. Please click here to view a larger version of this figure.
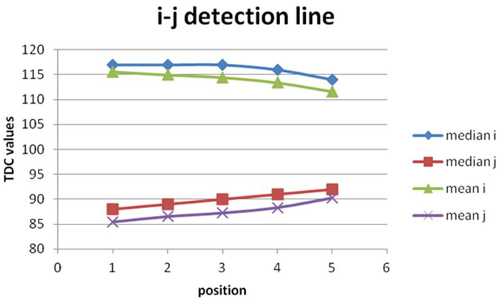
Figure 11. Coupling response. Here the analog information, but now for the second couple of PMTs i and j is shown. A relatively horizontal line is observed, which means that the previous PMT pair is better, in terms of spatial resolution. Please click here to view a larger version of this figure.
Discussion
One important aspect of this system is to have a very good control over spatial and time resolutions. The spatial resolution of PET is limited by the physical characteristics of the radioactive decay and the annihilation, but also by technical aspects of the coincidence registration (steps 1.1 and 1.2) and by external sources of errors, such as object movement during the examination5. Thus, the exact position measured will depend on the TOF difference (step 2.4). One technique to achieve a good time resolution is measuring the full width half maximum (FWHM) of the distribution of TOF6.
Each PMT was characterized by obtaining its curve called 'plateau'7,8. This curve represents the numbers of events detected by the PMT vs. the control voltage in a semi logarithmic scale. The flattest part corresponds to a zone of great stability (see Figure 9). Another characteristic to take into account is the stability of the voltage values in this plateau zone. In this case 0.82 V was used as the control voltage (step 4.2).
To choose the number of intermediate positions between each pair of detectors a simple test was made consisting in evaluating the efficiency over different positions. The source was placed at different locations between the detectors, and data was taken for 5 min (see Figures 10 and 11). For this test, 5 positions were selected; the line has 20 centimeters of longitude, so each position is in 2, 6, 10, 14 and 18 cm with respect to one PMT.
From previous tests, the magnitude from each TDC measurement was evaluated. As a first selection, all data which lied far from this magnitude were discarded, and the average was calculated. A further selection was done by consider an interval around the average data calculated before, and data outside this interval was discarded. In this way, the noise signal was under control.
It is worth to say that only 2 min is needed to locate the radioactive source with excellent efficiency (see results). Nevertheless, when the time is reduced from 2 to 1 min or even 30 sec, the efficiency of locating the source diminishes. At the moment, this PET system consists of four detectors, but it is possible to increase the number of detectors to improve the efficiency and spatial resolution. However, with this prototype, the main objective of this work was fulfilled9, 10.
The main advantage of this set up is that it was built with electronic devices common to any lab dedicated to instrumentation in some areas such as high energy physics. When some of these devices are already present in the lab it is not too difficult or expensive to complete the entire experimental set up. As it was mentioned before, with this PET system professors and students have the possibility to understand the basic properties of locating a radioactive source in space, which is the basic PET working feature. In the future, one can improve many of the different elements of this system, and apply it, not only for academic but also for research purposes.
Divulgaciones
The authors have nothing to disclose.
Acknowledgements
We are very grateful for the financial support of the Physics Department of CINVESTAV. We also want to thank our technician Marcos Fontaine Sanchez for his remarkable assistance with the set up. Thanks a lot to Sarah LaPointe for reviewing the English-language of this document.
Materials
| Low threshold Discriminator | CAEN | N845 | |
| Logic Units | Lecroy | 365AL | |
| Time delay | CAEN | N108A | |
| Oscilloscope | Tektronic | TDS3014C | |
| Quad Scaler and preset counter | CAEN | N1145 | |
| TDC | Lecroy | 2228 | |
| PMT’s | Hamamatsu | H5783p | |
| Power Chasis | Lecroy | 1403 | |
| GPIB Interface | Lecroy | 8901A | |
| NIM Power Supply | Lecroy | 1002B | |
| CAMAC Crate | Borer-co | 1902A | |
| Scintillator Crystals | Bicron | 408 | 1cm x 2cm x 5cm |
| Power Supply | Agilent | E3631 | |
| Na 22 Radioactive Source | activiti 2μCi | ||
| Software LabView 7.1 | National intruments | ||
| lemo cables connectors | 2ns, 3ns and 8ns | ||
| isolator film |
Referencias
- Cerello, P., Pennazio, F., et al. An innovative detector concept for hybrid 4D-PET/MRI. Imaging. Nucl. Instr. Meth. Phys. Res. 702, 1-3 (2013).
- Muehllerher, G., Karp, J. S. Positron tomography emission. Phys. Med. Biol. 51, R117-R137 (2006).
- Conti, M. State of the art and challenges of time of flight PET. Physica Medica. 25 (1), 1-11 (2008).
- Abreu, Y., Piñera, I., et al. Simulation of a PET system and study of some geometry parameters. AIP conference. 1032, 219-221 (2008).
- Langner, J. . Development of a parallel Computing optimized head movement correction method in PET. , (2003).
- Budinger, T. F. Time-of-flight PET. J. Nucl Med. 28 (3), 73-78 (1983).
- Leo, W. R. . Techniques for Nuclear and Particle Physics Experiments. , (1987).
- Budinger, T. F. Instrumentation trends in nuclear medicine. Semin Nucl Med. 7 (4), 285-297 (1977).
- Burnham, C., Bradshaw, J., Kaufmann, D., Chesler, D., Browner, G. L. A Positron tomography employing a one dimension BGO scintillation camera. IEEE Trans. Nucl. Sci. 30 (1), 661-664 (1983).
- Burnham, C., Bradshaw, J., Kaufmann, D., Chesler, D., Steams, C. W., Browner, G. L. Design of a cylindrical shape scintillation camera for positron tomographs. IEEE Trans. Nucl. Sci. 32 (1), 889-893 (1985).

