Summary

Monitoring Leucine-Rich Repeat Containing 8 Channel (LRRC8/VRAC) Activity using Sensitized-Emission Förster Resonance Energy Transfer (SE-FRET)

Published: August 09, 2024
doi:

Summary

Electrophysiology is the gold standard for investigating ion channel activity. However, there are plenty of alternative approaches, including optical methods. Here, we describe a method to monitor the activity of the leucine-rich repeat containing 8 channel (LRRC8)-formed anion channels using an inter-subunit Förster resonance energy transfer (FRET)-based method.

Abstract

Members of the LRRC8 protein family form heteromeric ion and osmolyte channels with roles in numerous physiological processes. As volume-regulated anion channels (VRACs)/volume-sensitive outwardly rectifying channels (VSORs), they are activated upon osmotic cell swelling and mediate the extrusion of chloride and organic osmolytes, leading to the efflux of water and hence cell shrinkage. Beyond their role in osmotic volume regulation, VRACs have been implicated in cellular processes such as differentiation, migration, and apoptosis. Through their effect on membrane potential and their transport of various signaling molecules, leucine-rich repeat containing 8 (LRRC8) channels play roles in neuron-glia communication, insulin secretion, and immune response. The activation mechanism has remained elusive. LRRC8 channels, like other ion channels, are typically studied using electrophysiological methods. Here, we describe a method to detect LRRC8 channel activation by measuring intra-complex sensitized-emission Förster resonance energy transfer (SE-FRET) between fluorescent proteins fused to the C-terminal leucine-rich repeat domains of LRRC8 subunits. This method offers the possibility to study channel activation in situ without exchange of the cytosolic environment and during processes such as cell differentiation and apoptosis.

Introduction

Ion channels comprised of heteromers of leucine-rich repeat containing 8 (LRRC8) family proteins are found throughout vertebrate cells, participating in a wide range of physiological functions1,2. These LRRC8 channels, first identified as volume-regulated anion channels (VRACs) or volume-sensitive outwardly rectifying channels (VSOR), play a crucial role in cellular regulatory volume decrease3,4. They facilitate the expulsion of chloride ions and organic osmolytes, which is followed by water efflux in response to osmotic swelling. Beyond their role in osmotic stress response, their role in cellular volume regulation has been linked to cell proliferation and migration, apoptosis, spermiogenesis, and epithelial integrity5,6,7. Alteration of the membrane potential upon LRRC8/VRAC activation has been shown to contribute to myotube differentiation8 and insulin secretion by pancreatic β-cells9,10,11. Furthermore, LRRC8 channels conduct a variety of organic osmolytes such as purinergic signaling molecules ATP and cGAMP or the excitatory amino acid glutamate, placing these channels in cell-cell communication in the immune system or glia-neuron interaction12,13,14,15,16,17,18,19,20,21,22. Even xenobiotics, such as the dye fluorescein, the antibiotic blasticidin S or the anticancer drug cisplatin, are conducted by LRRC8 channels23,24,25.

There are numerous reports on the signal transduction leading to LRRC8/VRAC activation26,27,28. However, the mechanism remains unclear, and the literature presents a broad range of potential mechanisms that could depend on the specific physiological process. These include changes in cytosolic ion strength, interaction with the cytoskeleton, membrane composition, G proteins, the redox state, and phosphorylation cascades2,27,29,30,31.

LRRC8/VRAC channels contain LRRC8A as an essential subunit3,4 that must heteromerize with at least one of its paralogues LRRC8B-E to form physiologically functional channels4,14,32. The subunit composition determines biophysical properties of the channel, such as rectification and depolarization-dependent inactivation4,29,32,33,34, substrate specificity15,17,20,21,24,35, and some activation pathways36,37. Cryo-electron microscopy (cryo-EM) structures show that LRRC8A homomers, as well as heteromers, assemble as hexamers38,39,40, while LRRC8A/LRRC8C chimeras that form functional channels are heptamers41. The N-terminal part of all LRRC8 proteins comprises four transmembrane helices, and the C-terminal part contains a domain with leucine-rich repeats (LRRD). The available LRRC8 complex structures provide evidence that the LRRDs, which stretch into the cytosol3,4,23, may undergo conformational rearrangements during channel gating34,42,43. This notion is corroborated by the finding that C-terminal fusion of fluorescent proteins results in basal channel activity14 and that binding of nanobodies to the domains can modulate channel activity44. Moreover, conformational alterations of the C-termini were shown by intra-complex Förster resonance energy transfer (FRET)45.

The most common method to study ion channel activity is electrophysiological measurements46, which were extensively applied in the investigation of VRACs before their molecular identification47. However, there are various additional ways to monitor VRAC activity indirectly, including the measurement of its conducted substrates -halide ions or organic osmolytes- or its effect on cell volume48. In fact, the identification of LRRC8 proteins as VRAC relied on an assay based on the quenching of a halide-sensitive fluorescent protein49 by iodide entering the cell through activated VRACs3,4. Another method to monitor LRRC8/VRAC channel activity makes use of the movement of the cytosolic domains which can be observed, as in other ion channels50,51,52,53, by changes in FRET45. To this end, fluorescent proteins that serve as FRET pairs, such as cyan-fluorescent protein (CFP)/mCerulean3 as donor and yellow-fluorescent protein (YFP)/mVenus as acceptor, were fused to the C-termini of the LRRC8 proteins (Figure 1). Intra-complex FRET between LRRC8 subunits was shown by acceptor photobleaching experiments45. Avoiding the destructive photobleaching method, FRET changes over time were monitored by sensitized-emission FRET (SE-FRET), where basically the sensitized emission of the acceptor upon excitation of the donor due to the overlap of the emission spectrum of the donor with the excitation spectrum of the acceptor is measured. Application of extracellular hypotonicity, a stimulus for LRRC8/VRAC activation, resulted in a reversible reduction in SE-FRET intensity45. Importantly, simultaneous whole-cell patch-clamp measurements and FRET monitoring during hypotonic treatment showed that this reduction in FRET indeed mirrored LRRC8/VRAC activation45. This method, which avoids disrupting the plasma membrane or altering the intracellular environment by pipette solution, offers an alternative for monitoring LRRC8/VRAC activity. It is particularly useful in physiological settings where maintaining the native cytosol is crucial, subcellular resolution is necessary, or prolonged observation of channel activity is required.

Here, we present a protocol to study LRRC8/VRAC with such a FRET-based read-out. The protocol depicts how to handle and transfect cells, acquire sample and control images, analyze the data, and calculate sensitized emission FRET (SE-FRET) values.

Figure 1
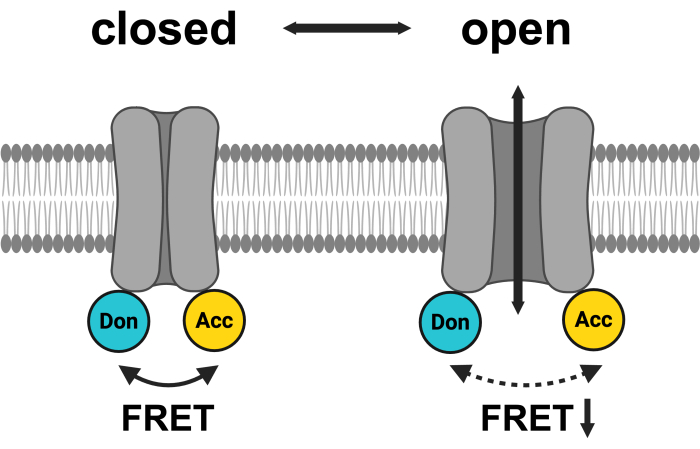
Figure 1: Schematic of the LRRC8 FRET pair system. mCerulean3 is shown in cyan, and mVenus is shown in yellow. Following VRAC opening, the distance (and/or the spatial orientation) between the fluorophores changes, resulting in a reduced energy transfer between donor (Don) and acceptor (Acc) and, in turn, lowering the observed FRET. Created with BioRender.com. Please click here to view a larger version of this figure.

Protocol

1. Preparation of buffer and reagents

  1. Prepare medium and isotonic, hypotonic, and hypertonic buffers and measure the osmolarity of the buffers with an osmometer to ensure that the osmolarity (Osm) is in the expected range with only an acceptable deviation.
    1. Cell culture media: Prepare Dulbecco´s Modified Eagle Medium (DMEM) supplemented with 10% Fetal Bovine Serum (FBS) and 1% penicillin/streptomycin
    2. Isotonic imaging buffer (~340 mOsm): Prepare the isotonic imaging buffer by mixing 150 mM NaCl, 6 mM KCl, 1 mM MgCl2, 1.5 mM CaCl2, 10 mM D(+)-Glucose and 10 mM 4-(2-Hydroxy Ethyl)-1-Piperazine Ethane Sulfonic acid (HEPES).
    3. Hypotonic imaging buffer (~250 mOsm): Prepare the hypotonic imaging buffer by mixing 105 mM NaCl, 6 mM KCl, 1 mM MgCl2, 1.5 mM CaCl2, 10 mM D(+)-Glucose and 10 mM HEPES.
    4. Hypertonic imaging buffer (~500 mOsm): Prepare the hypertonic imaging buffer by mixing 160 mM D(-)-Mannitol, 150 mM NaCl, 6 mM KCl, 1 mM MgCl2, 1.5 mM CaCl2, 10 mM D(+)-Glucose and 10 mM HEPES.
      NOTE: Buffers may be supplemented with specific drugs depending on what will be investigated.

2. Growth of adherent cells on glass bottom dishes

  1. Prepare at least one dish for transfection only with the protein of interest (POI) fused to either the donor or the acceptor fluorophore and at least one dish for transfection with the donor and acceptor pair (Table 1 and Figure 2). Use glass-bottom dishes to allow for fluorescence microscopy. Depending on the cell type, pretreat the surface by special cleaning or coating it with polylysine.
    NOTE: Here, FRET donor mCerulean3 (mCer)54 and FRET acceptor mVenus (mVen)55 are used as FRET pair, but other combinations of fluorophores are also applicable. Sample expressing the POI fused to the donor or acceptor alone are used to determine the correction factors β and γ (Table 1) necessary to correct for donor bleed through in the acceptor channel and cross excitation of the acceptor by the donor excitation wavelength (Figure 2Ac, Bf).
  2. The day before transfection, seed 1 x 10⁵ HeLa cells in 2 mL of cell culture media on 35-mm dishes with a glass bottom suitable for fluorescence microscopy. Culture cells overnight at 37 °C and 5% CO2 atmosphere in a cell culture incubator.
    NOTE: Volumes of reagents can be adapted to the surface area of other cell culture dishes/flask with a different size. The cell number can be adapted to a density suitable for different cell lines and experimental approaches.
    1. Aspirate the cell culture supernatant from the monolayer of adherent cells cultured on T75 cell culture flasks using a vacuum pump.
    2. Wash the cells by adding 10 mL of Dulbecco's Phosphate Buffered Saline (DPBS) to the cell culture flask and aspirating the solution afterward with a vacuum pump.
    3. Cover the cells completely with 1mL of 0,05% Trypsin-EDTA and incubate the cells for 2 min at 37 °C and 5% CO2 atmosphere in a cell culture incubator.
    4. Add 9 mL of cell culture media and suspend the cells by pipetting.
    5. Transfer the cell suspension into a 15 mL tube and centrifuge at 700 x g for 3 min at room temperature (RT).
    6. Aspirate the supernatant with a vacuum pump and resuspend the cell pellet in 10 mL of cell culture media.
    7. Mix equal volumes of cell suspension and 0.4% trypan blue in a tube and add 10 µL to a counting slide. Place the slide into the automated cell counter and start counting using the appropriate program for cell counting.
    8. To calculate the volume of cell suspension needed for each dish, divide the cell number needed per dish (1 x 10⁵) by the cell number per milliliter obtained from the cell counter.
    9. Prepare a cell suspension in a suitable tube containing the number of cells needed per dish in the volume needed per dish (2 mL) plus the amount for one dish extra.
    10. Mix cell suspension at least 20 times by inverting the tube and pipette 2 mL of the cell suspension in each dish.
    11. To ensure a more even cell distribution, leave the dishes for 30 min at RT before placing them in the cell culture incubator.

3. Cell transfection

NOTE: Here, FuGENE was used as a transfection reagent. Other transfection reagents and methods are also applicable. Optimal ratios of plasmid DNA (pDNA) to transfection reagents and time for optimal expression for each POI and cell model need to be assessed empirically. Here, 2 µg of total pDNA per 35 mm dish was used. FRET donor and acceptor constructs were used in a 1:1 ratio, and the pDNA-to-transfection reagent ratio was 1:4 (Table 1).

  1. Before transfection, replace the cell culture supernatant with fresh 2 mL of pre-warmed media.
  2. Dilute pDNA in Opti-Minimal Essential Medium (MEM) with a final volume of 100 µL (=pDNA solution).
  3. Dilute the transfection reagent in Opti-MEM with a final volume of 100 µL (=reagent solution).
    NOTE: For a more uniform transfection, prepare a master mix for the pDNA and reagent solution.
  4. Mix pDNA and reagent solution well.
  5. Add the pDNA solution into the reagent solution (=transfection solution).
  6. Mix the transfection solution well.
  7. Incubate the transfection solution for 15 min at RT.
  8. Add the transfection solution dropwise in a spiral motion to the dish.
  9. Mix by moving the dish 5 times horizontally and vertically on the surface of the bench.
  10. Culture cells overnight at 37 °C and 5% CO2 atmosphere in a cell culture incubator.


Condition Construct (s) Sample Used for
1 LRRC8A-mCerulean Donor construct only determine correction factor β
2 LRRC8E-mVenus Acceptor construct only determine correction factor γ
3 LRRC8A-mCerulean and LRRC8E-mVenus FRET pair SE-FRET quantification

Table 1: Example of conditions necessary for a typical SE-FRET experiment to measure LRRC8/VRAC activity of a channel composed of the LRRC8A subunit fused to the donor (mCerulean3) and LRRC8E subunit fused to the acceptor (mVenus) fluorophore.

4. Image acquisition for correction factor determination

NOTE: There is a bleed-through of the donor emission into the detected emission of the acceptor during FRET. Moreover, there is cross-excitation of the acceptor fluorophore by the donor excitation wavelength. These processes must be compensated for during the calculation of the SE-FRET. To this end, correction factors are determined in cells expressing only the FRET donor or acceptor 24 h after transfection. Here, the imaging was carried out on a Leica THUNDER Imager equipped with a Leica LED8 lamp, the filter cube CYR71010, an HC PL APO 63x/1.40 OIL objective, long pass filter for 460/80 and 553/70 and a Leica DFC9000GTC camera. Experiments were performed without environmental control but in the presence of HEPES in the imaging buffers to stabilize the pH. For long-term observation/measurements, it is advised to use an environmental control system. For analysis, SE-FRET is calculated from the captured raw images. This can be done simultaneously during acquisition or afterward. Here, the Leica LAS X software with the SE-FRET plugin was used to simplify the experimental procedure regarding the calculation of the correction factors and visualizing the SE-FRET value changes in real-time during image acquisition. For post-acquisition, correction factors and SE-FRET can be determined with other software packages (e.g., FIJI) after raw data acquisition according to the protocol provided below.

  1. Before image acquisition of single transfected cells to calculate the correction factors, use one sample expressing the FRET pair to set up the microscopy setting for all channels (donor excitation/donor emission DD, donor/acceptor DA, and acceptor/acceptor AA; see Table 1 and Figure 2C and Figure 3A).
    NOTE: For SE-FRET measurements with mCerulean3- and mVenus-tagged VRAC subunits transfected as described above, the following parameters were used: 8×8 pixel binning, 100ms exposure time, and 10% LED lamp intensity.
  2. Take the sample expressing the donor construct only (Figure 2A), aspirate the cell culture media, and wash the cells three times with 2 mL of isotonic buffer.
  3. Add 3 mL of isotonic buffer and place the sample on the microscope stage.
  4. Find a field of view (FOV) with at least one cell expressing the donor construct.
  5. Image all the channels (DD, DA, and AA see Table 2 and Figure 2A).
  6. Draw a region of interest (ROI) around the cell/cells and measure the mean intensity of DA (= IDA; Figure 2Ac) and DD (= IDD; Figure 2Aa).
  7. For background subtraction, draw an ROI in the DA and DD channels where only the background signal is found and measure the mean intensity (IBDA and IBDD).
  8. Subtract the mean intensity of the background ROI from the mean intensity measured in the cell ROI of the corresponding channel (Equation 1 and Equation 2).
  9. Repeat steps 4.2- 4.5 with the sample expressing only the acceptor construct (Figure 2B).
  10. Draw an ROI around the cell(s) and measure the mean intensity of DA (= IDA; Figure 2Bf) and AA (= IAA; Figure 2Be).
  11. For background subtraction, draw an ROI in the DA and AA channels where only the background signal is found and measure the mean intensities (IBDA and IBAA).
  12. Subtract the mean intensity of the background ROI from the mean intensity measured in the cell ROI of the corresponding channel (Equation 1 and Equation 3).
  13. Use the values determined for IDA*, IDD*, and IAA* to calculate the correction factors Equation 4 and Equation 5,
    ​Whereby the correction factor β is used to compensate for the bleed-through of the donor emission into the DA channel. The correction factor γ is used to compensate for the cross-excitation of the acceptor fluorophore by the donor excitation wavelength in the DA channel.
Excitation of Emission of Channel name LED line Filter cube Long-pass filter
Donor Donor DD 440 nm CYR71010 460/80 nm
Donor Acceptor DA 440 nm CYR71010 535/70 nm
Acceptor Acceptor AA 510 nm CYR71010 535/70 nm

Table 2: Summary of channels required for SE-FRET experiments.

Figure 2
Figure 2: Representative fluorescence images of samples used to calculate the correction factors β and γ necessary to determine the VRAC activity of a channel composed of LRRC8A subunit fused to the donor mCerulean3 (mCer) and LRRC8E subunit fused to the acceptor mVenus (mVen) fluorophore by SE-FRET measurements. (A,B) Detection of the donor/donor DD, acceptor/acceptor AA, and donor/acceptor DA channel in HeLa cells only expressing the donor (A) LRRC8A-mCer or the acceptor (B) LRRC8E-mVen. (C) Detection of DD, AA, and DA channels in HeLa cells co-transfected with the donor and acceptor pair LRRC8A-mCer and LRRC8E-mVen. Panels a-i show images taken in the donor detection channel (excitation of the donor and detection of the donor signal; DD; a, d and g), the acceptor detection channel (excitation of the acceptor and detection of the acceptor signal; AA; b, e, and h ) and the FRET signal detection channel (excitation of the donor and detection of the acceptor signal; DA; c, f, and i). Panel j is the overlay of panels g and h. DD channel is shown in green and AA channel in magenta. Scale bar = 10 µm. Please click here to view a larger version of this figure.

5. Time-lapse imaging for SE-FRET quantification

  1. Take the sample expressing the donor and acceptor construct (Table 1, Figure 2C and Figure 3A), aspirate cell culture media, and wash the cells three times with 2 mL of isotonic buffer 24 h after transfection.
  2. Add 3 mL of isotonic buffer and place the sample on the microscopy stage.
  3. For later aspiration of the isotonic buffer, fixate and adjust a hose cannula so the cannula tip reaches the bottom of the dish.
  4. For adding buffers, fixate and adjust tubings so that the buffer driven by gravity flow can drop into the dish.
    NOTE: Here, a valve controlled gravity perfusion system with four magnetic valves to control the buffer flow was used, but other methods are also applicable.
  5. Find a FOV with at least one cell expressing the donor and acceptor construct simultaneously.
  6. Set up a time-lapse experiment for the channels DD, DA, and AA with an interval of 10 s and a duration to cover all conditions of the stimulation sequence, e.g., 12 cycles of baseline followed by 15 cycles per condition (Figure 3).
    NOTE: The interval and the number of cycles can be adopted according to the experimental needs but should always include a baseline measurement for normalization for better visualization and comparison of the data.
  7. After baseline measurement, wash the sample in the buffer for the first condition.
    1. Aspirate the isotonic buffer via the hose cannula, applying a vacuum with a syringe.
    2. Add 3 mL of the buffer of the next condition by gravity flow.
    3. Aspirate the buffer and add again 3 mL of the same buffer.
    4. Repeat step 5.7.3 once more.
  8. After measurement of the first condition, wash the sample in the buffer for the next condition (steps 5.7.1-5.7.4).
  9. Repeat steps 5.5-5.8 until all conditions are captured.
  10. For SE-FRET quantification, draw an ROI around the cell/cells and measure the mean intensity in the DD = (IDD), DA (IDA), and AA (IAA) channel for all images (time points) in the time series (Figure 3A, B).
  11. For background subtraction for the FRET signal, draw an ROI in the DA channel where only the background signal is found and measure the mean intensity (IBDA).
  12. Subtract the mean intensity of the background ROI from the mean intensity measured in the cell ROI of the DA channel (Equation 1).
  13. Use the values determined to calculate the mean SE-FRET values for each ROI and all time points Equation 6.
  14. For better comparability of different conditions and visualization of the SE-FRET values, use the mean of the baseline values of each ROI to normalize all time points of the corresponding ROI.
  15. Plot the normalized SE-FRET values over time (Figure 3B).

Figure 3
Figure 3: Representative fluorescence images and SE-FRET quantification. (A) Representative fluorescence images and the apparent SE-FRET of the first time point of a time laps experiment to measure the VRAC activity by SE-FRET of a channel composed of LRRC8A and LRRC8E subunits depending on the tonicity. Scale bar = 10 µm. The same cells are shown in Figure 2C. Panels ai show the detection of the DD, AA, and DA channels and the calculated apparent SE-FRET. White outlines represent the ROIs (cells i-iii in panel d) used to measure the mean signal intensities in DD, AA and DA and the apparent SE-FRET image. (B) Quantification of the SE-FRET values over time. Sequence of conditions was 12 cycles of isotonic imaging buffer (baseline) followed by 15 cycles of hypotonic and 15 cycles of hypertonic imaging buffer. The raw mean SE-FRET value of each ROI (cells i-iii) and time point was normalized to the mean of the baseline (isotonic) value for the corresponding ROI. Please click here to view a larger version of this figure.

Representative Results

With this FRET-based method, LRRC8/VRAC activity can be monitored during osmotic stimulation, and the reduction in SE-FRET correlates with the degree of extracellular hypotonicity45. Representative results for hypotonicity-induced channel activation are also shown here (Figure 3 and Figure 4). In addition, LRRC8/VRAC activation by different isosmotic stimuli, such as manipulation of diacylglycerol signaling45 or during myocyte activation56, can be observed.

Figure 4
Figure 4: SE-FRET traces. (A) Apparent SE-FRET traces from 5 independent experiments. Data represent mean ± SD of N = 2 to N = 7 cells per field of view (FOV). (B) Mean ± SD of all cells (N = 31 cells). Please click here to view a larger version of this figure.

As LRRC8/VRAC channels are also involved in apoptotic volume decrease24,57, observing channel activity upon induction of apoptosis would be another application for the method described here. Accordingly, the protocol to monitor SE-FRET in HeLa cells expressing LRRC8A-mCerulean3 and LRRC8E-mVenus was carried out while applying death receptor-mediated apoptosis-inducing drugs. Tumor necrosis factor (TNF)-α and cycloheximide (CHX) were previously shown to evoke VRAC currents within a few minutes58. After the addition of 2 ng/mL TNF-α and 1 µg/mL CHX in isotonic buffer, there was a robust decrease in SE-FRET (Figure 5). Replacing the buffer by a hypertonic medium, even though containing TNF-α and CHX, SE-FRET values recovered close to baseline (Figure 5A), corresponding to diminishing VRAC currents in hypertonic bath solution during treatment with apoptosis-inducing Fas ligand58. Treatment of the cells with DMSO, the solvent for TNF-α and CHX, did not result in SE-FRET reduction. TNF-α + CHX did not affect SE-FRET of CFP-18aa-YFP, an EYFP and ECFP tandem construct as FRET control59, demonstrating the specificity for LRRC8/VRAC (Figure 5B).

Figure 5
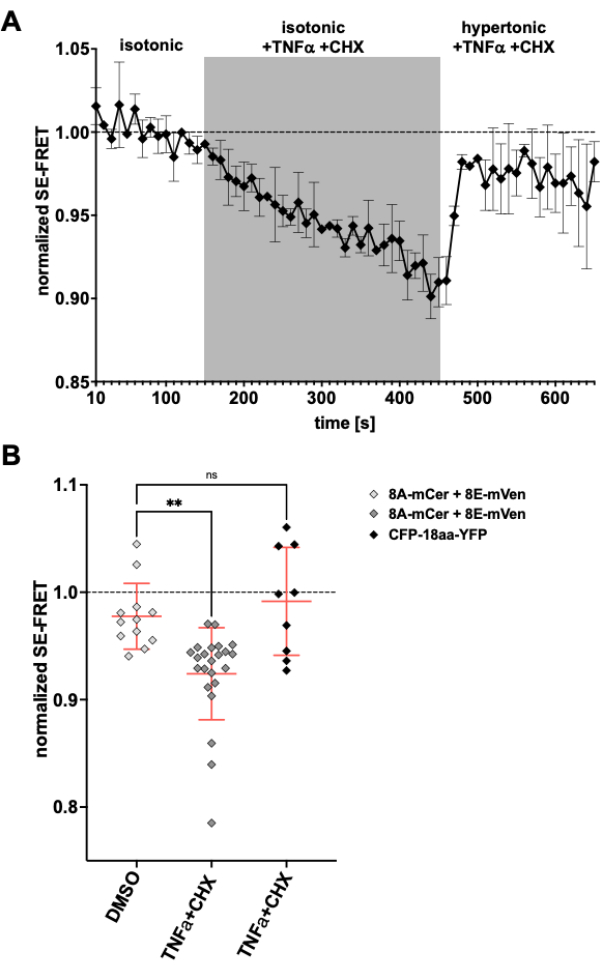
Figure 5: Isosmotic VRAC activation by death receptor-mediated apoptosis. (A) Normalized SE-FRET values from LRRC8A-mCer/LRRC8E-mVen-expressing HeLa cells (n = 8 dishes, 23 cells) over time. After 15 cycles in isotonic imaging buffer (baseline), the bath solution was replaced by isotonic buffer supplemented with 2 ng/mL TNF-α and 1 µg/mL cycloheximide (CHX) for 30 cycles followed by 20 cycles hypertonic imaging buffer with TNF-α and CHX. The raw mean SE-FRET value of each ROI and time point was normalized to the mean of the baseline (isotonic) value for the respective ROI. (B) Quantification of normalized SE-FRET values of LRRC8A/E-expressing HeLa cells as in A with isotonic solution containing DMSO as vehicle control for CHX (n = 5 dishes, 12 cells) or isotonic buffer containing apoptosis inducers as in A (n = 8 dishes, 23 cells), or of HeLa cells expressing CFP-18aa-YFP with apoptosis inducers (n = 3 dishes, 9 cells). Data represent the mean of the last 10 time points in the respective buffer of individual cells (symbols) and mean of all cells ± SD; ** p < 0.01 ordinary one-way ANOVA followed by Tukey´s multiple comparison post-hoc test. Please click here to view a larger version of this figure.

Discussion

FRET microscopy is a well-established, widely used technique to study the interaction between proteins. Hence, FRET-based methods can be applied in many laboratories of variable expertise. Conformational rearrangements during gating have been monitored for a broad range of ion channels using FRET-based assays (for examples, see references34,50,51,52,53,60,61,62,63,64,65,66,67), in some cases combined with electrophysiology in patch-clamp fluorometry68,69,70,71. FRET can be used to study the structure-function relationships of these ion channels or to monitor their activity independent of ion transport. The method presented here can have clear advantages over electrophysiology as it allows monitoring of the activity of LRRC8/VRAC channels in situ.

Critical steps in the protocol include plating the cells to reach optimal confluency for transfection and imaging, which ideally facilitates easy cell distinction for later analysis. Effective co-transfection of the different subunits is crucial for correct subcellular localization; for example, an excess of the non-LRRC8A subunit will lead to enhanced endoplasmic reticulum (ER) localization4. Therefore, plasmid ratios may need to be adjusted. Depending on the system, newly generated FRET pairs should be verified, e.g., by acceptor bleaching. Binning and exposure time must be balanced against each other to enable optimal temporal and spatial resolution for the research question. Binning enables shorter exposure times and hence reduces potential bleaching of the FRET sensor while decreasing spatial resolution. Therefore, if the experimental setup requires, e.g., subcellular discrimination of LRRC8/VRAC activity, binning should be avoided. The research question equally determines the number and interval of cycles in a time-lapse series. The interval is only relevant if the kinetics of the FRET changes (and hence LRRC8/VRAC activation/inactivation) are required; otherwise, simple "before-and-after" recordings can also be performed. The length of the experiment depends on the physiological process. Ideally, LRRC8/VRAC activity upon stimuli should be monitored until SE-FRET has stabilized. These factors can be determined in pilot experiments. Correction factors to calculate the real SE-FRET signal must be determined for all conditions. Incorrectly determined correction factors may lead to an over- or underestimation of the SE-FRET intensities. Lastly, after establishing a stable baseline, the time interval between images has to be short enough to capture the physiological process of interest.

The method bears some limitations. One of them is that changes in inter-LRRC8 FRET intensities while reflecting movements of the LRRDs, do not necessarily correspond to ion or osmolyte transport through the pore. This is clear from the FRET changes observed with LRRC8A homomers45 despite their minimal currents4,32,72. Pore blockers of LRRC8/VRAC channels may not affect the FRET signal, rendering this method unsuitable for the search for specific channel modulators. Moreover, the expression levels of the overexpressed LRRC8 proteins could affect the physiological processes that are observed, especially as the C-terminally tagged LRRC8 proteins display basal activity14.

An aspect that can be considered a limitation or an advantage depending on the particular research question is that in this method, only the ectopically expressed LRRC8 subunits are selectively measured. So, background levels of endogenous proteins hardly interfere with the measurements. On the other hand, the overexpressed proteins may not behave like the endogenous LRRC8 channels with potentially different subunit composition and stoichiometry. For example, various stimuli such as oxidation may have opposing modulatory effects on differently composed LRRC8 channels36. By altering the ratios between co-expressed subunits, their stoichiometry, and overall ion conductance can be adjusted14,73, but their native composition, with likely often more than two paralogs within one complex21, is not clear and may vary between cell types74,75,76. Furthermore, the fusion of fluorescent proteins to the cytosolic C-termini of LRRC8 proteins was shown to increase basal LRRC8/VRAC channel activity in Xenopus oocytes14, likely because the large tags modulate the conformation of the LRRDs, which may govern channel opening14,44,45. Therefore, the size of the fluorescent proteins, the linker, and their orientation may not only affect FRET efficiency but also channel activity. However, importantly, VRAC channels of LRRC8 proteins fused with fluorescent proteins remained responsive to hypotonic stimulation14, enabling their use as FRET sensors45.

Advantages of this non-invasive method to monitor LRRC8/VRAC channel activity by light microscopy compared to other methods comprise: (i) It allows observing LRRC8/VRAC within cells or compartments typically inaccessible for electrophysiology. This includes intracellular organelles on which LRRC8 complexes can be found or targeted to45,77,78. (ii) The cytosolic composition remains unaltered by the method, whereas during whole-cell patch-clamp measurements, the cytosol is largely replaced by pipette solution, which may affect signaling pathways as observed with phorbol-12-myristate-13-acetate (PMA)-induced LRRC8/VRAC activation45. (iii) It offers the possibility to observe LRRC8/VRAC activation with subcellular resolution, such as distinguishing activity at the leading and trailing edges during cell migration, where -restricted to confined spaces- VRAC has been implicated79,80. (iv) It enables continuous monitoring of LRRC8/VRAC activity during extended physiological processes such as myocyte differentiation56.

While there are limitations and challenges with this method, it holds promise for further exploration, including potential applications in animal models. In combination with other methods to study this ion and osmolyte channel family, this FRET-based assay may contribute significantly to unraveling activation mechanisms and exploring the diverse physiological functions of LRRC8 channels in their native environments.

Disclosures

The authors have nothing to disclose.

Acknowledgements

We thank C.F. Kaminski for the kind gift of the plasmid encoding the CFP-18aa-YFP construct, A. Klemmer for technical assistance, and all current and former members of the Stauber laboratory who contributed to the development of this method.

Materials

0.05% Trypsin-EDTA gibco 25300-054
Camera DFC9000GTC Leica 11547007
CFP-18aa-YFP N/A N/A Elder et al. 2009 PMCID: PMC2706461; Gift from C.F. Kaminski (University of Cambridge, UK)
Cycloheximide (CHX) Sigma-Aldrich 66-81-9
D(-)-Mannitol Carl Roth 4175.1
D(+)-Glucose Carl Roth HN06.1
DMEM (Dulbeccos Modified Eagle Medium) PAN-Biotech P04-03590
DPBS (Dulbecco's Phosphate Buffer Saline) PAN-Biotech P04-36500
Emission filter wheel (460/80, 535/70, 590/50, 642/80, 100%) Leica 11525480
FBS (Fetal Bovine Serum) PAN-Biotech P30-3302
Filter cube CYR71010 Leica 11525416
FuGENE Promega E2691
Glas Bottom Culture Dishes 35 mm MatTek P35G-0-10-C
HeLa cells Leibniz Forschungsinstitut DSMZ ACC 57 Mammalian cervix carcinoma/ Obtained from Leibniz Forschungsinstitut DSMZ
HEPES Carl Roth 9105.4
ibidi µ-Disch 35 mm ibidi 81156
KCl (Potassium chloride) Carl Roth 6781.1
LAS X FRET Wizard Leica 11640862
Light source LED8 Leica 11504256
LRRC8A-mCerulean3 N/A N/A König et al. 2019
LRRC8E-mVenus N/A N/A König et al. 2019
Luna-II Automated Cell Counter logos biosystems L40002
Luna-II Cell Counter Slides logos biosystems L12001
MgCl2 (Magnesium chloride) Carl Roth KK36.1
Microscope THUNDER Imager live cell Leica 11525681
NaCl (Sodium chloride) Carl Roth 9263
Objective HC PL APO 63x/1.40 OIL Leica 11506349
Opti-Minimal Essential Medium (MEM) gibco 11058
Osmometer OM807 Vogel V04807
Penicillin Streptomycin (Pen Step) gibco 15070-063
Trypan blue solution (0,4%) Sigma T8154
Tumor necrosis factor (TNF)-a Sigma-Aldrich 94948-59-1
Valve Controlled Gravity Perfusion System ALA Scientific Instruments VC3-4xG

References

  1. Jentsch, T. J. VRACs and other ion channels and transporters in the regulation of cell volume and beyond. Nat Rev Mol Cell Biol. 17 (5), 293-307 (2016).
  2. Chen, L., et al. More than just a pressure relief valve: physiological roles of volume-regulated LRRC8 anion channels. Biol Chem. 400 (11), 1481-1496 (2019).
  3. Qiu, Z., et al. SWELL1, a plasma membrane protein, is an essential component of volume-regulated anion channel. Cell. 157 (2), 447-458 (2014).
  4. Voss, F. K., et al. Identification of LRRC8 heteromers as an essential component of the volume-regulated anion channel VRAC. Science. 344 (6184), 634-638 (2014).
  5. Hoffmann, E. K., Schettino, T., Marshall, W. S. The role of volume-sensitive ion transport systems in regulation of epithelial transport. Comp Biochem Physiol A Mol Integr Physiol. 148 (1), 29-43 (2007).
  6. López-Cayuqueo, K. I., et al. Renal deletion of LRRC8/VRAC channels induces proximal tubulopathy. J Am Soc Nephrol. 33 (8), 1528-1545 (2022).
  7. Lück, J. C., Puchkov, D., Ullrich, F., Jentsch, T. J. LRRC8/VRAC anion channels are required for late stages of spermatid development in mice. J Biol Chem. 293 (30), 11796-11808 (2018).
  8. Chen, L., Becker, T. M., Koch, U., Stauber, T. The LRRC8/VRAC anion channel facilitates myogenic differentiation of murine myoblasts by promoting membrane hyperpolarization. J Biol Chem. 294 (39), 14279-14288 (2019).
  9. Best, L., Brown, P. D., Sener, A., Malaisse, W. J. Electrical activity in pancreatic islet cells: The VRAC hypothesis. Islets. 2 (2), 59-64 (2010).
  10. Kang, C., et al. SWELL1 is a glucose sensor regulating beta-cell excitability and systemic glycaemia. Nat Commun. 9 (1), 367 (2018).
  11. Stuhlmann, T., Planells-Cases, R., Jentsch, T. J. LRRC8/VRAC anion channels enhance beta-cell glucose sensing and insulin secretion. Nat Commun. 9 (1), 1974 (2018).
  12. Hisadome, K., et al. Volume-regulated anion channels serve as an auto/paracrine nucleotide release pathway in aortic endothelial cells. J Gen Physiol. 119 (6), 511-520 (2002).
  13. Burow, P., Klapperstück, M., Markwardt, F. Activation of ATP secretion via volume-regulated anion channels by sphingosine-1-phosphate in RAW macrophages. Pflügers Arch. 467 (6), 1215-1226 (2015).
  14. Gaitán-Peñas, H., et al. Investigation of LRRC8-mediated volume-regulated anion currents in Xenopus oocytes. Biophys J. 111 (7), 1429-1443 (2016).
  15. Lahey, L. J., et al. LRRC8A:C/E heteromeric channels are ubiquitous transporters of cGAMP. Mol Cell. 80 (4), 578-591.e5 (2020).
  16. Chen, X., et al. Regulation of anion channel LRRC8 volume-regulated anion channels in transport of 2’3′-cyclic GMP-AMP and cisplatin under steady state and inflammation. J Immunol. 206 (9), 2061-2074 (2021).
  17. Zhou, C., et al. Transfer of cGAMP into bystander cells via LRRC8 volume-regulated anion channels augments STING-mediated interferon responses and anti-viral immunity. Immunity. 52 (5), 767-781.e6 (2020).
  18. Feustel, P. J., Jin, Y., Kimelberg, H. K. Volume-regulated anion channels are the predominant contributors to release of excitatory amino acids in the ischemic cortical penumbra. Stroke. 35 (5), 1164-1168 (2004).
  19. Mongin, A. A. Volume-regulated anion channel–a frenemy within the brain. Pflügers Arch. 468 (3), 421-441 (2016).
  20. Schober, A. L., Wilson, C. S., Mongin, A. A. Molecular composition and heterogeneity of the LRRC8-containing swelling-activated osmolyte channels in primary rat astrocytes. J Physiol. 595 (22), 6939-6951 (2017).
  21. Lutter, D., Ullrich, F., Lueck, J. C., Kempa, S., Jentsch, T. J. Selective transport of neurotransmitters and modulators by distinct volume-regulated LRRC8 anion channels. J Cell Sci. 130 (6), 1122-1133 (2017).
  22. Yang, J., et al. Glutamate-releasing SWELL1 channel in astrocytes modulates synaptic transmission and promotes brain damage in stroke. Neuron. 102 (4), 813-827.e6 (2019).
  23. Lee, C. C., Freinkman, E., Sabatini, D. M., Ploegh, H. L. The protein synthesis inhibitor blasticidin s enters mammalian cells via leucine-rich repeat-containing protein 8D. J Biol Chem. 289 (24), 17124-17131 (2014).
  24. Planells-Cases, R., et al. Subunit composition of VRAC channels determines substrate specificity and cellular resistance to Pt-based anticancer drugs. EMBO J. 34 (24), 2993-3008 (2015).
  25. Model, M. A., Nia, F. H., Zook, E., Hollembeak, J. E., Stauber, T. Uptake of fluorescein upon osmotic cell swelling is dependent on the volume-regulated anion channel VRAC/LRRC8. Paracelsus Proc Exp Med. 1 (1), 3-14 (2022).
  26. Stauber, T. The volume-regulated anion channel is formed by LRRC8 heteromers – molecular identification and roles in membrane transport and physiology. Biol Chem. 396 (9-10), 975-990 (2015).
  27. Bertelli, S., et al. Mechanisms of activation of LRRC8 volume regulated anion channels. Cell Physiol Biochem. 55 (S1), 41-56 (2021).
  28. Liu, T., Li, Y., Wang, D., Stauber, T., Zhao, J. Trends in volume-regulated anion channel (VRAC) research: visualization and bibliometric analysis from 2014 to 2022. Front Pharmacol. 14, 1234885 (2023).
  29. Strange, K., Yamada, T., Denton, J. S. A 30-year journey from volume-regulated anion currents to molecular structure of the LRRC8 channel. J Gen Physiol. 151 (2), 100-117 (2019).
  30. Osei-Owusu, J., Yang, J., Vitery, M. D. C., Qiu, Z. Molecular biology and physiology of volume-regulated anion channel (VRAC). Curr Top Membr. 81, 177-203 (2018).
  31. Friard, J., Laurain, A., Rubera, I., Duranton, C. LRRC8/VRAC channels and the redox balance: A complex Relationship. Cell Physiol Biochem. 55 (S1), 106-118 (2021).
  32. Syeda, R., et al. LRRC8 proteins form volume-regulated anion channels that sense ionic strength. Cell. 164 (3), 499-511 (2016).
  33. Ullrich, F., Reincke, S. M., Voss, F. K., Stauber, T., Jentsch, T. J. Inactivation and anion selectivity of volume-regulated anion channels (VRACs) depend on C-terminal residues of the first extracellular loop. J Biol Chem. 291 (33), 17040-17048 (2016).
  34. König, B., Stauber, T. Biophysics and structure-function relationships of LRRC8-formed volume-regulated anion channels. Biophys J. 116 (7), 1185-1193 (2019).
  35. Concepcion, A. R., et al. The volume-regulated anion channel LRRC8C suppresses T cell function by regulating cyclic dinucleotide transport and STING-p53 signaling. Nat Immunol. 23 (2), 287-302 (2022).
  36. Gradogna, A., Gavazzo, P., Boccaccio, A., Pusch, M. Subunit-dependent oxidative stress sensitivity of LRRC8 volume-regulated anion channels. J Physiol. 595 (21), 6719-6733 (2017).
  37. Bertelli, S., Zuccolini, P., Gavazzo, P., Pusch, M. Molecular determinants underlying volume-regulated anion channel subunit-dependent oxidation sensitivity. J Physiol. 600 (17), 3965-3982 (2022).
  38. Deneka, D., Sawicka, M., Lam, A. K. M., Paulino, C., Dutzler, R. Structure of a volume-regulated anion channel of the LRRC8 family. Nature. 558 (7709), 254-259 (2018).
  39. Kasuya, G., et al. Cryo-EM structures of the human volume-regulated anion channel LRRC8. Nat Struct Mol Biol. 25 (9), 797-804 (2018).
  40. Kefauver, J. M., et al. Structure of the human volume regulated anion channel. Elife. 7, e38461 (2018).
  41. Takahashi, H., Yamada, T., Denton, J. S., Strange, K., Karakas, E. Cryo-EM structures of an LRRC8 chimera with native functional properties reveal heptameric assembly. Elife. 12, e82431 (2023).
  42. Sawicka, M., Dutzler, R. Regulators of cell volume: The structural and functional properties of anion channels of the LRRC8 family. Curr Opin Struct Biol. 74, 102382 (2022).
  43. Kasuya, G., Nureki, O. Recent advances in the structural biology of the volume-regulated anion channel LRRC8. Front Pharmacol. 13, 896532 (2022).
  44. Deneka, D., et al. Allosteric modulation of LRRC8 channels by targeting their cytoplasmic domains. Nat Commun. 12 (1), 5435 (2021).
  45. König, B., Hao, Y., Schwartz, S., Plested, A. J., Stauber, T. A FRET sensor of C-terminal movement reveals VRAC activation by plasma membrane DAG signaling rather than ionic strength. Elife. 8, e45421 (2019).
  46. Hille, B. . Ion Channels of Excitable Membranes. , (2001).
  47. Pedersen, S. F., Okada, Y., Nilius, B. Biophysics and physiology of the volume-regulated anion channel (VRAC)/volume-sensitive outwardly rectifying anion channel (VSOR). Pflügers Arch. 468 (3), 371-383 (2016).
  48. Kolobkova, Y., Pervaiz, S., Stauber, T. The expanding toolbox to study the LRRC8-formed volume-regulated anion channel VRAC. Curr Top Membr. 88, 119-163 (2021).
  49. Galietta, L. J., Haggie, P. M., Verkman, A. S. Green fluorescent protein-based halide indicators with improved chloride and iodide affinities. FEBS Lett. 499 (3), 220-224 (2001).
  50. Bykova, E. A., Zhang, X. D., Chen, T. Y., Zheng, J. Large movement in the C terminus of CLC-0 chloride channel during slow gating. Nat Struct Mol Biol. 13 (12), 1115-1119 (2006).
  51. Zheng, J., Zagotta, W. N. Gating rearrangements in cyclic nucleotide-gated channels revealed by patch-clamp fluorometry. Neuron. 28 (2), 369-374 (2000).
  52. Miranda, P., et al. State-dependent FRET reports calcium- and voltage-dependent gating-ring motions in BK channels. Proc Natl Acad Sci U S A. 110 (13), 5217-5222 (2013).
  53. Zachariassen, L. G., et al. Structural rearrangement of the intracellular domains during AMPA receptor activation. Proc Natl Acad Sci U S A. 113 (27), E3950-E3959 (2016).
  54. Markwardt, M. L., et al. An improved cerulean fluorescent protein with enhanced brightness and reduced reversible photoswitching. PLoS One. 6 (3), e17896 (2011).
  55. Nagai, T., et al. A variant of yellow fluorescent protein with fast and efficient maturation for cell-biological applications. Nat Biotechnol. 20 (1), 87-90 (2002).
  56. Chen, L., König, B., Stauber, T. LRRC8 channel activation and reduction in cytosolic chloride concentration during early differentiation of C2C12 myoblasts. Biochem Biophys Res Commun. 532, 482-488 (2020).
  57. Maeno, E., Ishizaki, Y., Kanaseki, T., Hazama, A., Okada, Y. Normotonic cell shrinkage because of disordered volume regulation is an early prerequisite to apoptosis. Proc Natl Acad Sci U S A. 97 (17), 9487-9492 (2000).
  58. Shimizu, T., Numata, T., Okada, Y. A role of reactive oxygen species in apoptotic activation of volume-sensitive Cl- channel. Proc Natl Acad Sci U S A. 101 (17), 6770-6773 (2004).
  59. Elder, A. D., et al. A quantitative protocol for dynamic measurements of protein interactions by Förster resonance energy transfer-sensitized fluorescence emission. Journal of the Royal Society Interface. 6 (Suppl 1), S59-S81 (2009).
  60. Glauner, K. S., Mannuzzu, L. M., Gandhi, C. S., Isacoff, E. Y. Spectroscopic mapping of voltage sensor movement in the Shaker potassium channel. Nature. 402 (6763), 813-817 (1999).
  61. Dai, G., Aman, T. K., DiMaio, F., Zagotta, W. N. The HCN channel voltage sensor undergoes a large downward motion during hyperpolarization. Nat Struct Mol Biol. 26 (8), 686-694 (2019).
  62. Renart, M. L., et al. Conformational plasticity in the KcsA potassium channel pore helix revealed by homo-FRET studies. Sci Rep. 9 (1), 6215 (2019).
  63. Wang, S., et al. Potassium channel selectivity filter dynamics revealed by single-molecule FRET. Nat Chem Biol. 15 (4), 377-383 (2019).
  64. Harley, C. A., et al. Conformation-sensitive antibody reveals an altered cytosolic PAS/CNBh assembly during hERG channel gating. Proc Natl Acad Sci U S A. 118 (44), e2108796118 (2021).
  65. Han, S., et al. Structural dynamics determine voltage and pH gating in human voltage-gated proton channel. Elife. 11, e73093 (2022).
  66. Cullinan, M. M., Klipp, R. C., Camenisch, A., Bankston, J. R. Dynamic landscape of the intracellular termini of acid-sensing ion channel 1a. Elife. 12, e90755 (2023).
  67. Kim, J., Won, J., Chung, D. K., Lee, H. H. FRET analysis of the temperature-induced structural changes in human TRPV3. Sci Rep. 13 (1), 10108 (2023).
  68. Zheng, J., Zagotta, W. N. Patch-clamp fluorometry recording of conformational rearrangements of ion channels. Sci STKE. 2003 (176), PL7 (2003).
  69. Kusch, J., Zifarelli, G. Patch-clamp fluorometry: electrophysiology meets fluorescence. Biophys J. 106 (6), 1250-1257 (2014).
  70. Cowgill, J., Chanda, B. The contribution of voltage clamp fluorometry to the understanding of channel and transporter mechanisms. J Gen Physiol. 151 (10), 1163-1172 (2019).
  71. Bhat, S., Blunck, R. Characterising ion channel structure and dynamics using fluorescence spectroscopy techniques. Biochem Soc Trans. 50 (5), 1427-1445 (2022).
  72. Yamada, T., Figueroa, E. E., Denton, J. S., Strange, K. LRRC8A homohexameric channels poorly recapitulate VRAC regulation and pharmacology. Am J Physiol Cell Physiol. 320 (3), C293-C303 (2021).
  73. Yamada, T., Wondergem, R., Morrison, R., Yin, V. P., Strange, K. Leucine-rich repeat containing protein LRRC8A is essential for swelling-activated Cl- currents and embryonic development in zebrafish. Physiol Rep. 4 (19), e12940 (2016).
  74. Pervaiz, S., Kopp, A., von Kleist, L., Stauber, T. Absolute protein amounts and relative abundance of volume-regulated anion channel (VRAC) LRRC8 subunits in cells and tissues revealed by quantitative immunoblotting. Int J Mol Sci. 20 (23), 5879 (2019).
  75. Kern, D. M., et al. Structural basis for assembly and lipid-mediated gating of LRRC8A:C volume-regulated anion channels. Nat Struct Mol Biol. 30 (6), 841-852 (2023).
  76. Rutz, S., Deneka, D., Dittmann, A., Sawicka, M., Dutzler, R. Structure of a volume-regulated heteromeric LRRC8A/C channel. Nat Struct Mol Biol. 30 (1), 52-61 (2023).
  77. Li, P., et al. LRRC8 family proteins within lysosomes regulate cellular osmoregulation and enhance cell survival to multiple physiological stresses. Proc Natl Acad Sci U S A. 117 (46), 29155-29165 (2020).
  78. Kashyap, P., et al. An optogenetic method for the controlled release of single molecules. Nat Methods. 21 (4), 666-672 (2024).
  79. Liu, T., Stauber, T. The volume-regulated anion channel LRRC8/VRAC is dispensable for cell proliferation and migration. Int J Mol Sci. 20 (11), E2663 (2019).
  80. Zhang, Y., et al. Polarized NHE1 and SWELL1 regulate migration direction, efficiency and metastasis. Nat Commun. 13 (1), 6128 (2022).
This article has been published
Video Coming Soon
Keep me updated:

.

Cite This Article
Klüssendorf, M., Pervaiz, S., Stauber, T. Monitoring Leucine-Rich Repeat Containing 8 Channel (LRRC8/VRAC) Activity using Sensitized-Emission Förster Resonance Energy Transfer (SE-FRET). J. Vis. Exp. (210), e66953, doi:10.3791/66953 (2024).

View Video