출처: 페이만 샤베이기-루드포스티와 시나 샤바즈모하마디, 생물의학 공학과, 코네티컷 대학교, 스토스, 코네티컷
심전도는 심장 활동을 입증하기 위해 환자의 몸통에 놓인 전극 사이에 발생하는 전기 전위 적 변화에 의해 기록된 그래프입니다. 심전도 신호는 심장 리듬과 심장에 대한 혈액 흐름 저하 및 구조적 이상과 같은 많은 심장 질환을 추적합니다. 심장 벽의 수축에 의해 생성 된 행동 잠재력은 몸 전체에 심장에서 전류를 확산. 확산 전류는 피부에 배치된 전극에 의해 감지될 수 있는 바디의 지점에서 다른 잠재력을 만듭니다. 전극은 금속과 염으로 만든 생물학적 트랜스듀서입니다. 실제로, 10 전극은 바디에 다른 점에 붙어 있습니다. 심전도 신호를 획득하고 분석하기 위한 표준 절차가 있습니다. 건강한 개인의 전형적인 심전도 물결은 다음과 같습니다.
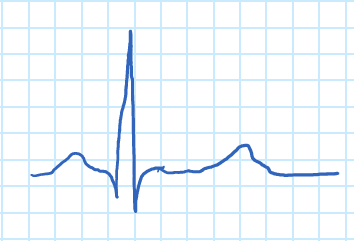
그림 1. 심전도 파동.
“P” 웨이브는 심방 수축에 해당하며, “QRS” 복합체는 심실의 수축에 해당합니다. “QRS’ 복합체는 아리아와 심실의 근육 질량에 상대적으로 발포성으로 인해 “P”파보다 훨씬 크며, 이는 아리아의 이완을 가리는 것입니다. 심실의 이완은 “T”파의 형태로 볼 수 있습니다.
도 2에 도시된 바와 같이 팔과 다리 의 전기 전위 차이를 측정하는 세 가지 주요 리드가 있습니다. 이 데모에서는 사지 리드 중 하나인 리드 I가 검사되고 두 팔 간의 전기 전위 차가 기록됩니다. 모든 심전도 리드 측정과 마찬가지로 오른쪽 다리에 연결된 전극은 접지 노드로 간주됩니다. 심전도 신호는 생체 전위 증폭기를 사용하여 획득한 다음 계측 소프트웨어를 사용하여 표시되며, 진폭을 조정하기 위해 게인 제어가 생성됩니다. 마지막으로, 기록된 심전도를 분석합니다.
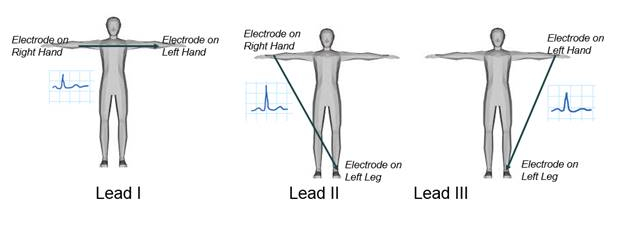
그림 2. 심전도 사지 리드.
심전도는 0.5mV에서 5.0mV에 이르는 매우 약한 신호뿐만 아니라 최대 ±300mV(전극 피부 접촉에서 발생)의 DC 구성 요소와 최대 1.5V의 공통 모드 구성 요소뿐만 아니라 전극과 지면 사이의 잠재력에서 발생하는 공통 모드 구성 요소를 감지할 수 있어야 합니다. ECG 신호의 유용한 대역폭은 응용 프로그램에 따라 다르며 0.5-100Hz범위의 범위로, 때로는 최대 1kHz에 도달할 수 있습니다. 일반적으로 훨씬 더 큰 외부 고주파 노이즈, 50 또는 60Hz 간섭 및 DC 전극 오프셋 전위가 있는 경우 일반적으로 약 1mV 피크-투 피크입니다. 소음의 그밖 근원은 피부 전극 인터페이스, 근육 수축 또는 전기 역학 스파이크, 호흡 (리듬 또는 산발적일지도 모르다), 전자기 간섭 (EMI), 및 입력에 결합하는 그밖 전자 장치에서 소음에 영향을 미치는 운동을 포함합니다.
첫째, 심전도 증폭기를 생산하여 심전도를 처리합니다. 그런 다음, 전극은 두 팔 사이의 잠재적 차이를 측정하기 위해 환자에 배치됩니다. 생물 전위 증폭기의 주요 기능은 생물학적 기원의 약한 전기 신호를 취하고 진폭을 증가하여 추가 처리, 기록 또는 표시될 수 있도록 하는 것입니다.
그림 3. 심전도 증폭기.
생물학적으로 유용하기 위해 모든 생물 잠재력 증폭기는 다음과 같은 기본 요구 사항을 충족해야 합니다.
도 3은 심전도 증폭기의 예이며, 도 4는 이 데모 중에 구축되는 심전도 증폭기의 회로이다. 보호 회로, 계측 증폭기 및 하이 패스 필터의 세 가지 주요 단계가 있습니다.
그림 4. 생물 잠재력 증폭기.
첫 번째 단계는 환자 보호 회로입니다. 다이오드는 한 방향으로 전류를 수행하는 반도체 장치입니다. 다이오드가 전방편향이 발생하면 다이오드는 단락 역할을 하며 전기를 전도합니다. 다이오드가 역편향되면 개방 회로역할을 하며 전기를 전도하지 않으며,나는 ≈ 0을 ≈.
다이오드가 전방 편향 된 구성에있을 때 다이오드가 전류를 수행하기 위해 초과되어야하는 임계 전압 (VT = 약 0.7 V)으로 알려진 전압이 있다. VT를 초과하면 다이오드 전체의 전압 강하는VIn에 관계없이 VT에서 일정하게 유지됩니다.
다이오드가 역편향되면 다이오드는 개방 회로에서 와 같이 작동하며 다이오드 를 가로 질러 전압 강하가V와같습니다.
도 5는 이 데모에서 사용될 다이오드를 기반으로 하는 간단한 보호 회로의 예입니다. 저항기는 환자를 통해 흐르는 전류를 제한하는 데 사용됩니다. 계측 증폭기 또는 다이오드의 결함이 전원 레일 중 하나와 환자의 연결을 단락하는 경우 전류는 0.11 mA 미만입니다. FDH333 저누설 다이오드는 계측 증폭기의 입력을 보호하는 데 사용됩니다. 회로의 전압이 크기0.8V를 초과할 때마다 다이오드는 활성 영역 또는 “ON” 상태로 변경됩니다. 전류는 그(것)들을 통해 흐르고 환자와 전자 분대를 둘 다 보호합니다.
그림 5. 보호 회로.
두 번째 단계는 3개의 작동 증폭기(op-amp)를 사용하는 계측 증폭기 IA입니다. 입력 저항을 높이기 위해 각 입력에 하나의 op-amp가 부착되어 있습니다. 세 번째 op-amp는 차동 증폭기입니다. 이 구성은 접지 참조 간섭을 거부하고 입력 신호 사이의 차이만 증폭할 수 있습니다.
그림 6. 계측 증폭기.
세 번째 단계는 대형 DC 전압 위에 타는 작은 AC 전압을 증폭시키는 데 사용되는 하이 패스 필터입니다. 심전도는 환자의 움직임과 호흡에서 오는 저주파 신호에 의해 영향을 받습니다. 높은 패스 필터는 이 노이즈를 줄입니다.
하이 패스 필터는 1차 RC 회로로 실현될 수 있습니다. 도 7은 첫 번째 주문 하이패스 필터 및 전송 기능의 예를 보여 주어 있다. 컷오프 빈도는 다음 수식에 의해 제공됩니다.
,
그림 7. 높은 패스 필터.
In this demonstration, three electrodes were connected to an individual, and the output passed through a biopotential amplifier. A sample ECG graph prior to digital filtering is shown below (Figure 8).
Figure 8. ECG signal without digital filtering.
After designing the filters and feeding the data to the developed algorithm, the peaks on the graph were detected and used to calculate heart beat rate (BPM). Figure 9 displays the raw data an ECG signal (before any filtering) in time and frequency domain. Figure 10 shows the result of filtering that signal.
Figure 9. ECG signal before filtering.
Figure 10. Filtered ECG signal.
The original ECG plot had slightly visible P, QRS, and T complexes that presented many fluctuations from the noise. The spectrum of the ECG signal also showed a clear spike at 65 Hz, which was assumed to be noise. When the signal was processed using a low-pass filter to remove extraneous high frequency portions and then a band-stop filter to remove the 65 Hz signal component, the output appeared significantly cleaner. The ECG shows each component of the signal clearly with all noise removed.
In addition, the measured heart rate was approximately 61.8609 beats per minute.
Contraction of cardiac muscle during the heart cycle produces electric currents within the thorax. Voltage drops across resistive tissue are detected by electrodes placed on the skin and recorded by an electrocardiograph. Since the voltage is weak, in the range of 0.5 mV, and small compared to the magnitude of noise, processing and filtering the signal is necessary. In this experiment, an electrocardiograph device consisting of a two part analog and digital signal processing circuit was designed to analyzing the resulting ECG signal, and calculate the heartbeat rate.
This demonstration introduced the fundamentals of electronic circuitry and filtering of ECG signals. Here, practical signal processing techniques were used to extract a weak signal from a noisy background. These techniques can be used in other similar applications where signal amplification and noise reduction is required.
Materials List
Name | Company | Catalog Number | Comments |
Equipment | |||
Power supply | B&K Precision | 1760A | |
Multimeter | |||
Oscilloscope | |||
Proto-board | |||
4 FDH333 diodes | |||
1 AD620 | |||
3 47kΩ resistor | |||
2 100nF capacitors | |||
3 ECG electrodes | |||
Several alligator clips and Tektronix probe. |
Electrocardiographs record cardiac activity of the heart and are used to diagnose disease, detect abnormalities, and learn about overall heart function. Electrical signals are produced by contractions in the heart walls which drive electrical currents and create different potentials throughout the body. By placing electrodes on the skin, one can detect and record this electrical activity in an ECG. ECGs are non-invasive, making them a useful tool to assess how well a patients heart is performing, such as by measuring how well blood flows to the organ.
This video will illustrate the principals of ECGs and demonstrate how to acquire, process, and analyze a typical ECG signal using a biopotential amplifier. Other biomedical applications that utilize electrical signal processing to diagnose disease will also be discussed.
To understand the principles of an ECG, let’s first understand how the heart produces electrical signals. For a normal, healthy heart, at rest, an ECG displays a series of waves that reflect the different phases of a heartbeat. The ECG starts in the sinoatrial node, also known as the SA node, which is located in the right atrium and acts as a pacemaker in the heart. The electrical signals cause atrial contraction forcing blood into the ventricles. This sequence is recorded as the P wave on the ECG. This signal then passes from the atria across the ventricles, causing them to contract and pump blood to the rest of the body. This is recorded as the QRS complex.
Finally, the ventricles relax and this is recorded as the T wave. The process then begins again and is repeated for every heartbeat. Notice that the QRS wave is much larger than the P wave, this is because the ventricles are larger than the atria. Meaning they mask the relaxation of the atria or the T wave. Other processes in the body, like respiration or muscle contractions, can interfere with the ECG measurement. As can currents from the circuitry used to obtain them. Often, the electrical signals that the ECG is attempting to record are quite weak. Therefor, a biopotential amplifier is used to increase their amplitude which allows them to be further processed and recorded.
There are three main components to the biopotential amplifier, the patient protection stage, the instrumentation amplifier, and the high pass filter. As the main suggests, the patient protection circuit uses a combination of resistors and diodes to protect, both, the patient and the machine and equipment. The resistors limit the current that flows through the patient, where as the diodes keep the current flowing in the correct direction.
The next stage is the instrumentation amplifier, which amplifies the difference between the inputs from each electrode. It is composed of three operational amplifiers. Two to increase the resistance from each input, and the third to amplify the difference between the input signals.
The last stage is the high pass filter, which reduces the noise and filters out low frequency signals arising from patient movement or respiration. Now that you know how an ECG is measured, let’s see how to construct a biopotential amplifier and process the data to get a clean ECG signal.
Having reviewed the main principals of electrocardiography, let’s see how to build a biopotential amplifier and acquire an ECG signal. To begin, first gather a proto-board, an AD-620 instrumentation amplifier, and all necessary circuit components. Then, calculate the values of all of the resistors and capacitors in the circuit using the following equation.
For the high pass filter, the cut off frequency should be 0.5 hertz.
Then, plug in the capacitor value to determine the resistance. Next, build a biopotential amplifier according to the provided diagram. Here is what the final circuit should look like. Attach three wires with alligator clips to the binding posts of a DC power supply, then turn on the power source. Adjust the voltage to plus five volts and minus five volts, and connect the the wires, in series, to the circuit.
Now, use an alcohol prep pad to wipe the patients right wrist, left wrist, and right ankle. Add conductive adhesive gel to the electrodes before placing them on the patient. Then, connect the electrodes to the circuit using wires with alligator clips. Turn on the oscilloscope and acquire the ECG signal. Adjust the horizontal and vertical scales as needed. With these adjustments, you should be able to see the R peak of the wave form.
Connect the circuit to the PXI chassis, then open the instrumentation software and, either, use or write a program that will display the ECG signal and a wave form graph.
Configure the data acquisition interface with the following settings. Label the scale of the x-axis to display time and seconds, then display the ECG signal as a waveform. If the signal needs to be amplified, create a gain control and set it so that the amplitude of the ECG is two VP.
Now that we have demonstrated how to acquire an ECG signal, let’s see how to analyze the results. Here is a representative ECG signal. The P, QRS, and T waves are barely discernible because they are obscured by noise and fluctuations. This signal needs to be filtered. To transform this signal, first, select Signal Processing then Spectral on the menu. A Fast Fourier Transform algorithm calculates and plots the spectrum of the signal displaying the frequency as discreet values on the horizontal axis. Most of the energy in the signal is at low frequencies.
But, there is a high intensity peak in the medium frequency range, which is assumed to be noise. Frequency is plotted as k on the horizontal axis and goes from zero to N minus one over two, where N is the length of the sequence. For this experiment, N equals 2,000. Calculate the analog frequency for each k value using the following equation, where f s is the sampling frequency and determine the frequency of the high intensity peak based on the FFT graph.
Then, create a low pass filter with a cutoff frequency of 100 hertz. Use, either, the Butterworth or Chebyshev function to filter the signal, which should attenuate at least 60 decibels per decade in the stop band. Connect the output signal of the data sub VI to the input of the low pass filter. This filter removes the extraneous high frequency waves of the ECG. Now, create a Bandstop filter and set the cutoff frequencies at around 55 and 70 hertz.
To remove the noisy signal, around 60 hertz. Then, connect the output of the low pass filter to the input of the Bandstop filter. Try border frequencies that are close to 60 hertz. This will reduce interference without effecting other frequencies. The ECG signal should now be clear with distinct P, QRS, and T complexes.
Now, let’s determine the heart rate using the filtered ECG signal. First, use the peak detector sub VI to find the peaks of the signal. Choose the most appropriate value based on the signals amplitude of the R wave for the threshold. Then, use the Index Array sub VI to determine the location of the peaks.
Subtract the lower peak position from the higher position, then multiply this value by the sampling period, T, which is equal to one over f s. This value is the length of time between two R waves. Adjust the units to determine the beats per minute.
In this demonstration, the measured heart rate was approximately 60 beats per minute.
ECG and signal processing have important applications in, both, medicine and research. In addition to being non-invasive, ECGs are relatively inexpensive. Making it a useful and accessible tool in hospitals. ECGs can even be adapted to more complex and longterm monitoring of patients who are being treated for Acute Coronary Syndrome.
For this, 12 ECG leads are used, which can identify transient myocardial ischemia in asymptomatic patients. Signal sampling and processing is also used in electroencephalography to measure electrical signals from the brain. EEGs are commonly used in conjunction with functional MRI as a multimodal imaging technique.
The method noninvasively generates cortical maps of brain activity for many neuroimaging applications, such as after visual or motor activation.
You’ve just watched Jove’s introduction to acquiring and analyzing ECG signals. You should now understand how an ECG signal is produced and how to create a biopotential amplifier to detect weak electrical signals. You have also seen some biomedical applications of signal processing for medical diagnosis.
Thanks for watching.