Highly Efficient Transfection of Primary Macrophages with In Vitro Transcribed mRNA
Summary
Macrophages, especially primary macrophages, are challenging to transfect as they specialize in detecting molecules of non-self origin. We describe a protocol that allows highly efficient transfection of primary macrophages with mRNA generated from DNA templates such as plasmids.
Abstract
Macrophages are phagocytic cells specialized in detecting molecules of non-self origin. To this end, they are equipped with a large array of pattern recognition receptors (PRRs). Unfortunately, this also makes macrophages particularly challenging to transfect as the transfection reagent and the transfected nucleic acids are often recognized by the PRRs as non-self. Therefore, transfection often results in macrophage activation and degradation of the transfected nucleic acids or even in suicide of the macrophages. Here, we describe a protocol that allows highly efficient transfection of murine primary macrophages such as peritoneal macrophages (PM) and bone marrow-derived macrophages (BMDM) with mRNA in vitro transcribed from DNA templates such as plasmids. With this simple protocol, transfection rates of about 50-65% for PM and about 85% for BMDM are achieved without cytotoxicity or immunogenicity observed. We describe in detail the generation of mRNA for transfection from DNA constructs such as plasmids and the transfection procedure.
Introduction
Macrophages are phagocytic cells that specialize in detecting, ingesting and degrading microbes, apoptotic cells and cellular debris. Moreover, they help to orchestrate immune responses by secreting cytokines and chemokines and by presenting antigens to T cells and B cells. Macrophages also play important roles in numerous other processes, such as wound healing, atherosclerosis, tumorigenesis and obesity.
To be able to detect non-self molecules such as pathogen-associated molecular patterns (PAMPs) and out-of-place molecules such as damage-associated molecular patterns (DAMPs), macrophages are equipped with a large array of pattern recognition receptors (PRR)1. Unfortunately, this also makes macrophages particularly challenging to transfect2 as the transfection reagent3 and the transfected nucleic acids4,5,6,7 often are recognized by the PRRs as non-self. For this reason, transfection of macrophages using chemical or physical methods8 usually results in macrophage activation and degradation of the transfected nucleic acids or even in macrophage suicide via pyroptosis, a form of programmed lytic cell death triggered after recognition of cytosolic PAMPs/DAMPs such as DNA or foreign RNA9. Biological transfection of macrophages using viruses such as adenoviruses or lentiviruses as vectors is often more efficient, yet construction of such viral vectors is time-consuming and requires biosafety level 2 equipment10,11.
Thus, although macrophages are the subject of intensive research, analysis of their functions on the molecular level is hampered because one of the most important tools of molecular biology, the transfection of nucleic acid constructs for exogenous expression of proteins, is hardly applicable. This often forces researchers to use macrophage-like cell lines rather than bona fide macrophages. Applications for nucleic acid construct transfection include expression of mutated or tagged protein versions, overexpression of a specific protein, protein re-expression in a respective knockout background and expression of proteins from other species (e.g., Cre recombinase or guide RNA and Cas9 for targeted gene knockout).
Here, we describe a protocol that allows highly efficient transfection of (usually hard to transfect) primary macrophages, that is murine peritoneal macrophages (PM) and bone marrow-derived macrophages (BMDM) with mRNA generated from DNA templates such as plasmids. Importantly, the in vitro transcribed mRNA generated using this protocol contains the naturally occurring modified nucleosides 5-methyl-CTP and pseudo-UTP that reduce immunogenicity and enhance stability4,6,7,12,13. Moreover, the 5'-ends of the in vitro transcribed mRNA are dephosphorylated by Antarctic phosphatase to prevent recognition by the RIG-I complex14,15. This minimizes innate immune recognition of the in vitro transcribed mRNA. With our easy to perform protocol, transfection rates between 50-65% (peritoneal macrophages (PM)) and 85% (BMDM) are reached while, importantly, there is no cytotoxicity or immunogenicity observed. We describe in detail (i) how the immunologically silenced mRNA for transfection can be generated from DNA constructs such as plasmids and (ii) the transfection procedure itself.
Protocol
Macrophage isolation from mice was performed in accordance with the Animal Protection Law of Germany in compliance with the Ethics Committee at the University of Cologne.
NOTE: Carry out all steps wearing gloves. Carry out all transfection steps under a laminar flow hood to prevent contamination of the cells. Before working with mRNA, clean all instruments such as pipettes and every surface with 70% ethanol and/or a RNAse-degrading surfactant (Table of Materials). Ensure that all reaction tubes are RNAse-free and sterile. Use only sterile, RNAase-free water for dilutions. Exclusively use pipette tips with filters. Change pipette tips after every pipetting step.
1. Generation of the DNA Template
NOTE: The DNA template for in vitro mRNA transcription using this protocol must contain a T7 promotor sequence to allow docking of the RNA polymerase. If the plasmid containing the DNA sequence of the protein of interest already contains a correctly orientated T7 promotor sequence directly upstream of the sequence of interest, linearization of the plasmid (see step 1.1.) needs to be performed. Otherwise, attach a T7 promotor to the sequence of interest by polymerase chain reaction (PCR, see step 1.2.).
- Linearization of T7 promotor-containing plasmids
- Linearize plasmids already containing a correctly orientated T7 promotor sequence by digestion with a restriction enzyme cutting downstream of the stop codon of the sequence of interest. Otherwise, transcription will not end properly after the sequence of interest.
NOTE: It is best to use restriction enzymes leaving blunt ends or 5' overhangs. - Confirm complete linearization of the plasmid by agarose gel electrophoresis of undigested versus digested plasmid DNA.
- Purify linearized plasmid DNA prior to use as DNA template for in vitro mRNA transcription using a DNA purification kit (Table of Materials).
- Linearize plasmids already containing a correctly orientated T7 promotor sequence by digestion with a restriction enzyme cutting downstream of the stop codon of the sequence of interest. Otherwise, transcription will not end properly after the sequence of interest.
- Attachment of the T7 promotor by PCR
- Use a forward primer containing the following components (in the indicated order from 5' to 3'): about 5 random bp upstream of the promotor (e.g., GAAAT); the T7 promotor sequence (TAATACGACTCACTATAG); two extra Gs for increased transcription efficiency (GG); the target sequence-specific part that is homologous to the plasmid sequence surrounding the start codon.
NOTE: It should be composed of: 3-6 bp upstream of the KOZAK sequence and start codon, the KOZAK sequence and start codon (usually GCCACC ATG G), 12-18 bp downstream of the start codon. If the sequence of interest does not already contain a KOZAK sequence or start codon, these can be attached in this step by simply including them in the primer sequence. - Calculate the tm of the forward primer only by taking into account the part homologous to the target sequence.
- To assess dimers/hairpin formation use the whole primer sequence, which easily can exceed 50 bp.
- Use a reverse primer located somewhere downstream of the stop codon.
NOTE: If the sequence of interest doesn't already contain a stop codon, it can be attached in this step by simply including it in the primer sequence. - Use the forward and reverse primers to perform a PCR using a high-fidelity polymerase with proofreading (Table of Materials).
- Confirm generation of a single product and amplicon size by agarose gel electrophoresis (e.g., use a 1% agarose gel and 100 V constant current).
- Purify the PCR product prior to use as DNA template for in vitro mRNA transcription using a DNA purification kit.
- Use a forward primer containing the following components (in the indicated order from 5' to 3'): about 5 random bp upstream of the promotor (e.g., GAAAT); the T7 promotor sequence (TAATACGACTCACTATAG); two extra Gs for increased transcription efficiency (GG); the target sequence-specific part that is homologous to the plasmid sequence surrounding the start codon.
2. mRNA Generation
- Thaw all components of the in vitro mRNA transcription kit (see the Table of Materials). Vortex for 5 s and spin down for 2 s at 2,000 x g. Keep on ice until use.
- Prepare the reaction mix for in vitro mRNA transcription in a 0.5 mL microcentrifuge tube in the following order (total volume of 40 µL): 20 µL of 10x ARCA/NTP mix (included in the in vitro mRNA transcription kit); 0.25 µL of 5-methyl-CTP (final concentration (f.c.) is 1.25 mM; 50% of total CTP); 0.25 µL of pseudo-UTP (f.c. is 1.25 mM; 50% of total UTP); X µL of DNA template; 2 µL of T7 RNA polymerase mix (included in the in vitro mRNA transcription kit); Y µL of RNAse-free H2O.
NOTE: X is a volume containing at least 1 µg of DNA. For example, 1.6 µL from a 625 ng/µL stock solution. Y is the spare volume to the total volume of 40 µL. - Vortex for 5 s and spin down for 2 s at 2,000 x g. Incubate at 37 °C for 30 min at 400 rpm on a thermal mixer for in vitro transcription.
- Then, add 2 µL of DNase I directly into the reaction mix for removal of the template DNA. Vortex for 5 s and spin down for 2 s at 2,000 x g.
- Incubate at 37 °C for 15 min at 400 rpm on a thermal mixer. Take an aliquot of 2 µL for the control gel (step 3.3) and store at -80 °C.
- For poly(A) tailing, add the following components directly into the previous reaction mix (to a final volume of 50 µL): 5 µL of 10x poly(A) polymerase reaction buffer and 5 µL of poly(A) polymerase (both included in the in vitro mRNA transcription kit). Vortex for 5 s and spin down for 2 s at 2,000 x g.
- Incubate the mix at 37 °C for 30 min at 400 rpm on a thermomixer. Take an aliquot of 2 µL for the control gel (step 3.3) and store at -80 °C.
- For dephosphorylation of the 5´-ends of the mRNA, add the following components directly into the previous reaction mix (to a final volume of 60 µL): 3 µL of RNAse-free H2O; 6 µL of 10x Antarctic phosphatase reaction buffer; 3 µL of Antarctic phosphatase (15 units for 60 µL reaction volume). Vortex for 5 s and spin down for 2 s at 2,000 x g.
- Incubate the mix at 37 °C for 30 min at 400 rpm on a thermal mixer.
- Heat-inactivate Antarctic phosphatase by incubation at 80 °C for 2 min.
NOTE: Ideally, use a separate thermal mixer, do not wait until the first mixer reaches the desired temperature.
3. mRNA Purification
- Purify the in vitro transcribed mRNA using a dedicated RNA purification kit (Table of Materials).
- Add X µL of elution solution to the mRNA reaction mix from step 2.10. Mix by inverting 5 times. Add 300 µL of binding solution concentrate. Mix by gentle pipetting 5 times.
NOTE: X is the spare volume to a total volume of 100 µL. For example, add 40 µL elution solution to 60 µL mRNA reaction mix. - Add 100 µL of RNAase-free ethanol. Mix by gentle pipetting 5 times.
- Place a filter column in one of the supplied collection tubes. Transfer the mRNA reaction mix gently onto the center of the filter without touching the filter. Centrifuge at 15,000 x g for 1 min at room temperature (RT).
- Carefully lift the filter column and discard the flow-through in the collection tube. Place the filter column back into the same collection tube.
- Add 500 µL of wash solution (do not forget to add 20 mL of RNAase-free ethanol before using the wash solution for the first time).
- Centrifuge at 15,000 x g for 1 min at RT. Repeat steps 3.1.4-3.1.6 to wash one more time.
- Centrifuge at full speed (17,900 x g) for 1 min at RT to remove any residual fluid from the filter column. Carefully take the filter column from the collection tube. Place the filter column in a new collection tube.
- Add 50 µL of elution buffer onto the center of the filter without touching the filter. Incubate at 65 °C for 10 min on a thermal mixer.
- Centrifuge at 15,000 x g for 1 min at RT. Remove the filter column and discard it.
- Add X µL of elution solution to the mRNA reaction mix from step 2.10. Mix by inverting 5 times. Add 300 µL of binding solution concentrate. Mix by gentle pipetting 5 times.
- Measure the concentration and purity of the eluted mRNA, for example, by using a microvolume spectrophotometer to measure absorbance at 260 and 280 nm.
NOTE: An A260/A280 ratio of 1.8-2.1 is indicative of highly purified mRNA. - Verify presence of a single product, correct transcript length and poly(A) tailing by analyzing the aliquots from steps 2.5 and 2.7 by agarose gel electrophoresis under denaturing conditions (for example, use a 1.2% agarose gel containing 20 mM 3-(N-morpholino)propanesulfonic acid [MOPS], 5 mM sodium acetate, 1 mM EDTA and 20% formaldehyde and run in 20 mM MOPS, 5 mM sodium acetate, 1 mM EDTA and 0.74 % formaldehyde at 100 V constant current).
- Store the purified mRNA in the elution tube at -80 °C until transfection. If using only low amounts of the mRNA for transfection then aliquot the mRNA to avoid repeated freeze-thaw cycles.
NOTE: mRNA can be stored at -80 °C for about 1 year.
4. Macrophage Preparation
- Euthanize C57/BL6 mice (use mice of the same sex and of 6-24 weeks of age) by cervical dislocation.
NOTE: The same mice can be used for isolation of PM (step 4.2) and generation of BMDM (steps 4.3 and 4.4). For isolation of PM use at least two mice. If only BMDM are to be generated one mouse usually is enough. - Immunomagnetic enrichment of peritoneal macrophages.
- Fill a 10 mL syringe with a 0.9 x 40 mm cannula with 8 mL of ice-cold phosphate-buffered saline (PBS) and 2 mL of air. Flush the peritoneal cavity with PBS. The air will form a bubble that minimizes leakage of the PBS.
- Quickly collect peritoneal lavage with the same syringe and transfer into a 50 mL conical centrifugation tube. Combine peritoneal cells of multiple mice if required. Keep cell suspension on ice.
- Centrifuge cell suspension at 650 x g for 5 min at 4 °C. Discard the supernatant and resuspend the cell pellet in 5 mL of 0.2 % NaCl for 30 s to lyse red blood cells.
- Add 5 mL of 1.6% NaCl to a total volume of 10 mL to reconstitute isotonic conditions. Centrifuge at 650 x g for 5 min at 4 °C.
- Discard the supernatant and resuspend the cell pellet in 97.5 µL of magnetic cell sorting (MCS) buffer (2 mM ethylenediaminetetraacetic acid [EDTA], 0.5% bovine serum albumin [BSA] in PBS) per 1 peritoneal lavage (e.g., if three mice were flushed, resuspend in 292.5 µL).
- Add 2.5 µL of paramagnetic beads conjugated to an CD11b-specific antibody per 97.5 µL of cell suspension (e.g., add 7.5 µL to 292.5 µL).
- Incubate on ice for 15 min at 150 rpm on an orbital shaker.
- Centrifuge cell suspension at 650 x g for 5 min at 4 °C, discard the supernatant and resuspend the cell pellet in 1 mL of MCS buffer.
- Add 4 mL of MCS buffer to a total volume of 5 mL and wash the cells by gently pipetting up and down three times.
- Repeat steps 4.2.8 and 4.2.9 two more times for a total of three wash steps.
- During the wash steps place an LS column in a magnetic cell separator (see Table of Materials). Rinse the column with 3 mL of MCS buffer.
NOTE: Avoid any bubbles as these may clog the column. - Resuspend the cell pellet in 1 mL of MCS buffer. Add 3 mL of MCS buffer to a total volume of 4 mL, mix by pipetting up and down three times.
- Transfer the 4 mL of cell suspension onto the rinsed LS column.
NOTE: Again, avoid any bubbles as these may clog the column. - Wait until the reservoir of the column is completely empty. Do not add additional fluid until the column stops dripping.
- Add 3 mL of MCS buffer onto the column. Then, wait until the reservoir of the column is completely empty. Repeat step 4.2.15 two more times.
- Place the LS column in a 15 mL conical centrifugation tube. Apply 5 mL of MCS buffer onto the column. Wait until 2 mL of fluid has passed through the column, then use the plunger to gently push the remaining fraction into the tube.
- Centrifuge cell suspension at 650 x g for 5 min at 4 °C and discard the supernatant.
- Resuspend the cell pellet in 1 mL of DMEM supplemented with 10% heat-inactivated fetal calf serum (FCS) (DMEM+FCS).
- Determine the number of viable cells by counting in trypan blue solution in a Neubauer counting chamber and seed cells in DMEM+FCS into culture plates.
NOTE: Seed PM at a density of 100,000 cells/well in a flat bottom microtiter plate. Do not use tissue culture-treated plates as PM cannot be detached from these. Use non-treated plates instead.
- Generation of BMDM
- Remove skin and muscles from the hind legs using a pair of scissors. Wash each leg by short submersion in 70% ethanol.
- Detach legs and open both ends of the femur and the tibia by cutting with scissors.
- Fill a 5 mL syringe filled with a 0.6 mm x 30 mm cannula with 5 mL of very low endotoxin (VLE) RPMI 1640 and flush the bone marrow out of the opened bones into a culture dish.
- Combine bone marrow of multiple mice if required by repeating steps 4.3.1-4.3.3. Transfer the bone marrow into a 50 mL conical centrifugation tube.
- Centrifuge the bone marrow suspension at 650 x g for 5 min at 4 °C and discard the supernatant.
- Resuspend the cell pellet in 5 mL of red blood cell lysis buffer (8.3% NH4Cl, 0.1 M Tris) and incubate for 5 min at RT to lyse the red blood cells.
- Centrifuge the cell suspension at 650 x g at 4° C for 5 min and discard the supernatant.
- Resuspend the cell pellet in 1 mL of VLE RPMI 1640 medium supplemented with 10% FCS, 1% penicillin/streptomycin, 1% HEPES, 1% sodium pyruvate and 10 ng/mL recombinant macrophage colony-stimulating factor (M-CSF) (RPMI+++++).
- Add 4 mL of RPMI+++++ to a total volume of 5 mL.
- Prepare 5 92 mm x 16 mm untreated Petri dishes with cams (see the Table of Materials) per mouse by pipetting 7 mL of RPMI+++++ medium into each dish.
- Transfer the 1 mL of cell solution to the 5 prepared culture dishes and incubate at 37 °C and 5% CO2.
- After 4 days, feed the cells by adding 4 mL of RPMI+++++. After 6-7 days, the bone marrow cells are fully differentiated into BMDM.
- Harvesting of BMDM
- Completely remove the medium from culture dishes. Add 5 mL of warm 0.2 mM EDTA in PBS to each dish.
- Gently scrape the whole plate with a cell scraper to detach the BMDM. Combine the cell suspensions in a 50 mL conical centrifugation tube.
- Flush all 5 dishes again. Use the same volume of 5 mL of warm 0.2 mM EDTA in PBS for all 5 dishes. Combine this cell suspension with the one from the previous step.
- Centrifuge the cell suspension at 650 x g for 5 min at 4° C and discard the supernatant.
- Resuspend the cell pellet in 1 mL of VLE RPMI 1640 medium supplemented with 10% FCS, 1% HEPES, 1% sodium pyruvate and 10 ng/mL recombinant M-CSF but no antibiotics (RPMI++++).
- Determine the number of viable cells by counting in trypan blue solution in a Neubauer counting chamber and seed cells in RPMI++++ into culture plates.
NOTE: Seed BMDM at a density of 50,000 cells/well maximum in a flat bottom microtiter plate. Do not use tissue culture-treated plates as BMDM can hardly be detached from these. Use non-treated plates instead.
5. Transfection of Macrophages with mRNA
- Calculate the required volume of mRNA transfection buffer.
NOTE: The volume of mRNA transfection buffer required depends on well size: use 200 µL for transfection in a 6-well plate, 100 µL in a 12-well plate and so on. Always add a little spare volume because of pipetting loss (but not too much, to prevent undue dilution of mRNA). For example, use 450 µL instead of 4 x 100 µL = 400 µL to transfect in 4 wells of a 12-well plate. - Calculate the required volume of mRNA transfection reagent. The mRNA transfection reagent is added at a ratio of 1:50. For example, 9 µL of mRNA transfection reagent is required for a final volume of 450 µL.
- Calculate the total amount of mRNA required. At least 100 ng per 100,000 macrophages are required for efficient transfection, 200 ng works even better (e.g., 800 ng mRNA to transfect 400,000 macrophages).
- Multiply the calculated amount of mRNA required with the total number of wells that have to be transfected (e.g., 4 wells with 400,000 macrophages each: 4 x 800 ng = 3,200 ng mRNA is required in total for all wells). For example, if your mRNA stock is 426.8 ng/µL, 7.49 µL are needed for optimal transfection of 4 wells with 400,000 macrophages each.
- Add the calculated volume of mRNA transfection buffer (step 5.1.) minus the volumes for mRNA transfection reagent (step 5.2) and the mRNA (step 5.3) to a reaction tube. For example, 450 µL – 9 µL – 7.49 µL = 433.51 µL.
- Thaw the mRNA stock and mix it by gentle flipping of the elution tube. Add the calculated volume of mRNA (step 5.3) to the reaction tube with mRNA reaction buffer (in the example presented above: 7.49 µL in 433.51 µL).
- Vortex for 5 s and spin down for 2 s at 2,000 x g.
- Vortex the mRNA transfection reagent for 5 s and spin down for 2 s at 2,000 x g.
- Add the calculated volume of mRNA transfection reagent (step 5.2) to the reaction tube containing the mRNA transfection buffer and the mRNA (in the example presented above: 9 µL of mRNA transfection reagent).
- Vortex the transfection mix for 5 s and spin down for 2 s at 2,000 x g.
- Incubate for 15 min at RT.
- Meanwhile, replace the culture medium of the macrophages with fresh, warm culture medium (see steps 4.2.18. and 4.4.5).
- After the incubation step 5.10, add the transfection mix to the wells containing the macrophages in a volume appropriate for the size of the well (see step 5.1). Add the transfection mix dropwise in a circle from the outside to the middle of the well.
- Gently rock the plate, first in a vertical and then in a horizontal direction to ensure uniform distribution of the transfection mix in the well. Then, incubate at 37 °C and 5 % CO2. Synthesis of the protein encoded by the transfected mRNA will begin shortly after transfection. For best results, incubate for at least 6 h.
- After the incubation, analyze transfection efficiency by (immuno)fluorescence microscopy, flow cytometry or immunoblot16, or use the transfected macrophages for the experiment of choice.
Representative Results
We have successfully used this protocol to generate mRNA encoding for FLAG-tagged NEMO and IKKβ variants for transfection of primary macrophages16. The plasmids encoding for FLAG-tagged wild-type (NEMOWT) and C54/347A mutant NEMO (NEMOC54/374A) (see the Table of Materials) already contain a T7 promotor in the correct orientation (Figure 1A). Thus, we only had to linearize the plasmids to generate DNA templates for in vitro transcription. To this end, 10 µg of plasmid DNA were digested with 5 µL Xbal resulting in linearization of the plasmid due to a single cut 3' of the stop codon. Complete linearization of the plasmid DNA was verified by agarose gel electrophoresis (Figure 1B).
The plasmids encoding for FLAG-tagged wild-type (IKKβWT) and S177/181E mutant IKKβ (IKKβS177/181E) do not contain a T7 promotor. Therefore, we have attached a T7 promotor by PCR to generate the DNA templates for in vitro transcription (Figure 2A). Generation of a specific PCR product, i.e., a single product of correct size, was verified by agarose gel electrophoresis (Figure 2B).
After in vitro transcription using the respective DNA templates, we verified generation of a single mRNA product of correct size and poly(A) tailing by agarose gel electrophoresis under denaturing conditions (Figure 3).
To verify that mRNA generated using this protocol does enable the transfection of primary macrophages (see Figure 4A,B for flow cytometric analyses of immunomagnetic enrichment of PM and differentiation status of BMDM), we have generated mRNA encoding for eGFP (Figure 5A-C) and analyzed transfection efficiency by flow cytometry (Figure 6A). 100,000 PM or 50,000 BMDM per well of an untreated microtiter plate were transfected with 50, 100 or 200 ng of eGFP mRNA for 6, 9 or 24 h. In both PM and BMDM, high levels of eGFP expression could be detected at 6 h after transfection. Transfection rate increased with the amount of transfected mRNA and was highest for 200 ng mRNA (Figure 6B,C). For PM, transfection rate reached about 50-65% at 6 to 9 h after transfection (Figure 6B). At 24 h after transfection, transfection rate was substantially lower indicating expiring eGFP expression. Thus, PM should not be transfected overnight. For BMDM, transfection rate reached about 80-85% (Figure 6C). The drop in transfection rate after 24 h was much less pronounced in BMDM. Thus, BMDM can be transfected overnight. In both PM (Figure 6D,E) and BMDM (Figure 6F,G), expression level of eGFP in transfected cells increased in a time- and dose-dependent manner. Importantly, the transfection procedure did not induce lytic or apoptotic cell death as there was no increase in propidium iodide-positive (PI) or annexin V-positive macrophages after transfection (Figure 7A,B).
Transfection efficiency of the mRNAs encoding for FLAG-tagged NEMO or IKKβ variants was analyzed by immunofluorescence microscopy. 300,000 PM per well of a 12-well plate were transfected with 300 ng of respective mRNA for 6 h. Transfection rate was about 60% for NEMO mRNAs and about 55% for IKKβ mRNAs (Figure 8A,B). Thus, their transfection rates were similar to that of eGFP mRNA indicating a general transfection rate of about 55% for PM.
We have also used this protocol to generate mRNA encoding for Cre recombinase. Transfection of 400,000 BMDM from NEMOflox/flox mice17 per well of a 12-well plate with 400 ng of Cre recombinase mRNA resulted in almost complete depletion for NEMO protein after 48 h (Figure 9) indicating highly efficient transfection of the BMDM.
PM and BMDM did not secrete any detectable amounts of IL-1β, IL-6 and TNF after transfection (Figure 10A,B). Moreover, the NF-kB and MAPK signaling pathways were not activated after transfection16 indicating that the transfection procedure does not activate proinflammatory signaling. We also have not observed any functional alterations of transfected macrophages in comparison to untransfected macrophages16.
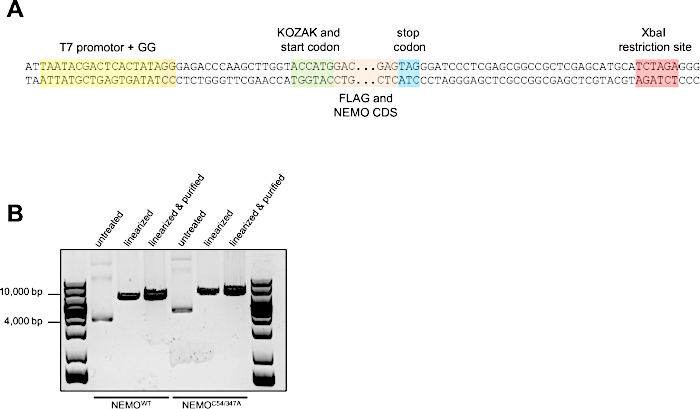
Figure 1: Linearization of NEMO-encoding plasmids already containing a T7 promotor in the correct orientation. (A) Sequence excerpt of the plasmid encoding for FLAG-tagged NEMOWT or NEMOC54/347A. A T7 promotor in correct orientation and close to the KOZAK sequence and start codon is already present. The T7 promotor region, the coding sequence (CDS) for the FLAG tag and NEMO, the start and stop codons and the restriction site for linearization with XbaI are color-coded. (B) Representative 1% agarose gel showing the plasmids before and after linearization with Xbal; 1 µL of untreated, linearized or purified linearized plasmid DNA was loaded per lane. Please click here to view a larger version of this figure.
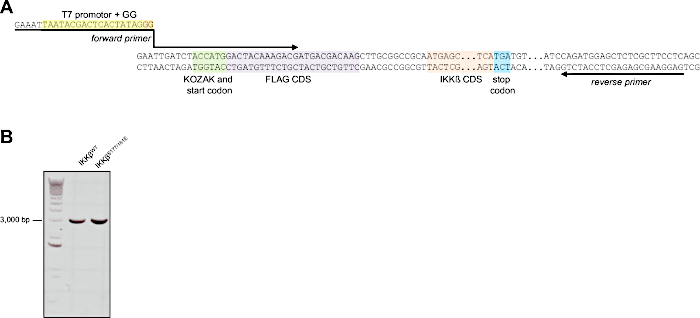
Figure 2: T7 promotor attachment to IKKß-encoding plasmids by PCR. (A) Sequence excerpt of the plasmid encoding for FLAG-tagged IKKβWT or IKKβS177/181E. The plasmids do not contain a suitable T7 promotor, which is therefore attached by PCR. Location, orientation and sequence of the forward primer (containing the T7 promotor sequence to be added) and the reverse primer are indicated by the arrows. The T7 promotor region, the CDS for the FLAG tag and IKKβ and the start and stop codons are color-coded. (B) Representative 1% agarose gel verifying generation of a single PCR product of correct size using the primers indicated above. 1 µL of the purified PCR product was loaded per lane. Please click here to view a larger version of this figure.
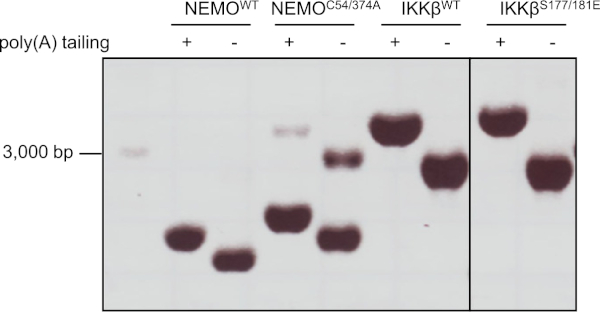
Figure 3: mRNA synthesis from NEMO- and IKKβ-encoding DNA templates. (A) Representative denaturing 1.2% agarose gel containing 0.7% formaldehyde showing the purified mRNA of NEMO and IKKβ constructs before and after poly(A) tailing. 2 µL of NEMOWT, NEMOC54/347A, IKKβWT and IKKβS177/181E mRNA were loaded per lane. A 32 µL ssRNA ladder was loaded for RNA length determination. Please click here to view a larger version of this figure.
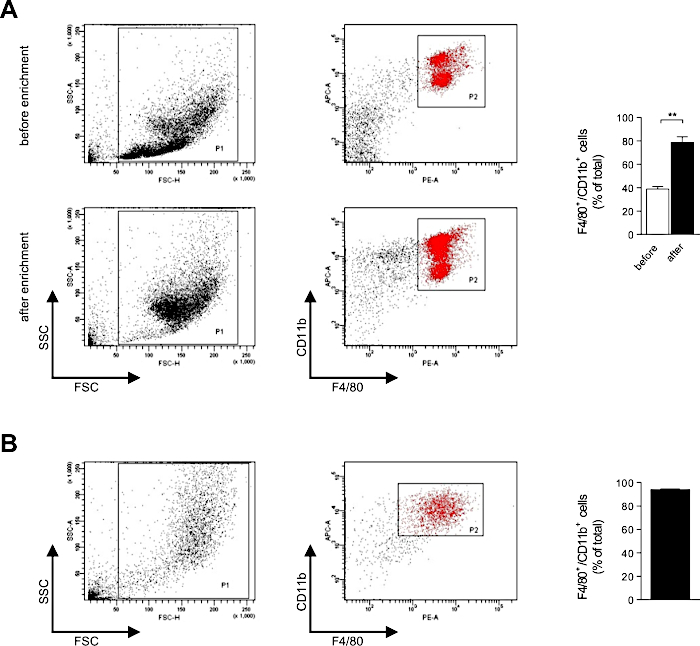
Figure 4: Flow cytometric analyses of the immunomagnetic enrichment of PM and the differentiation status of BMDM. (A) The percentage of F4/80+/CD11b+ PM in the peritoneal lavage before and after immunomagnetic enrichment was analyzed by flow cytometry. (B) Expression of F4/80 and CD11b by BMDM after 6 days of differentiation was verified by flow cytometry. 10,000 or 5,000 cells were counted per sample, respectively. Data are shown as mean ± SEM of n = 3 independent experiments, each. * P < 0.05, ** P < 0.01, *** P < 0.001 and **** P < 0.0001 by Student's t-test. Please click here to view a larger version of this figure.
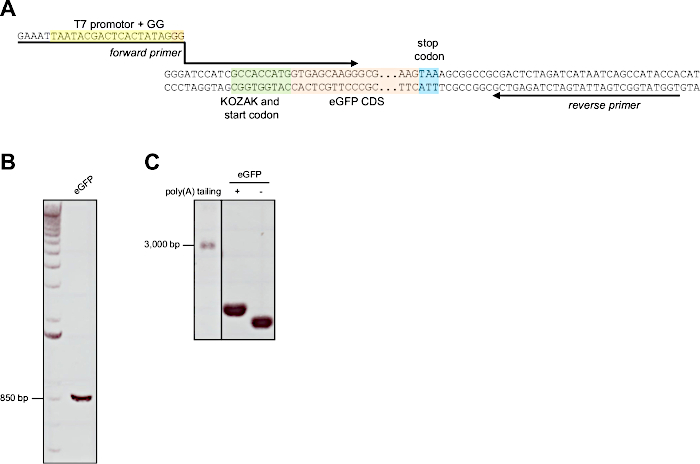
Figure 5: mRNA synthesis with poly(A) tailing of eGFP. (A) Sequence excerpt of the plasmid encoding for eGFP. The plasmid does not contain a suitable T7 promotor, which is therefore attached by PCR. Location, orientation and sequence of the forward primer (containing the T7 promotor sequence to be added) and the reverse primer are indicated by the arrows. The T7 promotor region, the CDS for eGFP and the start and stop codons are color-coded. (B) Representative 1% agarose gel showing the purified amplicon after PCR using the primers indicated above. 1 µL of the purified PCR product was loaded per lane. (C) Representative denaturing 1.2% agarose gel containing 0.7% formaldehyde showing the purified mRNA of eGFP before and after poly(A) tailing. 2 µL of eGFP mRNA were loaded per lane. A 32 µL ssRNA ladder was loaded for RNA length determination. Please click here to view a larger version of this figure.
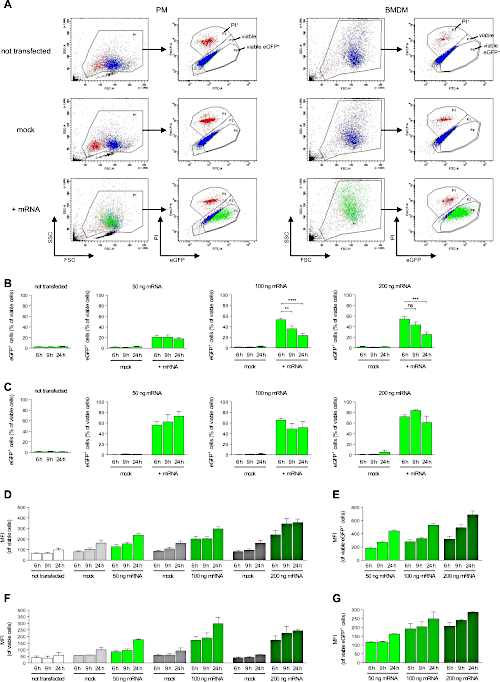
Figure 6: Highly efficient transfection of both peritoneal macrophages and BMDM with eGFP mRNA. Macrophages were incubated for 6, 9 or 24 h with 50, 100 or 200 ng of eGFP mRNA complexed to jetMESSENGER or with jetMESSENGER alone (mock) and then analyzed by flow cytometry. (A) Gating strategy used to define the populations of viable macrophages, viable eGFP+ macrophages and PI+ (i.e., dead) macrophages. Representative data for transfection with 200 ng mRNA for 6 h are shown. (B,C) Transfection rates of (B) PM and (C) BMDM were determined by analyzing the percentage of viable eGFP-positive cells by flow cytometry (n = 5-7 and n = 4-5 independent experiments, respectively). (D-G) Expression levels of eGFP were determined by analyzing the mean fluorescence intensity (MFI) of viable (D) PM and (F) BMDM and of the viable and eGFP-positive subpopulation of (E) PM and (G) BMDM (n = 5-7 and n = 4-5 independent experiments, respectively). 10,000 cells were counted per sample. Data are shown as mean ± SEM. n.s. = not significant; * P < 0.05, ** P < 0.01, *** P < 0.001 and **** P < 0.0001 by Student's t-test. Please click here to view a larger version of this figure.
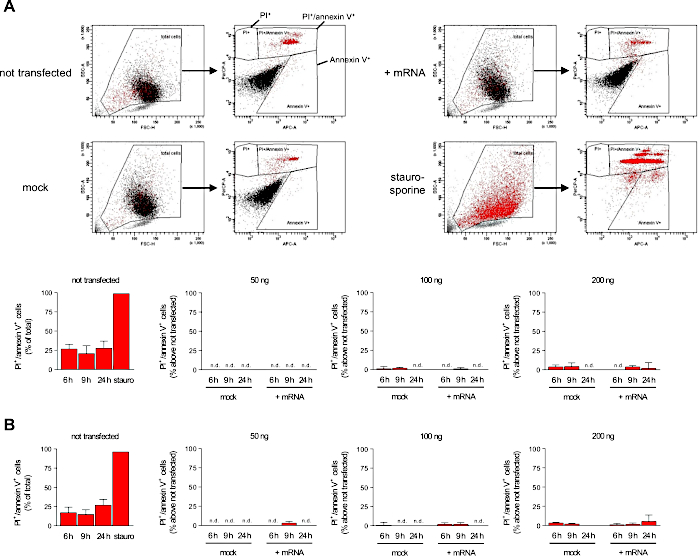
Figure 7: Transfection does not induce lytic or apoptotic cell death. Transfection-induced cell death of (A) PM and (B) BMDM was determined by analyzing the percentage of PI-positive and annexin V-positive cells (n = 5-7 and n = 4-5 independent experiments, respectively). The percentage of dead macrophages present in untransfected samples (some degree of cell death was caused by physical detachment of macrophages from the wells despite usage of non-treated plates) was subtracted from that in the respective transfected samples to only take into account cell death induced by the transfection procedure. The gating strategy used to define the populations of PI+, annexin V+ and PI+/annexin V+ macrophages is shown for a representative data set of PM transfected with 200 ng mRNA for 6 h are shown. Staurosporine (50 µM for 1 h) was used as positive control. 10,000 cells were counted per sample. Data are shown as mean ± SEM. n.d. = not detectable. Please click here to view a larger version of this figure.
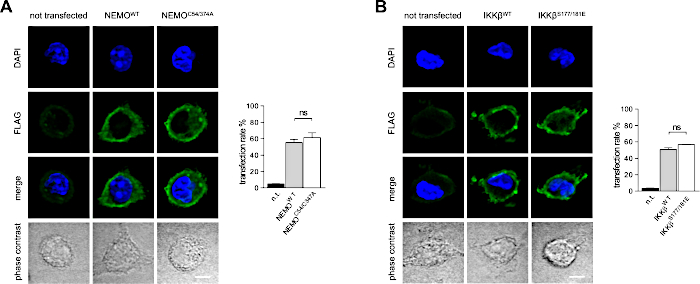
Figure 8: Transfection rates using mRNA encoding for NEMO and IKK constructs. Transfection rates using mRNA encoding for (A) NEMO constructs and (B) IKK constructs were quantified by immunofluorescence microscopy (n = 4 independent experiments). Scale bar = 4 µm. Data are shown as mean ± SEM. n.t. = not transfected, n.s. = not significant; * P < 0.05, ** P < 0.01, *** P < 0.001 and **** P < 0.0001 by Student's t-test. Please click here to view a larger version of this figure.
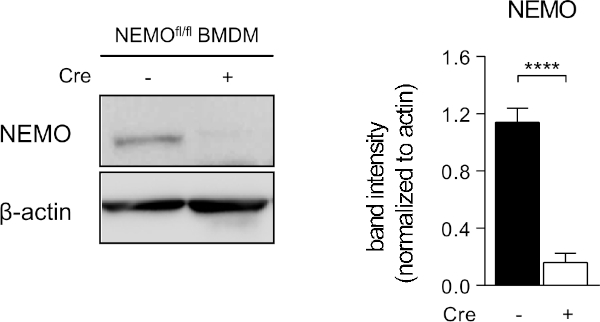
Figure 9: Transfection of NEMOfl/fl BMDM with mRNA encoding for Cre recombinase results in almost complete deficiency for NEMO. BMDM from NEMOfl/fl mice were transfected with mRNA encoding Cre recombinase for 48 h. Deficiency for NEMO protein as a result of Cre-mediated knockout was assessed by western blot using specific antibodies recognizing NEMO or β-actin and quantified by densitometry (n = 5 independent experiments). Data are shown as mean ± SEM. * P < 0.05, ** P < 0.01, *** P < 0.001 and **** P < 0.0001 by Student's t-test. Please click here to view a larger version of this figure.
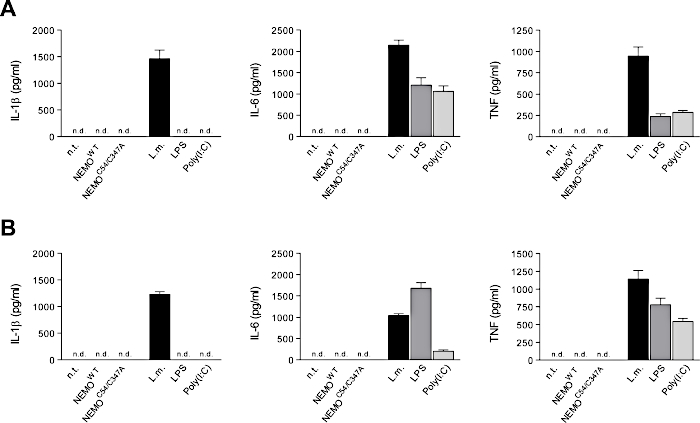
Figure 10: Transfection does not induce a proinflammatory response. (A) PM and (B) BMDM were transfected with mRNA encoding for NEMOWT or NEMOC54/347A. As positive control, macrophages were infected with Listeria monocytogenes at multiplicity of infection of 1 or stimulated with 5 µg/mL LPS or poly(I:C) for 5 h (PM) or 24 h (BMDM). Secretion of IL-1 β, IL-6, and TNF into the supernatant was quantified by ELISA (n = 3 independent experiments). Data are shown as mean ± SEM. n.t. = not transfected, n.d. = not detectable. Please click here to view a larger version of this figure.
Discussion
Here we present a protocol for highly efficient transfection of usually hard-to-transfect primary macrophages with in vitro transcribed mRNA. Importantly, transfection of the macrophages using this protocol does not induce cell death or activate proinflammatory signaling indicating that neither the transfection reagent nor the transfected mRNA are recognized as non-self.
The quality of the mRNA is of key importance for successful transfection of macrophages using this protocol. Thus, great care should be taken that the mRNA does not come into contact with RNAses (for example, through contaminated buffers or vials). If in doubt, check for mRNA degradation (for example, by agarose gel electrophoresis). Transfection rate and expression level were already maximal at 6 h after transfection. Therefore, it is possible that the protein of interest is expressed at levels sufficient for analysis at earlier time points after transfection. We have not tested this, though. Furthermore, transfecting larger quantities of mRNA may further increase transfection rate and/or expression level. However, transfecting larger quantities of mRNA may potentially also lead to some degree of immunogenicity or even cytotoxicity. The complete lack thereof is one of the main advantages of this protocol. Thus, if larger quantities of mRNA are to be transfected, immunogenicity and cytotoxicity have to be carefully evaluated.
Expression level clearly correlated with the amount of transfected mRNA. Yet, re-expression of NEMO in NEMO-deficient BMDM resulted in similar NEMO protein expression as in wildtype BMDM16 indicating that mRNA transfection using this protocol does not lead to substantial overexpression of the protein of interest. Thus, this protocol may not be suited for studying the consequences of overexpression of the protein of interest. We rather consider this an advantage, however, as overexpression of a protein often alters its behavior.
The main limitation of mRNA transfection, in general, is that it only results in transient expression of the protein of interest (because the mRNA generated and transfected using this protocol will be subject to normal turnover). PM seem to express the protein of interest for a shorter period of time as compared to BMDM. Thus, in contrast to BMDM, PM should not be transfected overnight. How long a given protein of interest will be expressed will vary (as both the stability of the mRNA and that of the protein will vary). We nevertheless recommend performing the experiment of choice on the same day as the transfection. If expression of the protein of interest is required for longer periods of time, the cells probably can be transfected multiple times (e.g., every day as described in18).
We have successfully used the protocol described here to transfect murine PM and BMDM and mouse embryonic fibroblasts (MEFs)16. In theory, the mRNA generated using this protocol can be used to transfect any given cell type of any mammalian species. The optimal mRNA transfection reagent and content of modified nucleosides may differ for other cell types, though.
Promising future modifications include the inclusion of the 5'- and 3'-UTRs. Most pre-existing plasmids do only contain the CCDS of the protein of interest but not the 5'- and 3'-UTRs. Their inclusion (as described in19) may further enhance mRNA stability and expression. Also, attaching epitope tags to the protein of interest by simply including the sequence of the epitope tag in the forward or reverse primer (for N- and C-terminal epitope tagging, respectively), should be possible.
Disclosures
The authors have nothing to disclose.
Acknowledgements
This work was supported by the Deutsche Forschungsgemeinschaft (SFB 670).
Materials
| 5-methyl-CTP (100 mM) | Jena Biosience | NU-1138S | stored at -20 °C |
| Antarctic phosphatase | New England BioLabs | M0289 | stored at -20 °C |
| Antarctic phosphatase reaction buffer (10X) | New England BioLabs | B0289 | stored at -20 °C |
| anti-NEMO/IKKγ antibody | Invitrogen | MA1-41046 | stored at -20 °C |
| anti-β-actin antibody | Sigma-Aldrich | A2228 | stored at -20 °C |
| Petri dishes 92,16 mm with cams | Sarstedt | 821,473 | stored at RT |
| CD11b Microbeads mouse and human | Miltenyi Biotec | 130-049-601 | stored at 4 °C |
| Cre recombinase + T7-Promotor forward primer | Sigma-Aldrich | 5′-GAAATTAATACGACTCACTATA GGGGCAGCCGCCACCATGTCC AATTTACTGACCGTAC-3´, stored at -20 °C |
|
| Cre recombinase + T7-Promotor reverse primer | Sigma-Aldrich | 5′-CTAATCGCCATCTTCCAGCAGG C-3′, stored at -20 °C |
|
| DNA purification kit: QIAquick PCR purification Kit | Qiagen | 28104 | stored at RT |
| eGFP + T7-Promotor forward primer | Sigma-Aldrich | 5´-GAAATTAATACGACTCACTATA GGGATCCATCGCCACCATGGTG AGCAAGG-3´, stored at -20 °C |
|
| eGFP + T7-Promotor reverse primer | Sigma-Aldrich | 5´-TGGTATGGCTGATTA TGATCTAGAGTCG-3´, stored at -20 °C |
|
| Fast Digest buffer (10X) | Thermo Scientific | B64 | stored at -20 °C |
| FastDigest XbaI | Thermo Scientific | FD0684 | stored at -20 °C |
| high-fidelity polymerase with proofreading: Q5 High-Fidelity DNA-Polymerase | New England Biolabs Inc | M0491S | stored at -20 °C |
| IKKβ + T7-Promotor forward primer | Sigma-Aldrich | 5′-GAAATTAATACGACTCACTATA GGGTTGATCTACCATGGACTACA AAGACG-3′, stored at -20 °C |
|
| IKKβ + T7-Promotor reverse primer | Sigma-Aldrich | 5′-GAGGAAGCGAGAGCT-CCATCTG-3′, stored at -20 °C | |
| in vitro mRNA transcription kit: HiScribe T7 ARCA mRNA kit (with polyA tailing) | New England BioLabs | E2060 | stored at -20 °C |
| LS Columns | Miltenyi Biotec | 130-042-401 | stored at RT |
| MACS MultiStand | Miltenyi Biotec | 130-042-303 | stored at RT |
| mRNA transfection buffer and reagent: jetMESSENGER | Polyplus transfection | 409-0001DE | stored at 4 °C |
| Mutant IKKβ IKK-2S177/181E plasmid | Addgene | 11105 | stored at -20 °C |
| Mutant NEMOC54/347A plasmid | Addgene | 27268 | stored at -20 °C |
| pEGFP-N3 plasmid | Addgene | 62043 | stored at -20 °C |
| poly(I:C) | Calbiochem | 528906 | stored at -20 °C |
| pPGK-Cre plasmid | F. T. Wunderlich, H. Wildner, K. Rajewsky, F. Edenhofer, New variants of inducible Cre recombinase: A novel mutant of Cre-PR fusion protein exhibits enhanced sensitivity and an expanded range of inducibility. Nucleic Acids Res. 29, 47e (2001). stored at -20 °C | ||
| pseudo-UTP (100 mM) | Jena Biosience | NU-1139S | stored at -20 °C |
| QuadroMACS Separator | Miltenyi Biotec | 130-090-976 | stored at RT |
| Rat-anti-mouse CD11b antibody, APC-conjugated | BioLegend | 101212 | stored at 4 °C |
| Rat-anti-mouse F4/80 antibody, PE-conjugated | eBioscience | 12-4801-82 | stored at 4 °C |
| recombinant M-CSF | Peprotech | 315-02 | stored at -20 °C |
| RNA purification kit: MEGAclear transcription clean-up kit | ThermoFisher Scientific | AM1908 | stored at 4 °C |
| RNAse-degrading surfactant: RnaseZAP | Sigma-Aldrich | R2020 | stored at RT |
| ultrapure LPS from E.coli O111:B4 | Invivogen | stored at -20 °C | |
| Wild type IKKβ plasmid | Addgene | 11103 | stored at -20 °C |
| Wild type NEMO plasmid | Addgene | 27268 | stored at -20 °C |
References
- Ley, K., Pramod, A. B., Croft, M., Ravichandran, K. S., Ting, J. P. How Mouse Macrophages Sense What Is Going On. Frontiers in Immunology. 7 (204), (2016).
- Zhang, X., Edwards, J. P., Mosser, D. M. The expression of exogenous genes in macrophages: obstacles and opportunities. Methods in Molecular Biolology. 531, 123-143 (2009).
- Guo, X., et al. Transfection reagent Lipofectamine triggers type I interferon signaling activation in macrophages. Immunology and cell biology. 97 (1), 92-96 (2019).
- Kariko, K., Weissman, D. Naturally occurring nucleoside modifications suppress the immunostimulatory activity of RNA: implication for therapeutic RNA development. Current Opinion in Drug Discovery and Development. 10 (5), 523-532 (2007).
- Van De Parre, T. J., Martinet, W., Schrijvers, D. M., Herman, A. G., De Meyer, G. R. mRNA but not plasmid DNA is efficiently transfected in murine J774A.1 macrophages. Biochemical and biophysical research communications. 327 (1), 356-360 (2005).
- Uchida, S., Kataoka, K., Itaka, K. Screening of mRNA Chemical Modification to Maximize Protein Expression with Reduced Immunogenicity. Pharmaceutics. 7 (3), 137-151 (2015).
- Kariko, K., et al. Incorporation of pseudouridine into mRNA yields superior nonimmunogenic vector with increased translational capacity and biological stability. Molecular Therapy. 16 (11), 1833-1840 (2008).
- Khantakova, J. N., et al. Transfection of bone marrow derived cells with immunoregulatory proteins. Cytokine. 108, 82-88 (2018).
- Franz, K. M., Kagan, J. C. Innate Immune Receptors as Competitive Determinants of Cell Fate. Molecular Cell. 66 (6), 750-760 (2017).
- Kaestner, L., Scholz, A., Lipp, P. Conceptual and technical aspects of transfection and gene delivery. Bioorganic & medicinal chemistry letters. 25 (6), 1171-1176 (2015).
- Kim, T. K., Eberwine, J. H. Mammalian cell transfection: the present and the future. Analytical and Bioanalytical Chemistry. 397 (8), 3173-3178 (2010).
- Kormann, M. S., et al. Expression of therapeutic proteins after delivery of chemically modified mRNA in mice. Nature Biotechnology. 29 (2), 154-157 (2011).
- Kariko, K., Buckstein, M., Ni, H., Weissman, D. Suppression of RNA recognition by Toll-like receptors: the impact of nucleoside modification and the evolutionary origin of RNA. Immunity. 23 (2), 165-175 (2005).
- Hornung, V., et al. 5′-Triphosphate RNA is the ligand for RIG-I. Science. 314 (5801), 994-997 (2006).
- Pichlmair, A., et al. RIG-I-mediated antiviral responses to single-stranded RNA bearing 5′-phosphates. Science. 314 (5801), 997-1001 (2006).
- Herb, M., et al. Mitochondrial reactive oxygen species enable proinflammatory signaling through disulfide linkage of NEMO. Science Signaling. 12 (568), (2019).
- Schmidt-Supprian, M., et al. NEMO/IKK gamma-deficient mice model incontinentia pigmenti. Molecular Cell. 5 (6), 981-992 (2000).
- Mandal, P. K., Rossi, D. J. Reprogramming human fibroblasts to pluripotency using modified mRNA. Nature Protocols. 8 (3), 568-582 (2013).
- Oh, S., Kessler, J. A. Design, Assembly, Production, and Transfection of Synthetic Modified mRNA. Methods. 133, 29-43 (2018).

